
Housing Market Intro and Summary
The pandemic recession is over as far as the housing market is concerned.
The case for V-shaped recoveries was evident in the last Housing Market Review. The recovery completed in August with important new highs in existing and new home sales and in home builder sentiment. Ultra-low interest rates support this historic rush to buy homes in the middle of a recession. A shift in mobility, household formation by millennials, and the lower attraction of cities are also driving this momentum. Inflation is a looming wildcard.
Last week, the Federal Reserve made an important policy shift from targeting 2% inflation to targeting an average of 2% inflation. The Fed now feels comfortable allowing inflation to run “hot” in order to make up for periods of low inflation. If the bond markets sniffs out success in this policy, long-term bond yields, and thus mortgage rates, will rise. Moreover, higher inflation almost certainly means rents will face further upward pressure. As a result, buying and owning a home NOW is more important than ever to promote and protect household wealth. The new economic dynamics will drive even larger wedges between those with assets and those without.

The iShares Barclays 20+ Year Treasury Bond Fund (TLT) is an easy way to keep an eye on long-term rates. Lower prices translate into higher bond yields. After a parabolic move in March, TLT settled into a multi-month consolidation period. Until the Fed’s policy shift, new highs in TLT seemed inevitable. Instead, a slow topping process may be underway. The housing market has proven itself extremely sensitive to interest rates given the high prices of homes. So any momentum toward higher mortgage rates could act like a swift ceiling on top of the housing market, especially if the economy is still struggling to deliver jobs and higher wages to the average American household.
Housing Stocks
Toll Brothers (TOL) reported earnings last week. The stock has traded down every day since. I closed out all my holdings in home builders, and TOL was the last one. I am now watching closely to see whether these stocks take a well-deserved rest after an impressive run-up and recovery from the March stock market crash.
Here are key quotes about the housing market from the transcript of the earnings conference call:
- “With the strength in demand, we increased prices in most of our communities this quarter. If this strength continues, we expect to keep raising prices.”
- “…many buyers want a new home and will only look at new homes. And with the importance of the home growing, they want to personalize their home more than ever…”
- “Our primary customer demographic, college educated professionals is working from home much more, and we believe, this will continue long-term…Their job prospects appear to be holding up well, which gives them confidence to buy a new home. In addition, they are more likely to have accumulated wealth from the strong stock market.”
- “Millennials, many of whom are now in their thirties and forming families, are buying homes. They have wealth from a combined 20 to 30 years of work generated savings, which can enable them to afford a first home that is bigger and higher priced than the typical starter home.”
- “We’ve seen a significant increase in relocation traffic to our communities in Boise, Salt Lake City, Las Vegas, and Reno, Metro Phoenix, Denver, Austin, and of course, Florida…”

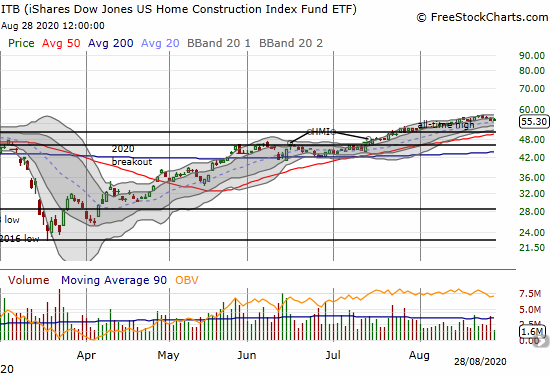
The stock charts of many home builders look just like the iShares Dow Jones US Home Construction Index (ITB). The strong price action forced me to abandon the seasonal trading and investing strategy in home builders in favor of chasing the unprecedented positive momentum of the pandemic recession. Given my recent bearish read on the stock market, I am not interested in buying back into home builders at the moment.
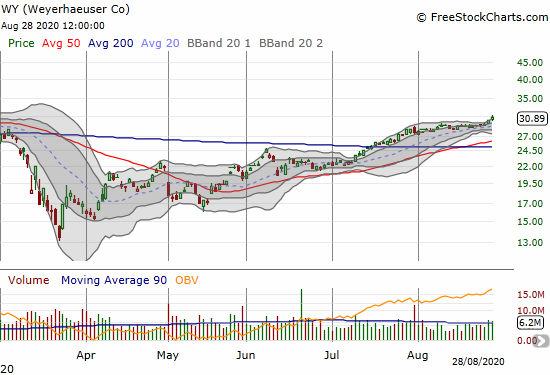
Soaring lumber prices and higher material prices in general keep me in stocks like lumber company Weyerhauser (WY) and materials company Owens Corning (OC) (Owens Corning was a bullish breakout special in July). As long as these higher prices do not dampen demand for housing, stocks like these are some of the best ways to bet on continued momentum in the housing market.
Housing Data
New Residential Construction (Single-Family Housing Starts) – July, 2020
Housing starts continued an impressive rebound even as they still lag the historic rebound in builder sentiment which hit an all-time high (see below). I expected starts to come back a lot more slowly than the current pace given the economic uncertainty related to the coronavirus pandemic. Builders paused land purchases and development during the pandemic, but they look ready to pick up where they left off.
July single-family home starts hit 940,000 which was 8.2% above June’s 869,000 starts (revised significantly upward from 831,000) and 7.4% above July, 2019. The rate of year-over-year change flipped positive for the first time since March, 2020 and symbolizes a complete rebound from the pandemic-driven crisis.
Source: US. Bureau of the Census, Privately Owned Housing Starts: 1-Unit Structures [HOUST1F], first retrieved from FRED, Federal Reserve Bank of St. Louis, August 23, 2020.
For June, the Northeast led all regions with the only positive year-over-year change. For July, the West lagged all regions with the only year-over-year decline. The Northeast, Midwest, South, and West each changed +23.3%, 6.5%, 12.3%, and -6.8% respectively. Starts in the West are still at a 13-month low which will surely contribute to lasting extremes of inventory shortages (and higher prices) in the region.
Existing Home Sales – July, 2020
Existing home sales powered to post financial crisis highs. despite plunging inventories and soaring prices.
A divergence between declining sales and increasing prices for existing home sales grew for three straight months through May. For June, existing home sales finally increased month-over-month for the first time since the February, 2020 peak. For July, existing home sales jumped past the February peak to a new record post financial crisis. The National Association of Realtors (NAR) celebrated another record performance with gushing optimism for next year: “The housing market is well past the recovery phase and is now booming with higher home sales compared to the pre-pandemic days…With the sizable shift in remote work, current homeowners are looking for larger homes and this will lead to a secondary level of demand even into 2021.” This statement is quite remarkable given past lamentations about limited inventory putting a ceiling on sales and soaring prices curbing affordability.
The seasonally adjusted annualized sales in July of 5.86M were up 24.7% month-over-month from the downwardly revised 4.7M (from 4.72M) in existing sales for June. Year-over-year sales finally increased with a jump of 8.7%.
Condos led the way downward during the pandemic by plunging to levels unseen since at least 1999 (available data). Condos continue to lag on the way up. For instance, while condos soared 31.8% from June to July, they were flat with July, 2019 sales.

(As of the March, 2018 data, the NAR further reduced historical data to just 13 months. For historical data from 1999 to 2014, click here. For historical data from 2014 to 2018, click here) Source for chart: National Association of Realtors, Existing Home Sales© [EXHOSLUSM495S], retrieved from FRED, Federal Reserve Bank of St. Louis, August 23, 2020.

Inventory levels continued year-over-year declines and keep the market for existing homes tightly constrained. The impact on July’s prices was dramatic.
Absolute inventory levels of 1.50M homes decreased 2.6% from June after two straight months of sequential gains. Inventory plunged 21.1% from a year ago (compare to June’s 18.2%, May’s 18.8%, April’s 19.7%, March’s 10.2%, February’s 9.8%, January’s 10.7% and December’s 8.5% year-over-year declines, unrevised). “Unsold inventory sits at a 3.1-month supply at the current sales pace, down from 3.9 months in June and down from the 4.2-month figure recorded in July 2019.” The on-going year-over-year decline in inventory is now on a 14-month streak.
The median price of an existing home hit a new record of $304,100, a year-over-year surge of 8.5% and the 101st straight month of a year-over-year gain. The median price jumped from June by 3.3%.
First-timer home buyers took a 34% share of sales in July. This share has little changed since March. The NAR’s 2017 Profile of Home Buyers and Sellers reported an average of 34% for 2017, 33% for 2018, and 33% for 2019.
Investors stepped into the breach in May by increasing from April’s 10% share of sales to 14%. This share plunged down to 9% in June which seemed to be a seasonal pattern. Investors freshly rushed into the market by grabbing a 15% share of sales in July. Investors confirmed the relative attractiveness of the market for existing homes.
The Western region led the June regional month-over-month changes after two straight months of leading the regions downward on a year-over-year basis. The West effectively tied the Northeast in July: the West soared 30.5% from June to July, and the Northeast surged 30.6% over the same time period. The Northeast was still the only region with a year-over-year decline. In July, the regional year-over-year changes were: Northeast -5.9%, Midwest +10.3%, South +12.6%, West +7.8%.
From September through April, all regions experienced notable and robust price jumps. In May, the West finally broke that streak with a rare price pullback. The regions all lined up for solid gains in June and even greater gains in July. Here are the July regional year-over-year changes in median home prices: Northeast +4.0%, Midwest +8.0%, South +9.9%, West +11.3%.
Single-family home sales increased 23.9% from June and increased on a yearly basis by 9.8%. The median price of $307,800 was up 8.5% year-over-year and up notably from June’s $297,900.
The broadening fortunes in the market for existing home sales were evident in July’s “hottest markets” with smaller and midwest markets included in the list and coastal markets missing from the list: Topeka, Kan.; Rochester, N.Y.; Burlington, N.C.; Columbus, Ohio; and Reading, Pa. These kinds of markets should continue to lead as soaring prices in denser markets and work-from-home options enable and motivate buyers to spread out to smaller markets.
California Existing Home Sales – July, 2020
Sales of existing homes in California followed the national patterns. The report from the California Association of Realtors (C.AR.) provided additional information on market drivers and revealed some startling records and extremes in California.
In May, California suffered an historic drop in sales of existing single-family homes. The 238,740 annualized homes sold was the lowest since at least March, 2008. June delivered a rebound for the record books as sales increased 42.4% for the largest month-over-month gain since the C.A.R. started collecting records almost 40 years ago. July sales jumped 28.8% month-over-month and 6.4% year-over-year to 437,890, a 2 1/2 year high.
A shift in mix toward more expensive homes sent the median price soaring at a record monthly pace of 6.5% in June. July set a fresh record pace with a further shift to more expensive homes, especially over a million dollars. The median price pushed to a 6.4% month-over-month gain. This jump was the largest June to July increase on record. These large shifts in mix run contrary to the push of home builders toward more affordable offerings.
On a year-over-year basis, the median price increased 2.5% despite a 12.8% plunge in sales in June. With sales soaring, the median price surged 9.6% year-over-year. The rush to buy homes sent inventory plunging further as sellers remain as reluctant as ever to post listings. Active listings declined a whopping 43% year-over-year in June and 48% in July. July’s drop is the largest year-over-year decline since 2013. Every region in California suffered at least a 30% drop in active listings. Ironically, C.A.R.’s monthly Google poll showed consumers are growing more positive about selling: “…54 percent of consumers said it is a good time to sell, up from 44 percent a month ago, and up from 52 percent a year ago.” Words are clearly not yet turning into action. Perhaps in coming months “pent-up” selling interest will start to catch up with the unleashing of pent-up demand.
Inventory was 4.3 months of supply in May. June’s supply dropped to 2.7 months, and July’s dropped even further to a rock bottom 2.1 months. The Bay Area and the Central Valley tied for California’s lowest inventory at 1.8 months of supply.
I previously wondered whether the counter-trend shift in price mix could be temporary. Perhaps Californians with jobs and resources were acting a little faster to buy homes. However, July’s report suggests that the shift could be longer-lasting: “Stronger sales of higher-priced properties continue to propel the statewide median home price, as those who tend to purchase more expensive homes are less impacted by the economic recession…High demand in resort communities is another variable that’s fueling the increase in home prices, as a new wave of remote workers are leaving cities in search of more space and a healthier lifestyle in what used to be the second/vacation home market.”
Incredibly, this kind of high-end demand is unfolding in the middle of a deep recession.
New Residential Sales (Single-Family) – July, 2020
New home sales took me aback in June. For July, the data truly startled me. The economy remains stuck in the middle of a deep recession, and new home sales are not only strong….they are accelerating.
July new home sales hit a 13 1/2 year high. The 901,000 in annualized sales jumped 13.9% from June’s upwardly revised 791K (up from 776K) June’s sales. Year-over-year sales soared 36.3%. Year-over-year sales were last this strong in February, 1996.
Source: US. Bureau of the Census, New One Family Houses Sold: United States [HSN1F], first retrieved from FRED, Federal Reserve Bank of St. Louis, August 25, 2020.
Since hitting a peak in November and December, 2017, the median price of a new single-family home trended slightly downward largely from an increase in entry-level and lower-priced new homes. Prices have now stabilized. In July, the median price actually dropped 1.9% from June’s level while increasing 7.2% year-over-year.
Home builders talk a lot about driving sales at more affordable price points yet the shift from May to June was mostly about homes at higher price points. Homes priced from $150,000 to $199,999 plunged in share from 11% to 6% while all homes priced $400,000 and above increased in share. The script flipped in July as the $400-499K price range plunged in share from 19% to 12%. The $200 to 299K range was the only other price band that decreased.
The monthly inventory of new homes increased from 5.0 to 6.4 months of sales in March. May’s strong demand pushed inventory back to 5.6 months of sales. June’s inventory was just 4.7 months of sales. July fell further to 4.0 months of sales.
In June, sales gains did not occur across all regions. Each region soared in growth. July year-over-year sales in the Northeast “cooled down” from a 111.5% growth rate to 25.0%. The Midwest surged 88.1%. In June, the South ended three straight months of gains with a 1.8% drop. For July, the South grew 27.6% year-over-year. The West burst higher with a 40.8%% gain.
Home Builder Confidence: The Housing Market Index – August, 2020
The National Association of Home Builders (NAHB) reported an historic NAHB/Wells Fargo Housing Market Index (HMI). All the sudden, HMI is at an all-time record of 78 which ties the HMI from December, 1998. The HMI went from an 8-year low to an all-time high in just 5 months. This incredibly sharp V-recovery was far from my radar when I predicted that Fannie Mae’s post-pandemic housing forecast was over-optimistic. I used the plunge in builder sentiment as a foundation of my critique. NOW, Fannie Mae’s forecast does not look optimistic enough!
The component measuring the traffic of prospective buyers led the way again as it managed to close at an all-time record high (data back to 2004). The other two components returned to levels seen right before the pandemic. Not only are builders firmly confident, but also they are as optimistic about the future as they can be. Builders have truly left the post-pandemic recession far behind.
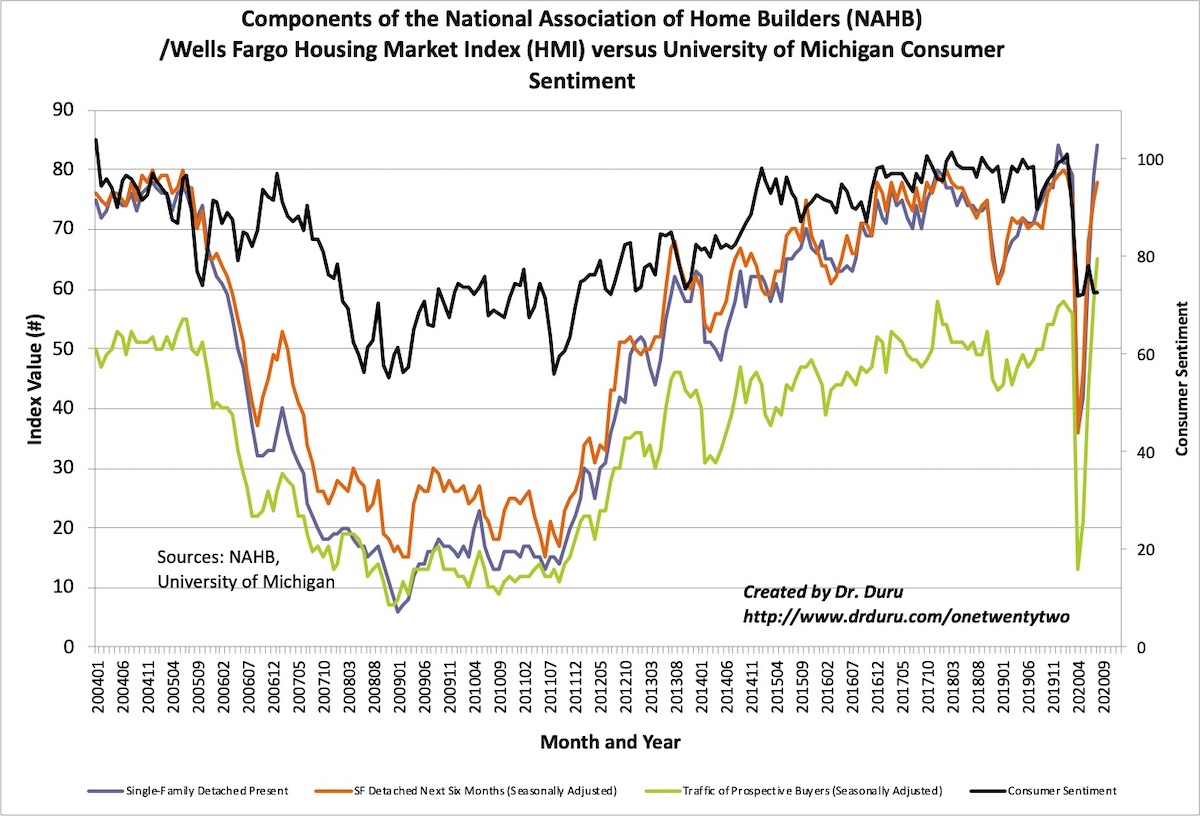
Source: NAHB
This soaring optimism continues to contradict languishing consumer sentiment. The HMI and consumer sentiment are often well-correlated, however a two-speed housing market in a two-speed economy can support divergent sentiment readings: the economically distressed express their worries and the economically well-off continue to buy homes.
The NAHB referenced the rush for housing in lower density areas: “Single-family construction is benefiting from low interest rates and a noticeable suburban shift in housing demand to suburbs, exurbs and rural markets as renters and buyers seek out more affordable, lower density markets.”
The NAHB also again expressed concerns about cost, this time focusing on soaring lumber prices:
“…the V-shaped recovery for housing has produced a staggering increase for lumber prices, which have more than doubled since mid-April. Such cost increases could dampen momentum in the housing market this fall, despite historically low interest rates.”
For the third month in a row, all regions recorded gains although the Midwest barely made it. The Northeast was a surprising leader in July. August’s 77 made the Northeast the only region to hit an all-time high (data back to 2004) . The Midwest inched another point higher and hit an 8-month high. The West soared another 8 points to hit levels last seen at the peak of the housing bubble. The South’s HMI returned to February, 2020’s level.
Home closing thoughts
Housing Affordability
Over the years I have made a point to discuss the growing. inequities in the housing market. These imbalances have enabled those with resources to grow asset rich and have burdened the lower rungs of the economy with increasing rents. The Federal Reserve’s campaign to drive its monetary policy rate to zero sent mortgage rates to historic lows. Suddenly, homes in some markets are more affordable as prices have not yet soared to keep pace with dropping rates. Title insurance company First American’s “real price index” is down 5% nationally year-over-year. This newfound affordability helps support the housing boom even in this pandemic.
Cities In Trouble?
The flip side of the housing boom are the cities people are leaving behind. The American Enterprise Institute published a piece titled “Cities are suffering” which described emotionally depressed city-dwellers and higher livability metrics outside the cities. The survey results in this piece help explain some of the migration out of (dense) cities.
Be careful out there!
Full disclosure: long WY, long OC