

The Market Breadth Summary
- The “market top looms” thesis strengthened as deteriorating market breadth, rising bond yields, and weakening consumer-facing stocks diverged sharply from new all-time highs in the S&P 500 and NASDAQ.
- A major IPO fade, bond markets tumbling (lower prices, higher yields), further deterioration in market breadth, increasing weakness in consumer-facing stocks, and bulls “trapped” chasing all-time highs, all point to a major warning of an imminent market top.
- Rising volatility risk remained a concern as the VIX held support despite continued index strength, creating conditions consistent with a potential market correction.
This is the week I finally had to turn bearish on the stock market. The warning signs have piled up too high for me to continue ignoring them. The momentum in the S&P 500 and NASDAQ has been incredibly strong, and that momentum kept me from making this call earlier. However, the evidence of a market top looming has pushed me off the ledge of my neutral short-term trading call.
One of the latest warning signs came from the IPO market. Cerebras Systems (CBRS), a highly anticipated tech and AI-related IPO raised its IPO price several times, went out at $185, opened at $350, ran up to $385, and closed at $311.07. CBRS fell another 10% on Friday. Anyone who bought after trading opened is trapped in a terrible position as the biggest IPO of the year turns into a dud. Perhaps seeing the writing on the wall of the last breaths of a manic rally, SpaceX reportedly accelerated its blockbuster IPO to mid-June. An IPO like this one with a record valuation of $1.75 trillion needs market indices that care about nothing except buying. A top looms in this kind of market.
Meanwhile, the bond market has been sounding alarms all month while the stock market has happily ignored the bond market. Bond yields across major economies have continued climbing. Japan and the United Kingdom both saw long-duration yields hit multi-decade highs. The bond market sees inflationary pressure amid growing concerns about massive sovereign debt loads. The stock market sees it but cares not. It is time you and I pay attention given stocks traditionally fare poorly in regimes of rising rates.
Geopolitics also continues to loom over the market. The China-US summit failed to deliver meaningful progress (no surprise to me). While the absence of major conflict was a significant positive, there were no transformational announcements capable of changing the broader geopolitical environment or cooling the economic war between the two countries. At the same time, tensions with Iran continue to linger beneath the surface despite repeated claims of ceasefires and an open Strait of Hormuz. Accordingly, oil prices have remained elevated since the war against Iran erupted. The pressures can most easily be seen in tumbling consumer-facing stocks but not in the major indices.
Finally, with market breadth closing the week at another cycle low, the technical deterioration underneath the surface of the market indices has created an ever more severe bearish divergence. Note well that when I call myself bearish, I am not panicking and selling everything. Instead, risk management becomes top of mind. I want to lock in profits on positions that have dramatically exceeded expectations, while cutting weak positions that likely will not “survive” coming out of a market correction.
Having said all that, I recognize that NVIDIA’s (NVDA) earnings report coming on Wednesday provides a near-term catalyst that could (temporarily) stabilize the failing technicals of the market sentiment. Once the shine from those earnings wear off, non-AI related stocks will likely resume their weakness. Watch out below if NVDA manages to disappoint.
The Stock Market Indices
The S&P 500 (SPY)
The S&P 500 hit an all-time high on Thursday and gapped down on Friday for a 1.2% closing loss. The reversal trapped buyers who chased the pricing action that day. While the overall uptrend remains technically intact, those late buyers create overhang as they decide whether and when to stop out of losses. Moreover, the index is well overdue for a “rest” like a test of uptrending support at the 20-day moving average (DMA) (dotted line).
")
NASDAQ (COMPQ)
The NASDAQ, like the S&P 500, showed signs of exhaustion after trapping buyers chasing Thursday’s all-time highs. The tech-laden index gapped down further and included a failed attempt to close the gap. The index’s 1.5% loss is a drop in the bucket compared to the 10.9% gain from the breakout at 24,000 to the all-time high. Still, given the ongoing technical and fundamental deterioration in the market, I am much more sensitive to such small signs of early bearishness. Trading volume has also been steadily increasing in May, adding to the impression of momentum toward a blow-off top.
Like the S&P 500, the NASDAQ remains significantly extended above its major moving averages. Momentum has hidden these risks for months, but I believe those extensions have now reached concerning levels. I feel well positioned with a pairs trade long an SPY call spread and a QQQ put spread, June monthlies.
")
iShares Russell 2000 ETF (IWM)
IWM topped out ahead of the S&P 500 and the NASDAQ. It is now the first of the three indices to fall below its 20DMA. IWM underperformed with a 2.4% loss on heavy trading volume. I had not yet concluded I would switch my short-term trading call to bearish when I dutifully opened my next trade on IWM call options (this time a weekly calendar call spread at the $285 strike).
I also made a trading mistake with my last IWM call spread earlier in the week. Monday’s small gain gave me the opportunity to close out of the position with a small net gain. However, I became greedy and lost discipline. I even tripled down when IWM fell to 20DMA support the next day. In isolation that second trade made sense, but in combination with my existing position, I failed to take small profits out of an expectation for more; yet more lessons learned for me!
")
The Short-Term Trading As A Market Top Looms
- AT50 (MMFI) = 49.7% of stocks are trading above their respective 50-day moving averages
- AT200 (MMTH) = 50.4% of stocks are trading above their respective 200-day moving averages
- Short-term Trading Call: cautiously bearish
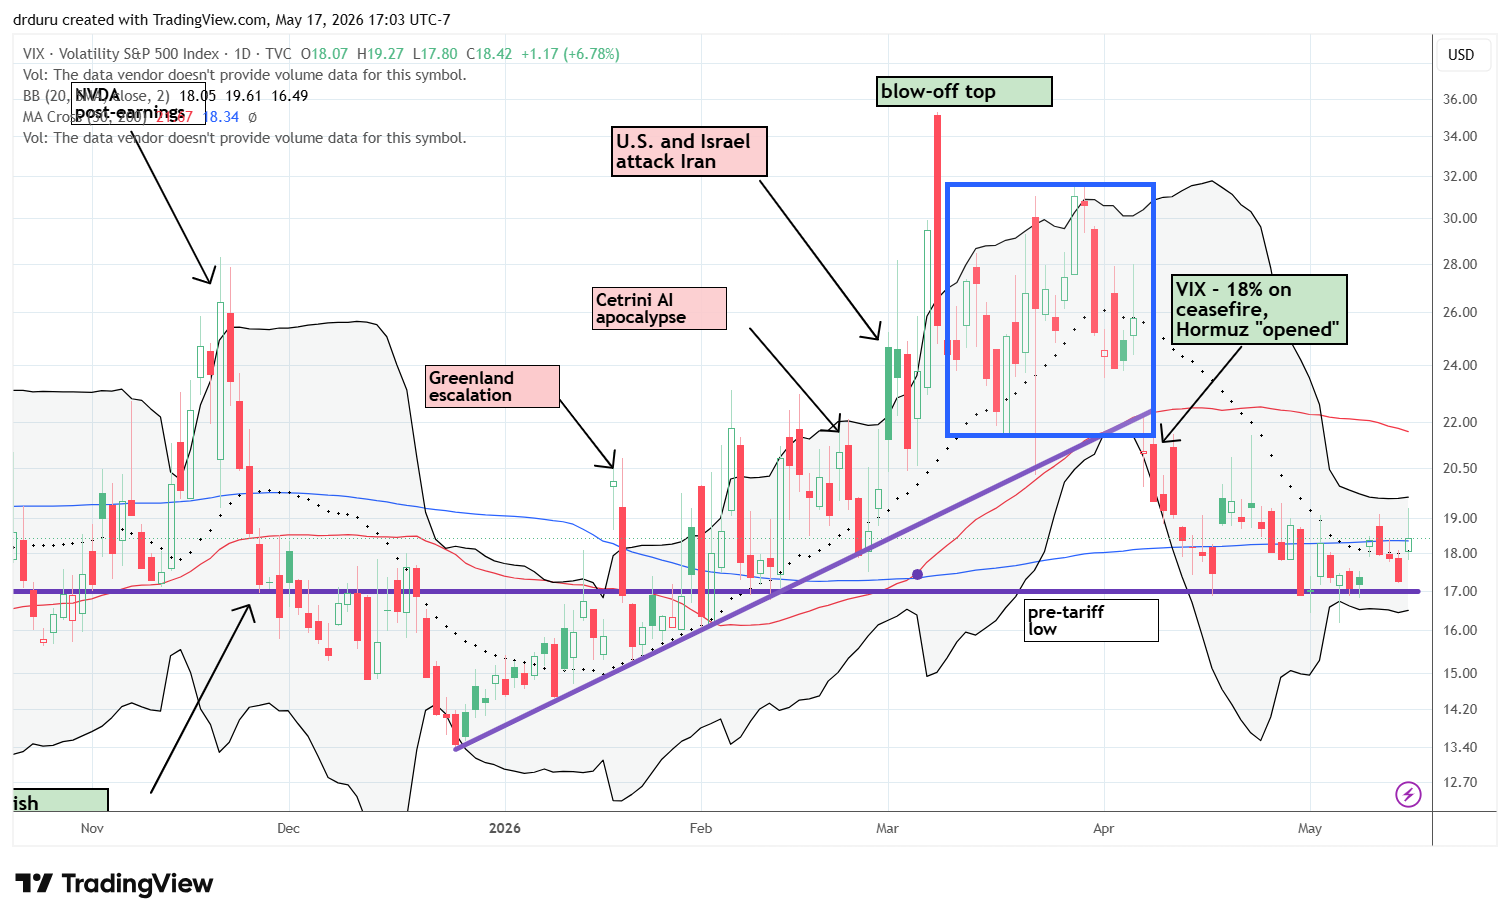
AT50 (MMFI), the percentage of stocks trading above their respective 50DMAs, closed the week at 49.7%. My favorite technical indicator hit a 1+ month low and returned to its level shortly after the U.S., Israel, and Iran announced a ceasefire. AT50 has deteriorated sharply after three times fading from the 70% overbought threshold a month ago. Per the AT50 trading rules, the stock market has been bearish this entire time. I am only now officially recognizing this bearishness in the short-term trading call given the confluence of bearish signals.
")
AT200, the percentage of stocks trading above their respective 200DMAs, also broke down toward bearish territory. AT200 closed at 50.4%, dangerously close to the trading zone that marked the precariousness of the market in March and April. This indicator of the longer-term health of market breadth also confirmed another lower high for the year.
")
Finally, the volatility index (VIX) is holding firm support at the pre- tariff (2025) low. This “fear gauge” has resisted the major push higher by the major indices. Thus, this month-long consolidation period looks like a calm before a storm (a higher VIX and lower market).
In case you missed it…
Bearishness was on my mind all week from TJX Companies (TJX) to Micron Technology (MU).
The Equities
iShares 20+ Year Treasury Bond ETF (TLT)
Description: iShares 20+ Year Treasury Bond ETF tracks the investment results of an index composed of U.S. Treasury bonds with remaining maturities greater than 20 years.
Technical status: The iShares 20+ Year Treasury Bond ETF (TLT) confirmed 20DMA resistance and dropped down below its lower Bollinger Band for a 2 1/2 year low.
Trade commentary: Stock investors have ignored the message from the bond market for too long. Rising yields are creating major pressure throughout the financial system, especially given the enormous refinancing burden facing governments. Still, at some point policymakers will attempt to force yields lower. When they do, I am ready to jump into commodities even more aggressively. I am also targeting another small TLT to grab the higher yields while they last.
")
iShares Silver Trust (SLV)
Description: iShares Silver Trust is an exchange-traded fund designed to reflect the performance of the price of silver.
Technical status: The iShares Silver Trust (SLV) suffered a 50DMA breakdown on an 8.6% loss and gap down.
Trade commentary: Silver is one of many commodities that sold off sharply on Friday as interest rates spiked higher. I was partially successful in my SLV trade only because I doubled down on the long side of the call spread when SLV tested 20DMA support. I was subsequently bailed out last week with a strong 50DMA breakout. When SLV stalled on Thursday I reloaded on a call spread (June 80/90). Friday’s 8.6% loss and 50DMA breakdown quickly dunked that position into the red.
")
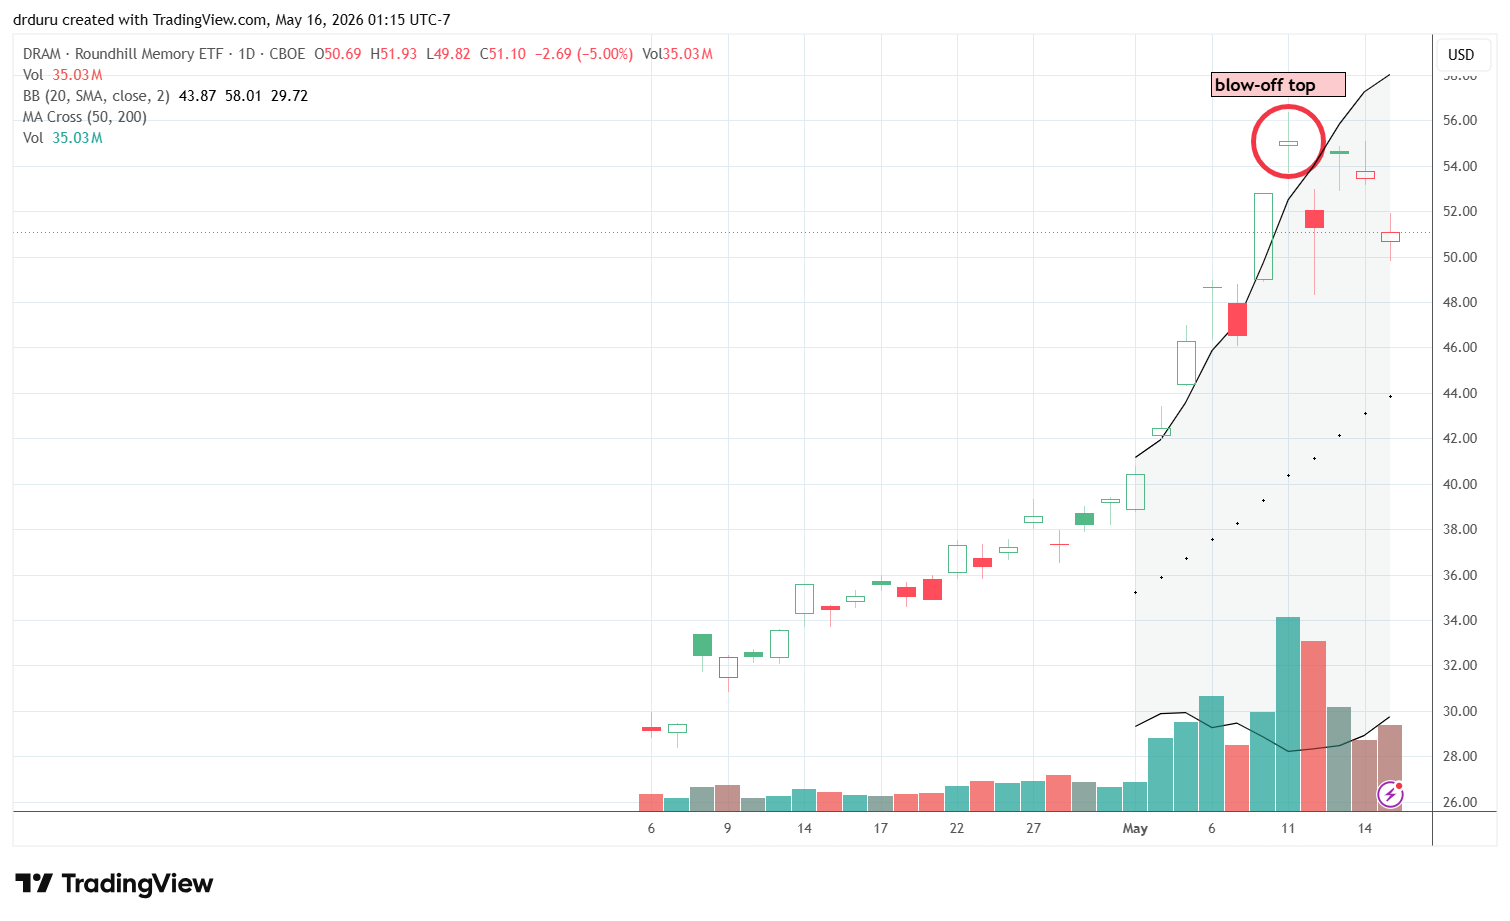
Roundhill Memory ETF (DRAM)
Description: Roundhill Memory ETF provides exposure to companies involved in memory semiconductors and related technologies.
Technical status: Roundhill Memory ETF (DRAM) formed a potential blowoff top after a huge gap higher was followed by a sharp reversal lower.
Trade commentary: DRAM looks like a major warning sign for the AI and semiconductor trade. If this blowoff top fully resolves lower with a break below $48, the selling in the sector and related AI trades could accelerate. Given the AI trade has powered the major indices higher, I interpret the blow-off top in DRAM as a major warning sign.
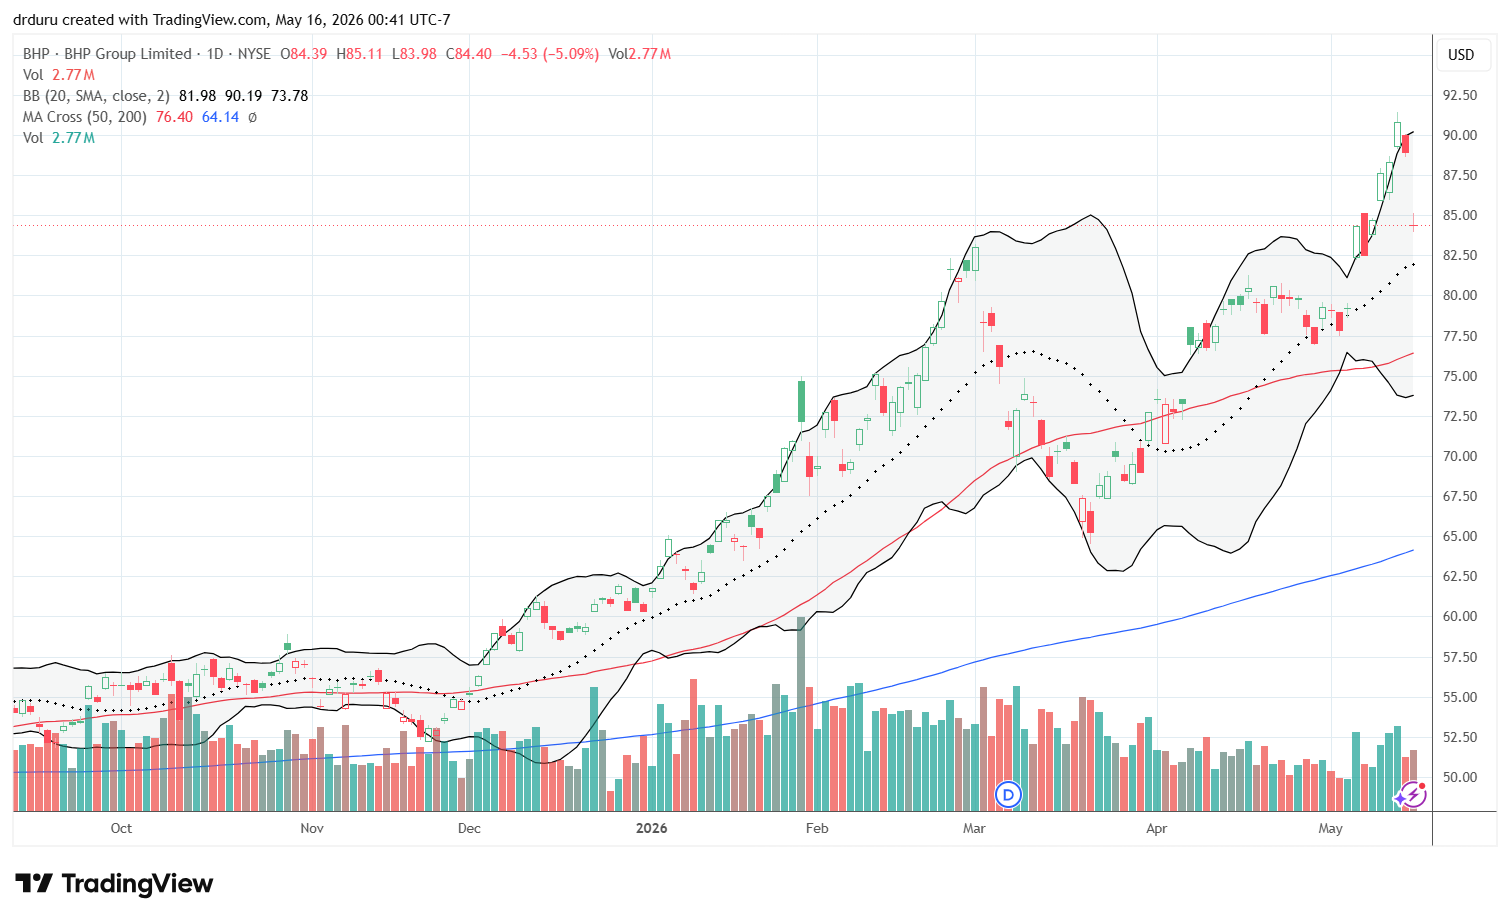
BHP Group Limited (BHP)
Description: BHP Group Limited is a global resources company that produces iron ore, copper, nickel, potash, and metallurgical coal.
Technical status: BHP Group Ltd (BHP) fell 5.1% shortly after closing at an all-time high.
Trade commentary: I remain long BHP despite the sharp decline. Earlier, I tried getting too clever with commodity trades, but I have decided to just stick with the trend and a larger investment cycle that will continue upward pressure on resources.
TJX Companies Inc (TJX)
Description: The TJX Companies operates off-price retail stores selling apparel, footwear, home fashions, and other merchandise.
Technical status: TJX Companies Inc (TJX) broke down below its 200DMA, nearing the 2026 intraday low.
Trade commentary: Per the YouTube short I posted above, I claimed that retail stocks needed TJX to hold support at its 200DMA (the blue line). It failed. After an heroic effort on Tuesday to rebound from a second plunge below the 200DMA, TJX gave up on Wednesday. A 2.2% loss only stopped at support from the 2026 intraday low. The company reports earnings before the market opens on Wednesday. I will be watching for the next critical technical signal from this important retailer.
")
Wingstop Inc. (WING)
Description: Wingstop operates and franchises restaurants specializing in chicken wings and related menu items.
Technical status: Wingstop Inc (WING) faded from 50DMA resistance and rapidly declined from here. The downtrend remains in place despite an 8.6% rebound on Friday.
Trade commentary: WING is showing signs that investors are trying to get ahead of consumer weakness. The failed rebound in April was particularly important because the stock failed directly under downtrending 50DMA resistance. Friday’s 8.6% rebound and countertrend rally ended 14 straight days of selling. WING has looked like a short for a long time, but I have never brought myself around to executing because the 13.5% short interest looks like a short squeeze waiting to happen anytime. Yet, the shorts have been “right” for quite some time. WING printed a double top in 2024 and now trades at a 3 1/2 year low.
")
Abercrombie & Fitch Co. (ANF)
Description: Abercrombie & Fitch Co. is a specialty retailer that sells apparel, personal care products, and accessories through multiple lifestyle brands.
Technical status: Abercrombie & Fitch Co (ANF) has tumbled along its lower Bollinger Band for a month and is now positioned to test lows from November.
Trade commentary: I view ANF as another major warning signal among consumer-facing stocks. If the stock fails to hold prior lows, there is substantial downside air beneath it that could send shares back toward levels last seen in 2023. I tried to be hopeful about ANF, but the 50DMA and 200DMA breakdowns last month pushed the stock deep into bearish territory.
")
Birkenstock Holding plc (BIRK)
Description: Birkenstock Holding plc designs, manufactures, and sells footwear products including sandals, shoes, and foot care products.
Technical status: Birkenstock Holding PLC (BIRK) plummeted below its 50DMA with a 12.9% post-earnings loss and continuing to an all-time low.
Trade commentary: BIRK was once a hot IPO, but the stock has completely unraveled since peaking in 2024. This latest post-earnings collapse is one more warning sign about the market’s underlying appetite for speculating.
")
Dollar Tree Inc (DLTR)
Description: Dollar Tree operates discount retail stores that sell consumable, variety, and seasonal merchandise, including food, household products, health and beauty products, toys, gifts, and party supplies.
Technical status: Dollar Tree Inc (DLTR) attempted to recover after dropping to a 7-month low.
Trade commentary: DLTR is yet another consumer-facing warning sign. The only thing that held the stock up this week seemed to be the lows from last September or October. Since DLTR already broke below its 200DMA, I have to treat the stock as bearish.
")
Dollar General Corp (DG)
Description: Dollar General operates retail stores that sell packaged and refrigerated food, dairy products, cleaning supplies, paper products, health and beauty items, apparel, housewares, hardware, and automotive supplies.
Technical status: After its last 200DMA breakdown, Dollar General Corp (DG) quickly fell to a 7-month low.
Trade commentary: DG added to the bearish signals coming from consumer-facing stocks. DG is also no longer outperforming on a relative technical basis. The stock opened the week with a 7.6% loss and locked in the bearish tone.
")
Caseys General Stores Inc (CASY)
Description: Caseys General Stores operates convenience stores offering fuel, prepared foods, beverages, and grocery items.
Technical status: Caseys General Stores Inc (CASY) has steadily increased for years. The stock now looks ready to test its 20DMA uptrend after falling from an all-time high.
Trade commentary: Retail is not all bearish of course. CASY is on an impressive multi-year run. The pullback to close the week does not even show up on the radar of its runup.
")
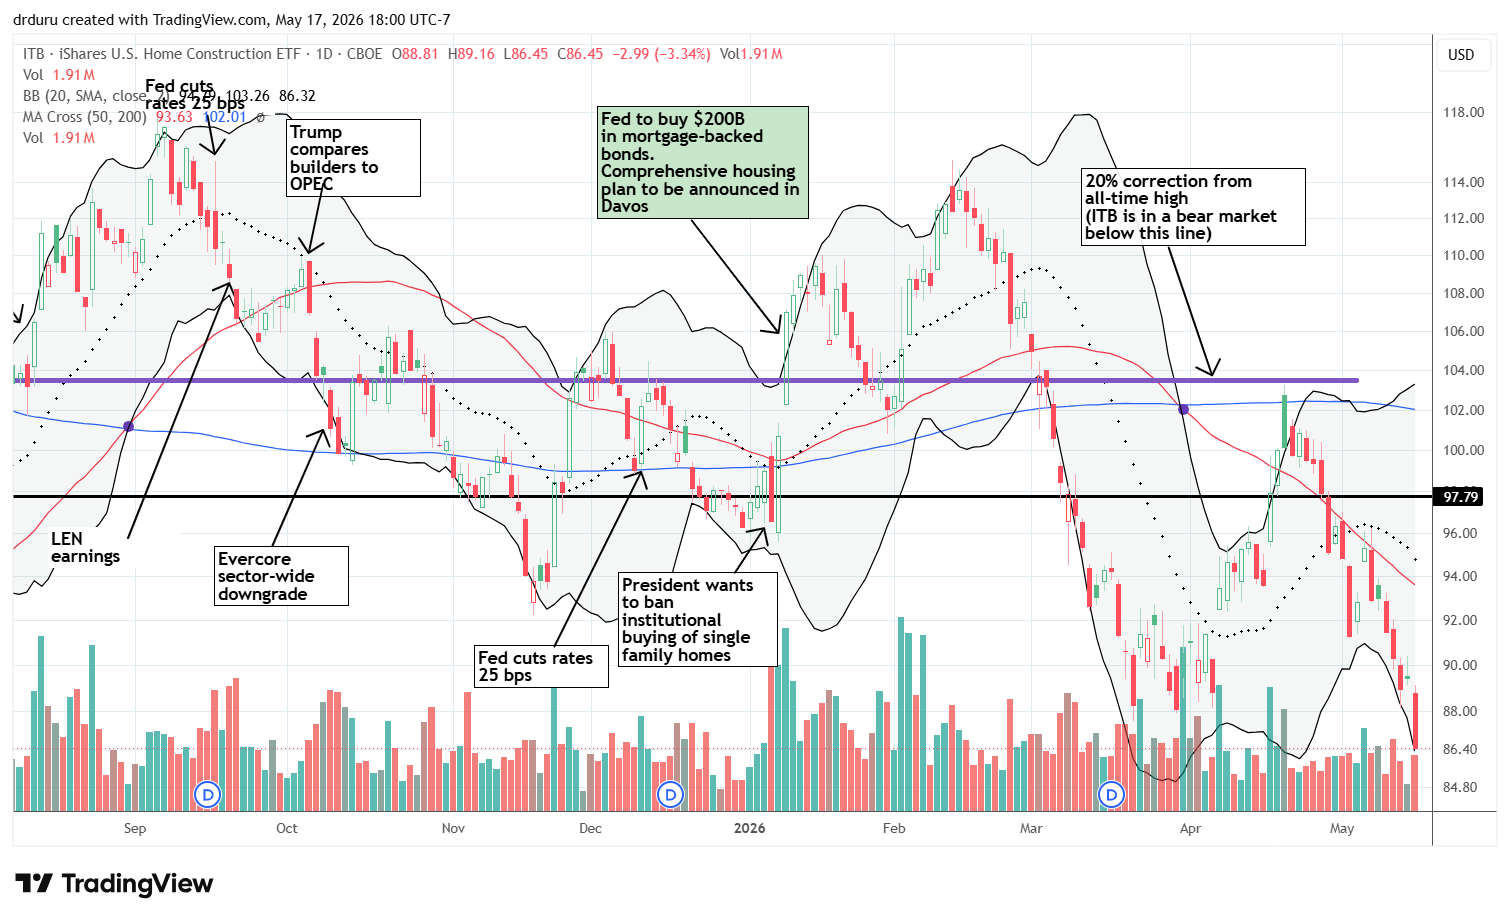
iShares U.S. Home Construction ETF (ITB)
Description: iShares U.S. Home Construction ETF tracks companies involved in home construction and related industries.
Technical status: iShares U.S. Home Construction ETF (ITB) broke below important support levels and returned to lows last seen earlier in 2025.
Trade commentary: Back to the failing consumer-facing stocks…ITB set a new low for the year and fell off the metaphoric cliff I described earlier this month. Homebuilder stocks are suffering from rising bond yields. Friday’s 3.3% loss put an exclamation point on the weakness.
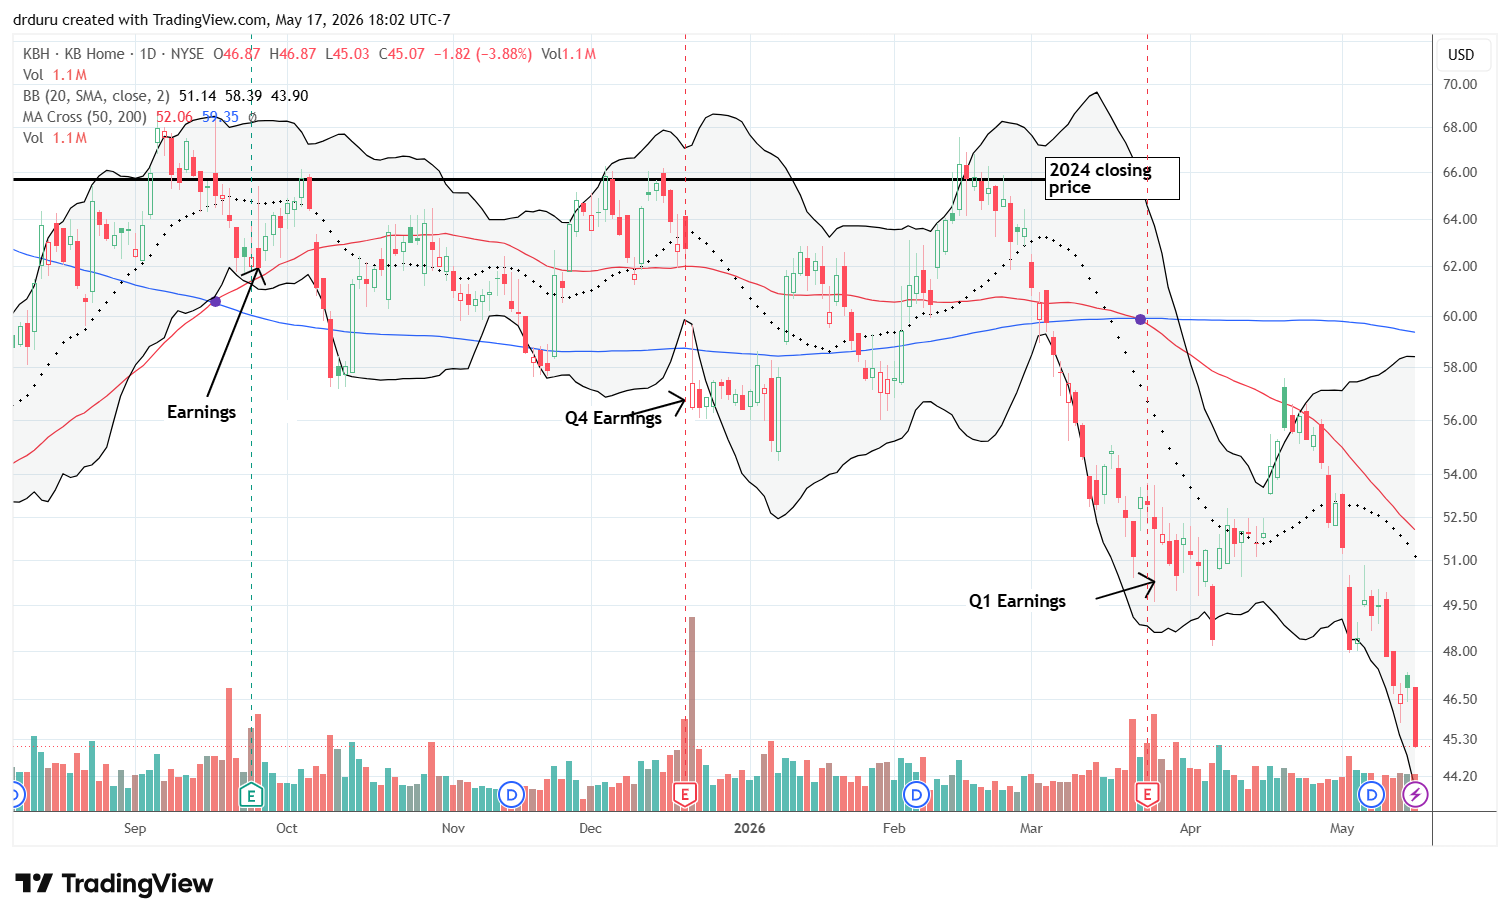
KB Home (KBH)
Description: KB Home is a homebuilding company that constructs and sells residential properties in the United States.
Technical status: KB Home (KBH) collapsed back toward lows not seen since 2023.
Trade commentary: I remained bearish on KBH despite the April rally in homebuilders. The stock has now resumed the breakdown I originally expected as mortgage rate pressures intensified. The counter rally was quite the fakeout.
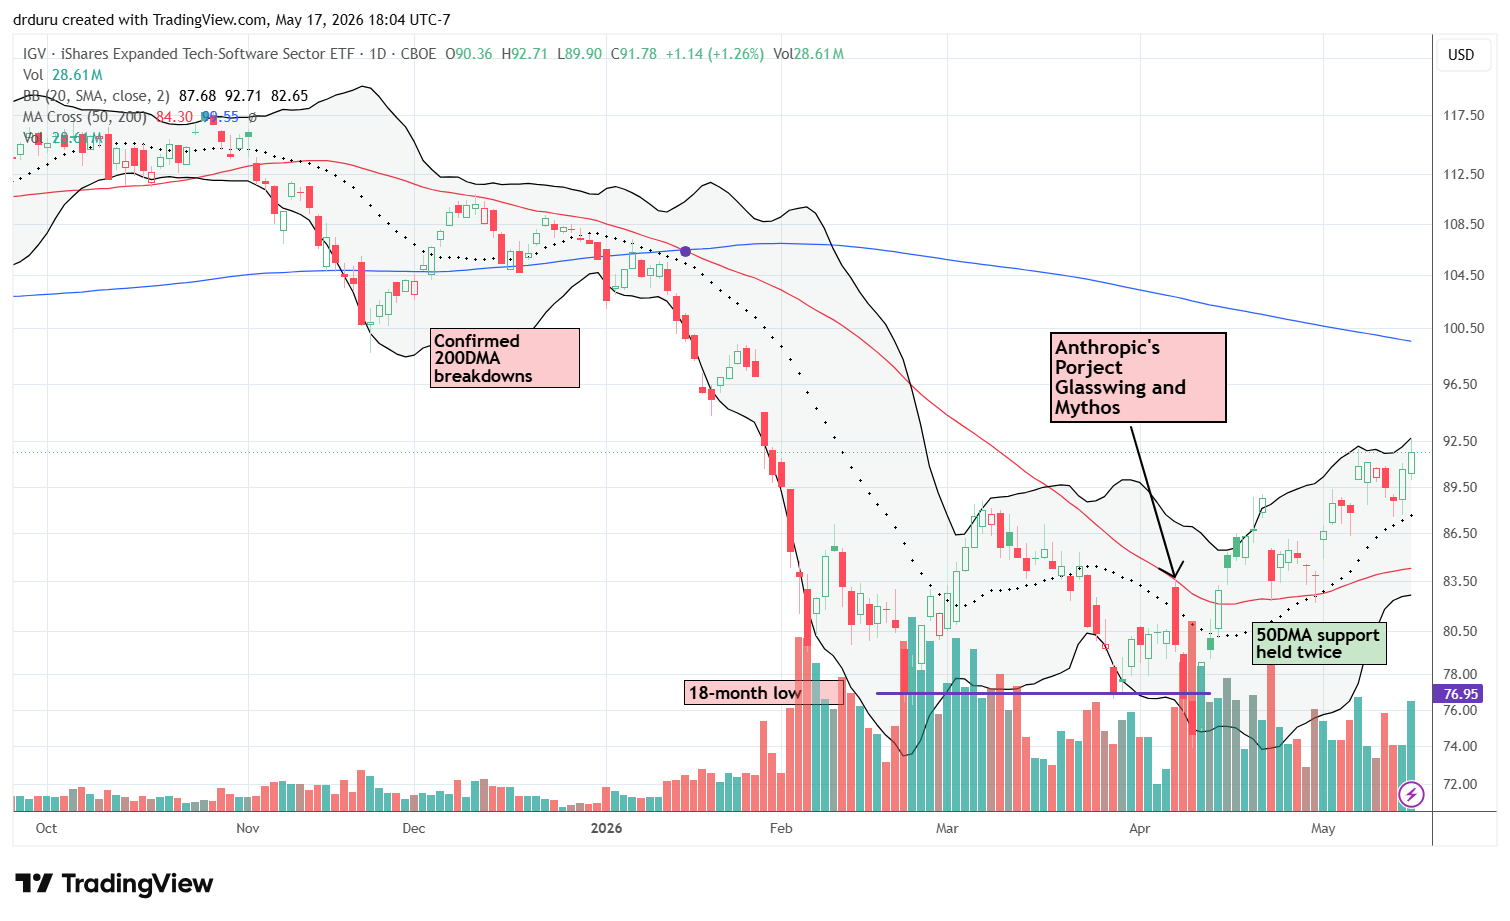
iShares Expanded Tech-Software Sector ETF (IGV)
Description: iShares Expanded Tech-Software Sector ETF tracks U.S. software and technology companies.
Technical status: The iShares Expanded Tech-Software Sector ETF (IGV) continued a bullish reversal and reached a new recovery high.
Trade commentary: Software stocks still appear to be recovering from the AI panic through early April. I was quite surprised to see how well IGV performed on Friday given the selling across the stock market. Absent the overall technical deterioration in the stock market, I interpret IGV’s steady strengthening as validation of my contrarian analysis on the AI Panic behind the SaaSpocalypse.
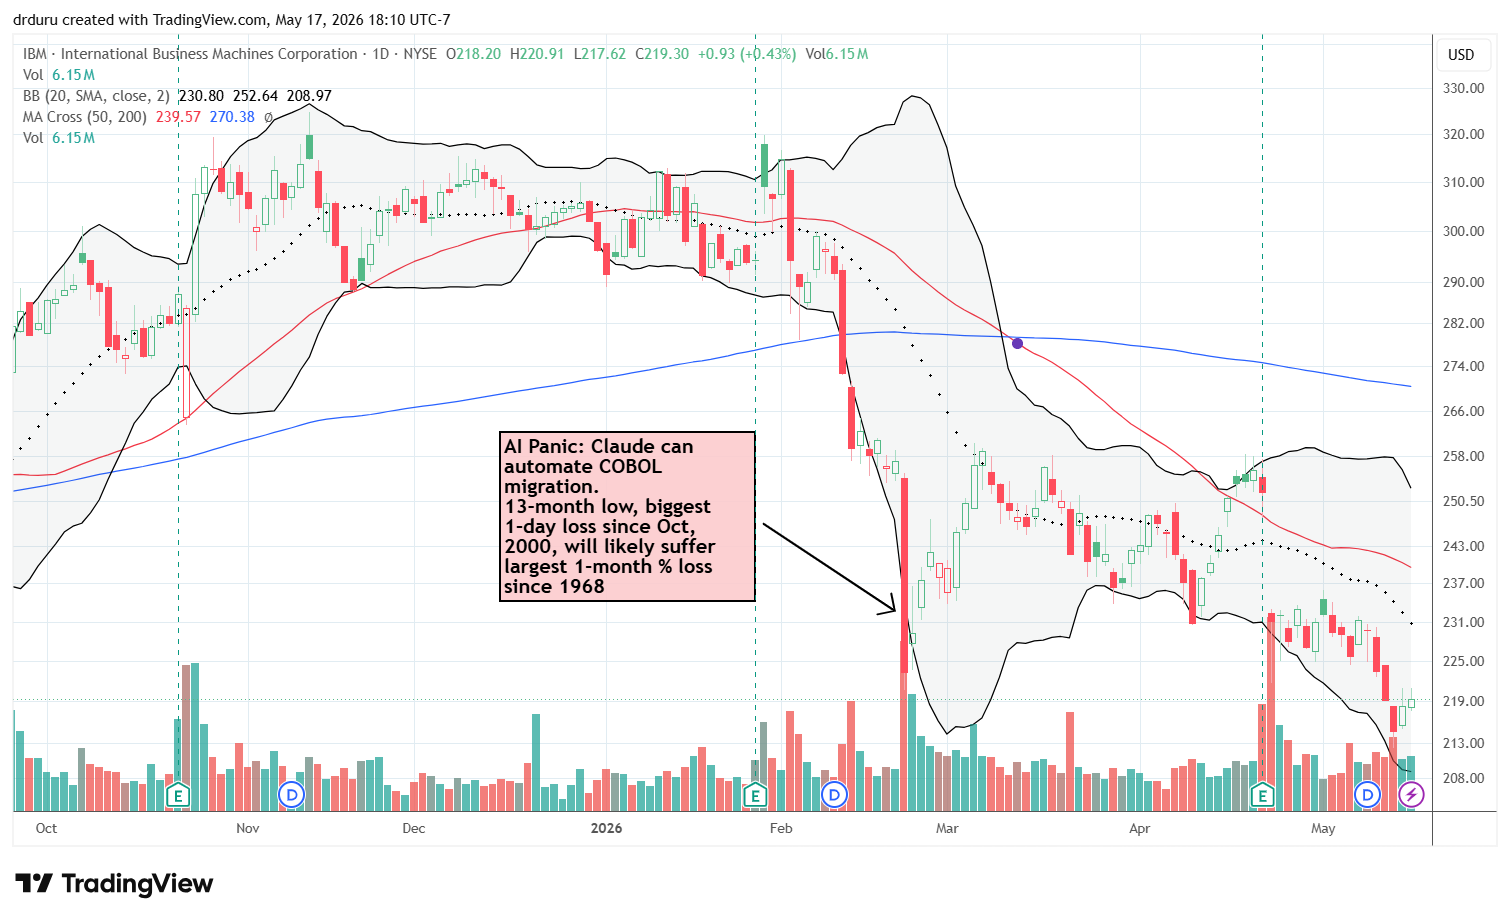
International Business Machines (IBM)
Description: International Business Machines provides enterprise software, cloud computing, consulting, and infrastructure technology services.
Technical status: International Business Machines (IBM) fell to a new yearly low and showed continued technical weakness.
Trade commentary: I am concerned that IBM weakness may become an early warning sign for the broader software rebound. I still own a small position, but I am waiting for technical conditions to improve before adding.
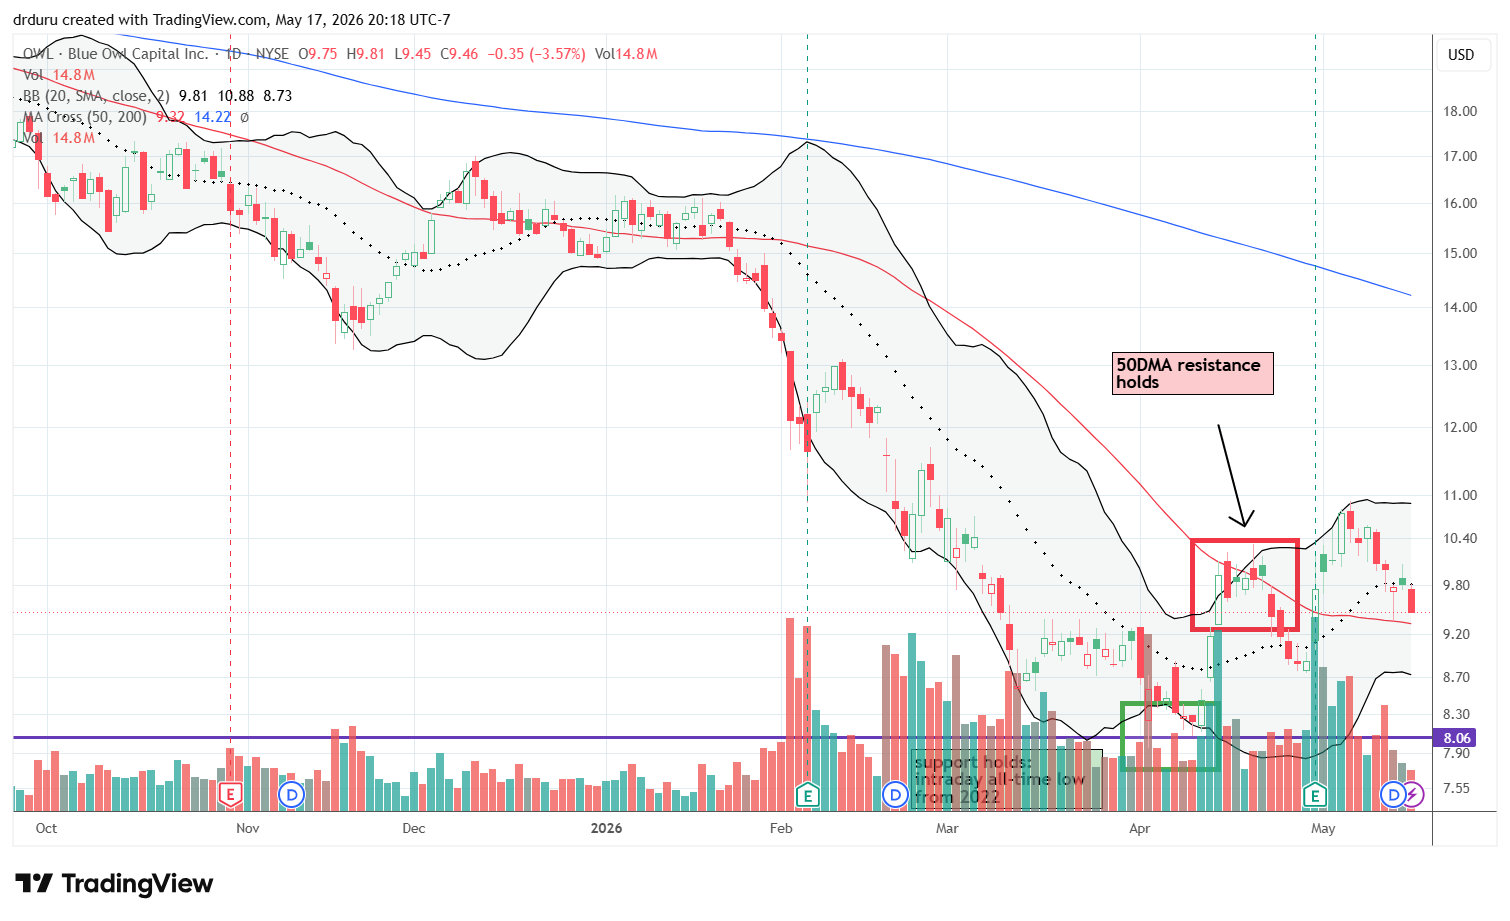
Blue Owl Capital (OWL)
Description: Blue Owl Capital is an alternative asset management firm focused on credit, real assets, and GP strategic capital solutions.
Technical status: Blue Owl Capital (OWL) remained above its 50DMA but weakened significantly after a sharp decline.
Trade commentary: Last week, OWL surprisingly diverged from IGV. For now, I remain bullish given 50DMA support is intact and a bearish to bullish reversal is still underway. A close below $8.70 would put this trade at high risk.
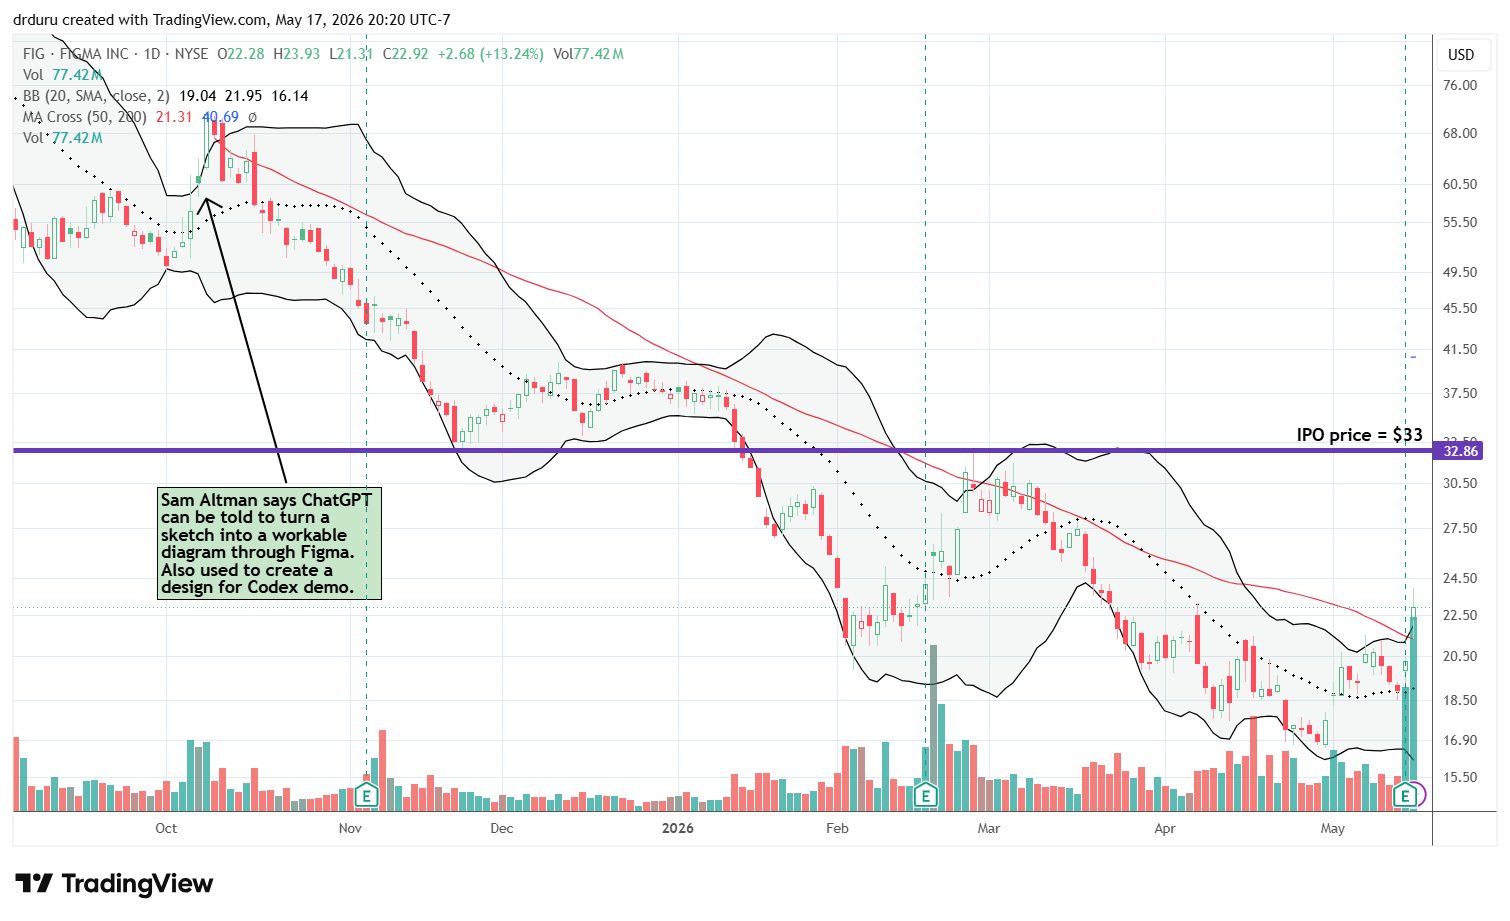
Figma (FIG)
Description: Figma develops collaborative design software and digital product development tools.
Technical status: Figma (FIG) broke out above its 50DMA with a 13.2% post-earnings gain and heavy volume surge.
Trade commentary: Could this finally be FIG’s moment? The stock printed a clean 50DMA breakout on record trading volume, a day after another extremely high volume up day. However, given FIG still just trades at its pre-earnings price before the big positive response to February earnings, I want to see follow-through with a higher close. Of course if the general stock market is topping, then FIG may stall very soon. In the meantime, I am sitting on shares and biding time; I may sell a call against the position.
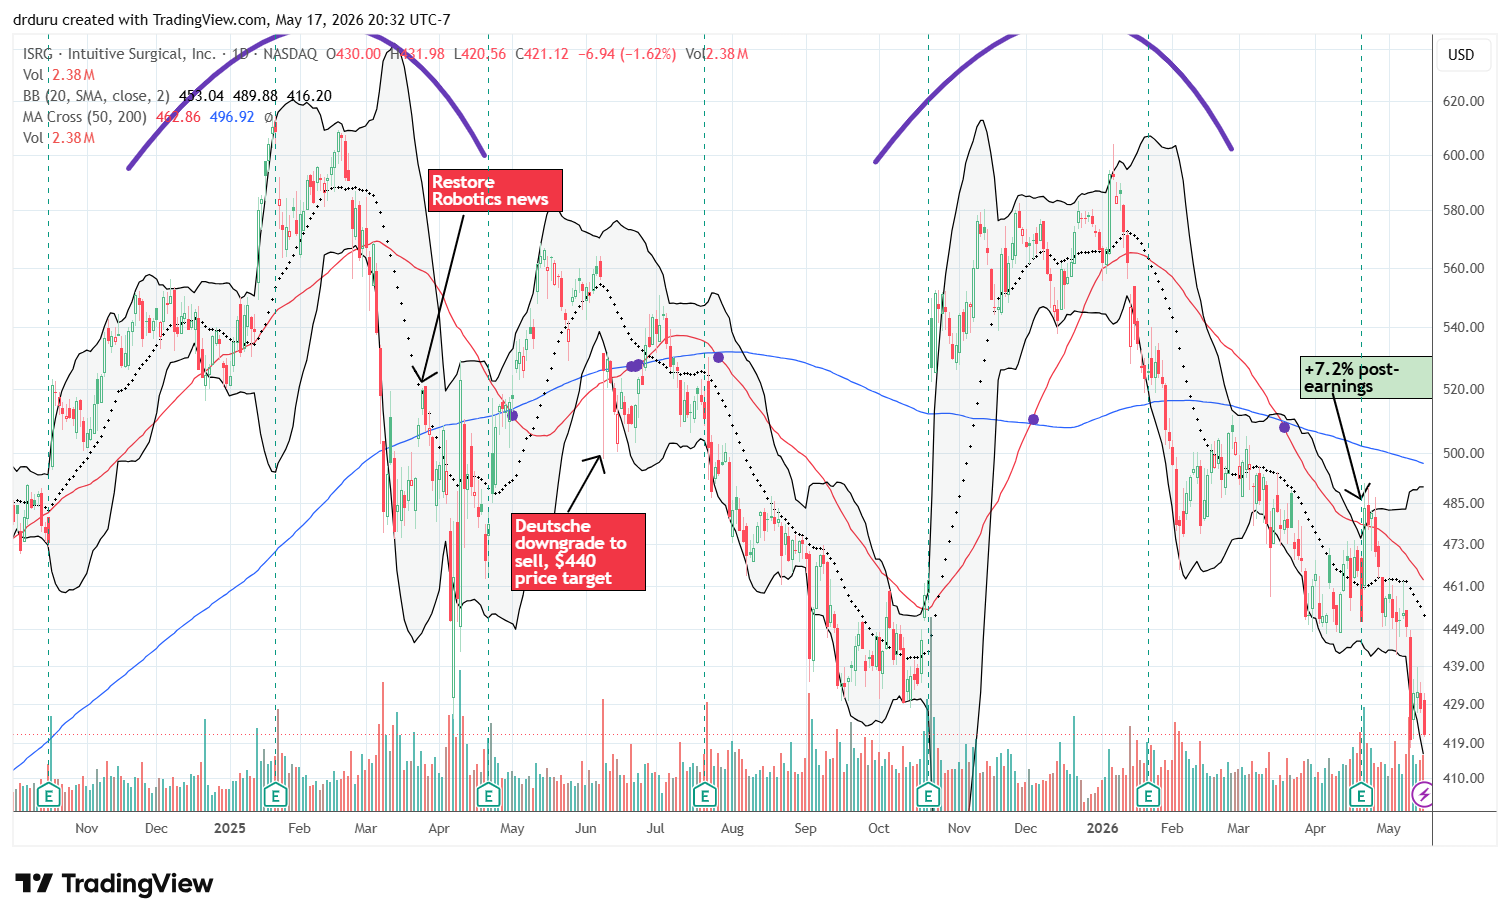
Intuitive Surgical (ISRG)
Description: Intuitive Surgical develops robotic-assisted surgical systems and related medical technologies.
Technical status: Intuitive Surgical (ISRG) confirmed a double-top pattern after continued post-earnings weakness that has taken the stock to a near 2-year low.
Trade commentary: ISRG has become a major disappointment after earnings. If the stock trades much lower, I will likely stop out again and wait for a much better risk-reward setup later.
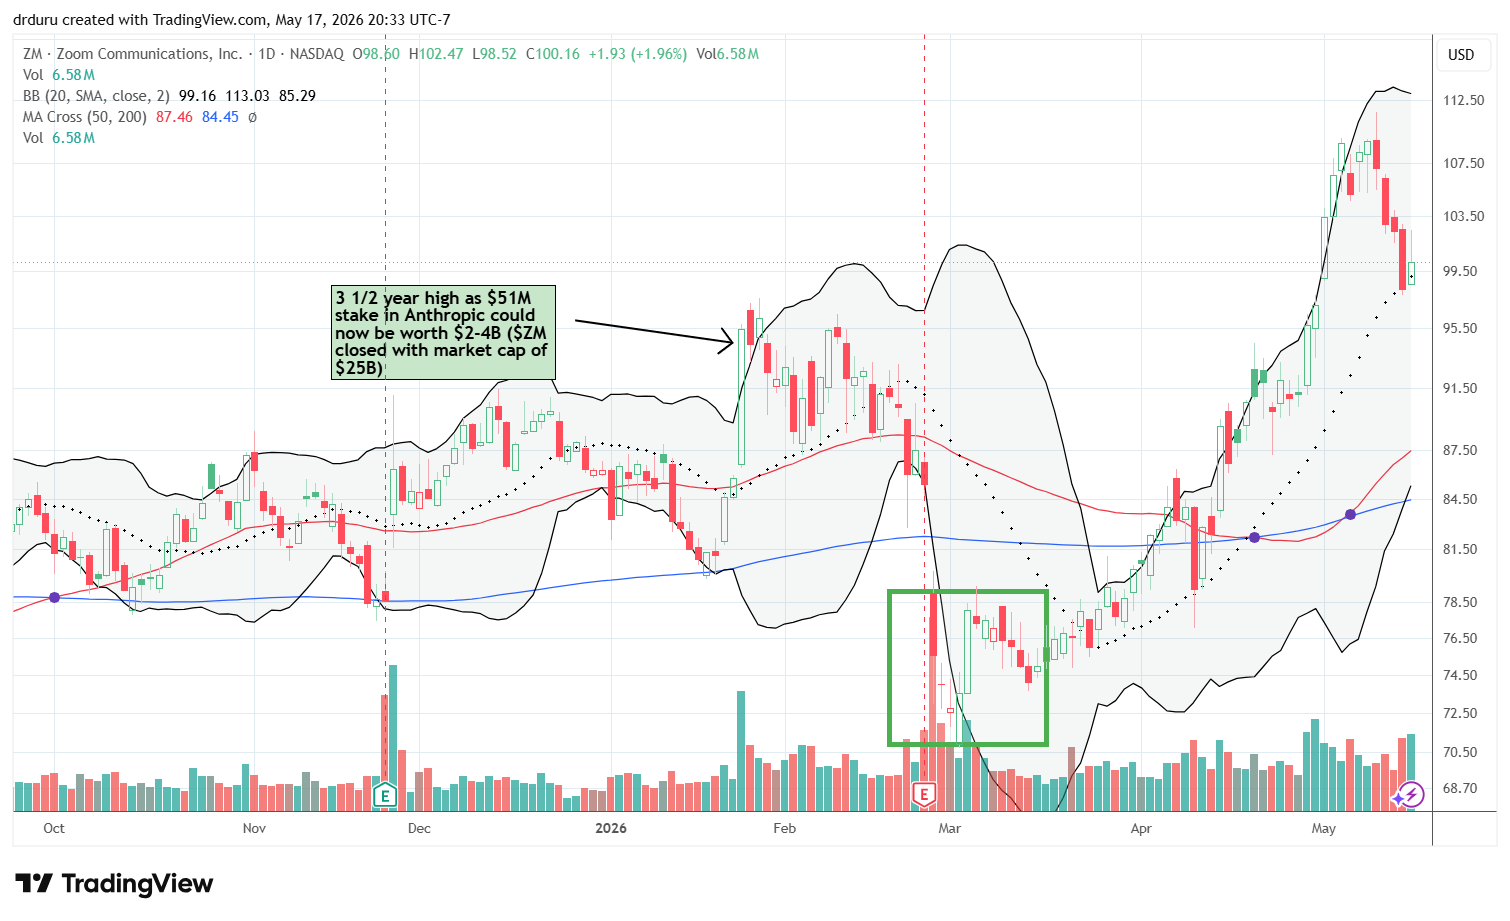
Zoom Communications (ZM)
Description: Zoom Communications provides video communications, collaboration, and cloud-based conferencing services.
Technical status: Zoom Communications (ZM) held support at its 20DMA despite recent volatility.
Trade commentary: ZM has been extremely difficult to trade because of its choppy price action. This month’s breakout to a near 4-year high took me by surprise and left me eagerly awaiting a dip. Last week delivered that dip, and I bought a 100/110 call spread expiring this Friday as a play on a quick rebound. My thinking preceded my decision to turn bearish on the stock market. I am relieved the stock bounced on Friday as expected, but the deep fade from intraday highs warns me that the move may be fleeting. If so, I will be ready to buy shares on a test of 50DMA support. The breakout to 4-year highs signals to me that there are buyers out there steadily, albeit slowly, accumulating shares for much bigger gains sometime in the future.
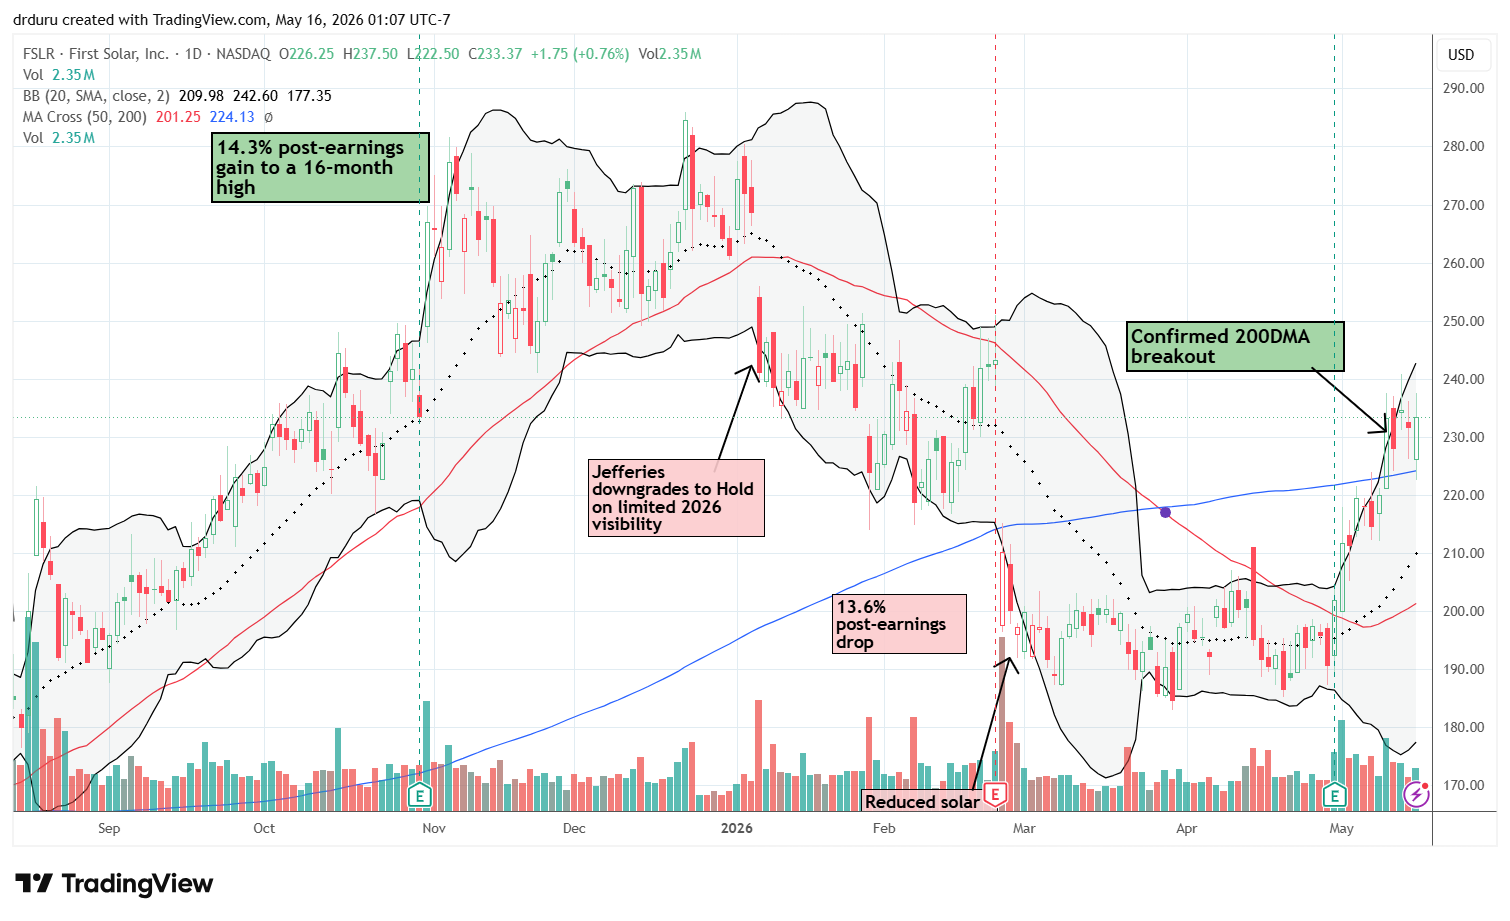
First Solar (FSLR)
Description: First Solar manufactures solar panels and utility-scale photovoltaic power systems.
Technical status: First Solar (FSLR) broke above its 200DMA and confirmed a bullish breakout.
Trade commentary: After reporting earnings earlier in the month, FSLR has suddenly returned to bullish form. The stock’s 200DMA breakout is buyable, but I am hesitant to jump back into what is now a speculative name given my bearish call on the market.
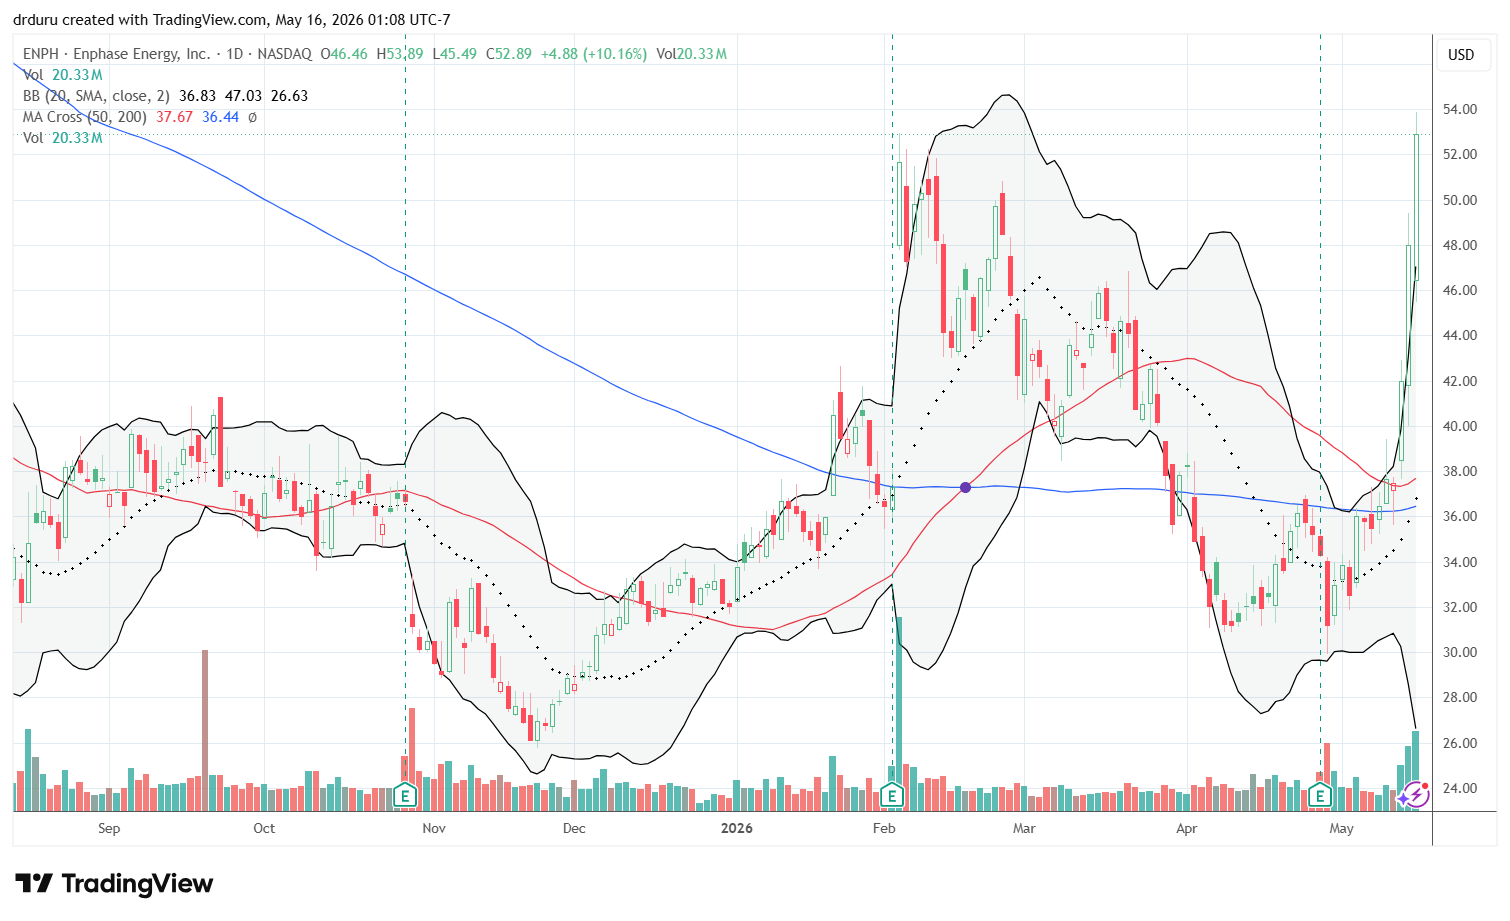
Enphase Energy, Inc (ENPH)
Description: Enphase Energy designs and manufactures solar energy systems, including microinverters, battery storage solutions, and energy management technology for residential and commercial customers.
Technical status: ENPH went parabolic last week, gaining 4 of 5 trading days and 45.1% for the week. The stock made a 52-week closing high.
Trade commentary: Seeing ENPH soar for the week nearly pushed me to buy FSLR. The company announced U.S. pre-orders for its new IQ9S-3P Commercial Microinverter, but the news hardly seemed worthy of such a parabolic surge. I am definitely not chasing the stock given my bearish call. Moreover, parabolic moves typically end poorly when they do end, so I am content to wait and watch.
Still, I am kicking myself for not having a price alert in place for a 50DMA breakout. I managed to eke out a small gain trading ENPH on a post-earnings rebound off 20DMA support. I was relieved when I bailed in March as the stock continued its sell-off. It’s surreal to realize that if I had violated my trading rules and also held through the April earnings, I might have participated in last week’s stunning move.
Footnotes
Subscribe for free to get email notifications of future posts!
“Above the 50” (AT50) uses the percentage of stocks trading above their respective 50-day moving averages (DMAs) to measure breadth in the stock market. Breadth defines the distribution of participation in a rally or sell-off. As a result, AT50 identifies extremes in market sentiment that are likely to reverse. Above the 50 is my alternative name for “MMFI” which is a symbol TradingView.com and other chart vendors use for this breadth indicator. Learn more about AT50 on my Market Breadth Resource Page. AT200, or MMTH, measures the percentage of stocks trading above their respective 200DMAs.
Active AT50 (MMFI) periods: Day #205 over 20%, Day #32 over 30%, Day #28 over 40% (overperiod), Day #1 under 50% (underperiod ending 26 days over 50%), Day #5 under 60%, Day #178 under 70% (underperiod)
Source for charts unless otherwise noted: TradingView.com
Full disclosure: long SPY put spread, long IWM shares and call spread, long SPY call spread, long QQQ put spread, long TLT, long SLV call spread, long BHP, long ITB, long OWL, long FIG, long ISRG, long ZM call spread,
FOLLOW Dr. Duru’s commentary on financial markets via StockTwits, BlueSky, and even Instagram!
*Charting notes: Stock prices are not adjusted for dividends. Candlestick charts use hollow bodies: open candles indicate a close higher than the open, filled candles indicate an open higher than the close.
* Blog notes: this blog was partially written based on the heavily edited transcript of the following video that includes a live review of the stock charts featured in this post. I used ChatGPT to process the transcript.