

Housing Market Intro and Summary
The housing market again seemed to tell a tale of divergent markets between new and existing homes. While new home sales and starts fared well, a large setback in builder sentiment sets the stage for setbacks in April’s new home sales. Existing home sales completely erased the wistful optimism from February’s surge. The market is still dealing with a convergence of headwinds, like rising interest rates, affordability pressures, uneven demand, and broader macroeconomic uncertainty, so isolated points of good data are bound to evaporate as a signal of optimism. With spring selling in full swing and builders reporting earnings results that confirm tepid market conditions, the housing market will do well just to keep clinging to a cliff of hope until fresh optimism comes around again for spring 2027.
Here is a summary for April’s housing market update:
- Housing stocks weakened as ITB failed at bear market resistance, reinforcing a “clinging to a cliff” theme.
- Builder confidence dropped sharply in April as future sales expectations and buyer traffic deteriorated.
- Single-family housing starts surged in March, but permits remained near three-year lows.
- New home sales rose in March, though falling prices and large revision risks clouded the rebound.
- Existing home sales slipped back toward 2025 lows as affordability pressures persisted.
- California home sales weakened again, remaining below the 300,000 benchmark for a 42nd straight month.
- Elevated mortgage rates continued to strain affordability despite improving inventory levels.
- Housing’s share of GDP kept declining as investment shifted toward AI, energy, and manufacturing.
Housing Stocks
The iShares US Home Construction ETF (ITB) returned to bear market territory in March but rallied off the March lows alongside the rest of the stock market. ITB sharply diverged from the S&P 500 after the ETF’s rally stopped cold at the bear market line (the purple line below). This divergence validated my early conclusion to the seasonally strong period of trading in the stocks of home builders. Now ITB looks positioned to retest its March lows as higher mortgage rates, lower consumer and builder sentiment, and economic fears in the labor market weigh on the housing market.
")
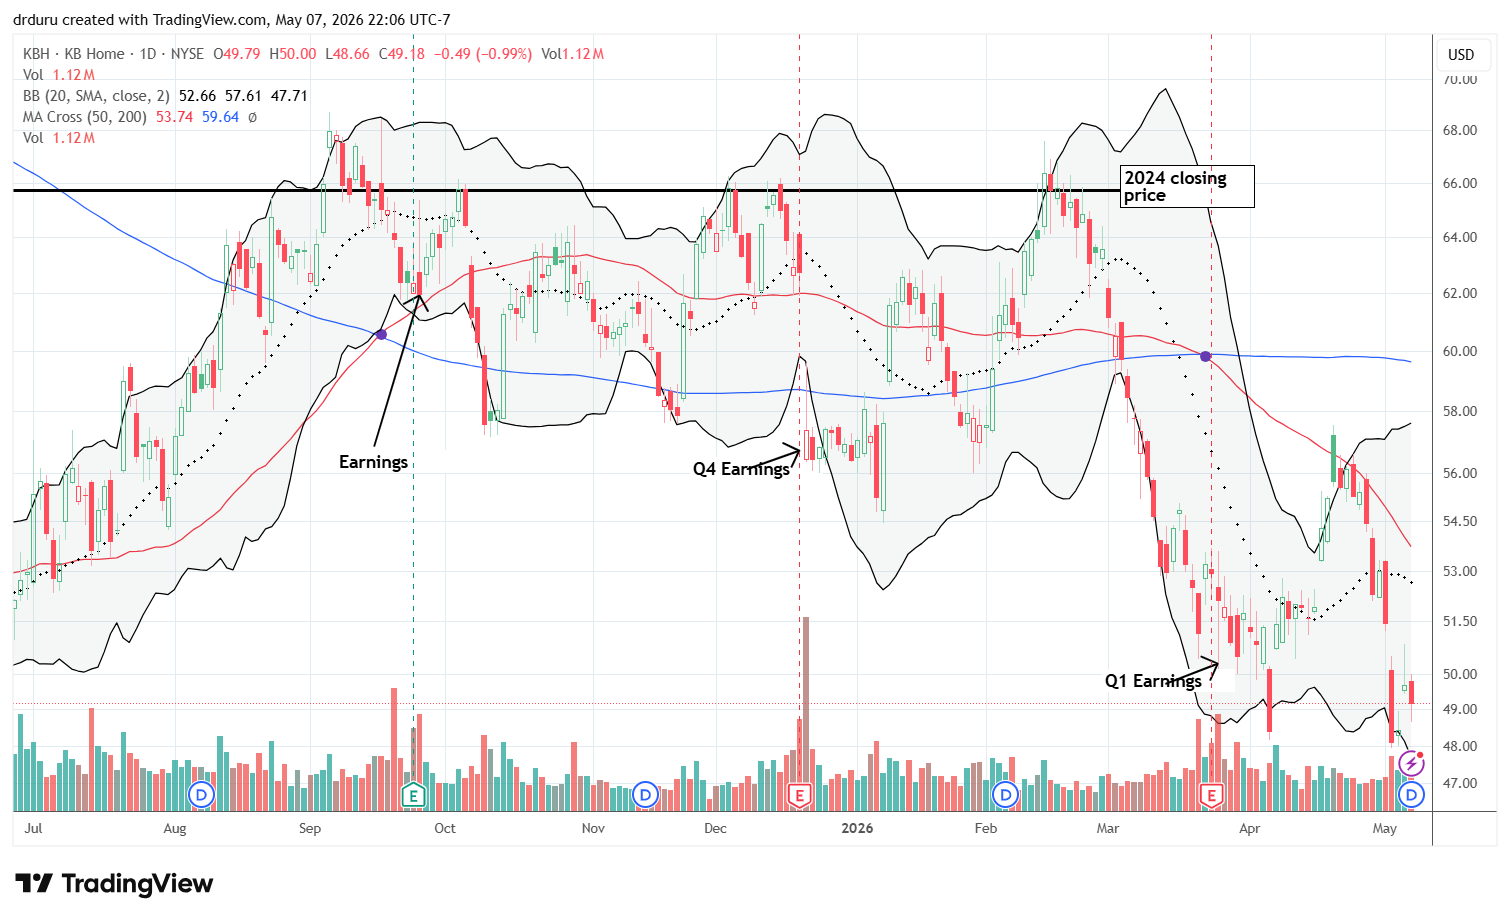
KB Homes (KBH) symbolizes the rapid swings in fortune for home builders. I described KBH’s poor results from its last earnings in “KB Home’s Disappointing Q1 Report Ends The Seasonal Trade.” The stock soon fell to a 2 1/2 – year low before rallying with the stock market. As the rally in builders exhausted itself, KBH stopped cold at resistance from its 50-day moving average (DMA) (the red line below) and from there rapidly broke down below the March low. Needless to say, with the stock for KB Homes clinging to a cliff in price, I am just as negative on the stock as I was in March.
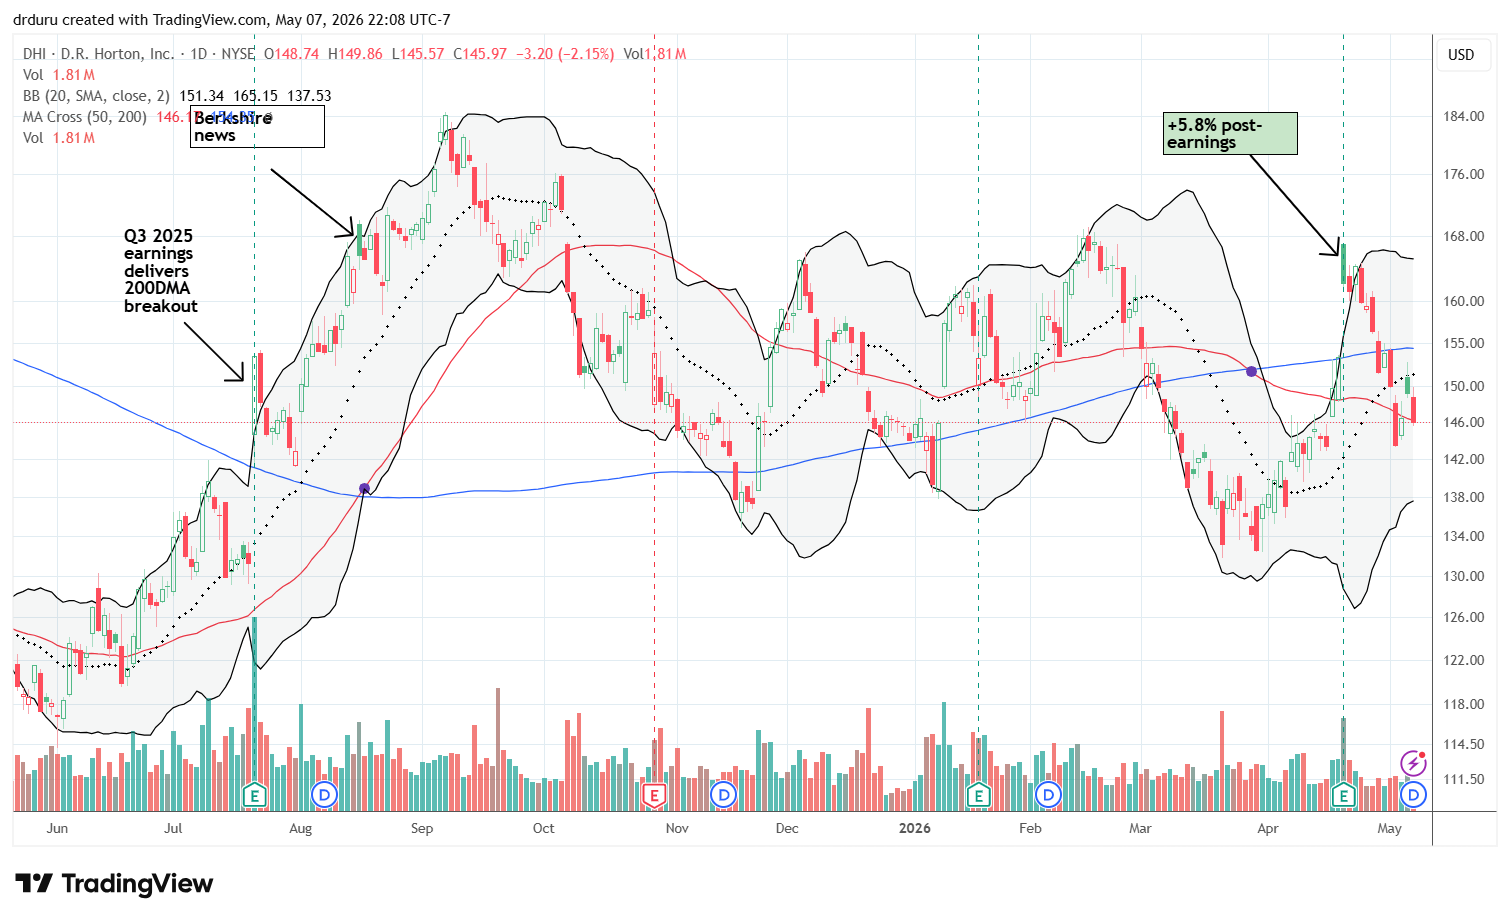
D.R. Horton (DHI) was the rare builder that received an initial positive response to earnings. However, the stock likely benefited from the tailwinds from the rally at the time. DHI’s fade from its post-earnings, intraday high marked the high for ITB and most every other builder. DHI quickly lost its post-earnings gains and continues to trade in the middle of a 2 1/2 – year trading range.
The setbacks in the stocks of home builders aligns well with the sobering news across the housing sector.
Housing Data
Home Builder Confidence: The Housing Market Index – April, 2026
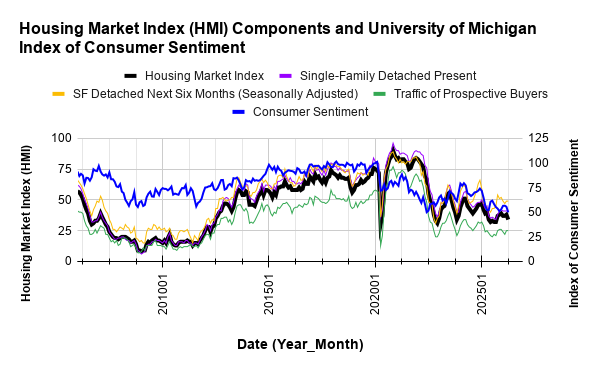
The National Association of Home Builders (NAHB)/Wells Fargo Housing Market Index (HMI) plunged 4 points from 38 in March to 34 in April. Builder sentiment declined under the weight of economic uncertainty and higher interest rates added to the familiar impacts of higher input costs.
Each of the HMI components decreased in April. After revisions, the “Single-Family: Present” component fell for the first time in 2026. The “Single-Family: Next Six Months”, a measure of expectations for future sales, suffered the worst fall going from 49 to 42, a level last seen in May, 2025. The “Traffic of Prospective Buyers” fell back to its low of the year of 22. Thus across the board builders downgraded their perspective and outlooks on the market.
/Wells Fargo Housing Market Index (HMI) and the University of Michigan Index of Consumer Sentiment")
Source for data: NAHB and the University of Michigan
Builders are now back in alignment with deteriorating consumer sentiment.
Broadening pressures on builders coincided with a slight pullback on pricing incentives. Thus, I expect new home sales to come back down from March’s jump. The share of builders cutting prices decreased from 37% in March to 36% in April. The average price reduction dropped to 5% from 6%. The use of sales incentives was 60% in April, down from 64% in March, but still extending the streak at or above 60% to 13 straight months.
Each region fell to lows of the year. The incremental hope for the spring selling season in the South and Midwest gave way to the various fallouts from the U.S. and Israel’s war against Iran. The Northeast region fell from 42 to 41 for a level last seen in December. The Midwest jumped in March only to plunge in April to a 13-month low at 38. While the South fell to a 9-month low, sentiment in the region has been relatively stable with a tight range from 34 to 36. The West also fell to a 9-month low, but at 26 it is well below the previous low of the year at 30. If not for the South’s relative stability, overall HMI would be a lot worse.
New Residential Construction (Single-Family Housing Starts) – March, 2026
{The Census Bureau has finally caught up on its data and analyses after being impacted by last year’s historic government shutdown.}
Single-family housing starts surprisingly surged in March. March’s 1,032K in single-family starts represents a 9.7% month-over-month increase and an 8.9% year-over-year increase. I am not just surprised by the surge, but also the breakout above the 1M mark given the sluggish spring selling season.
![US. Bureau of the Census, Privately Owned Housing Starts: 1-Unit Structures [HOUST1F], first retrieved from FRED, Federal Reserve Bank of St. Louis, May 6, 2026](https://drduru.com/onetwentytwo/wp-content/uploads/2026/05/20260506_Housing-Starts-Mar-2026.png "Housing starts")
While builders have increased the pace of starts, permits are still around 3-year lows. Building permits (new privately-owned housing units authorized in permit-issuing places) have stalled out since June, 2025. Single-family authorizations were 895K, a 3.8% month-over-month decrease from February and a 7.1% year-over-year decline. The sluggish activity in permits suggests the current rebound in starts will slow and plateau soon.
Starts increased across the board with the West leading the way. Month-over-month the changes were +11.1%, +1.3%, +8.5%, and +18.1% for the Northeast, Midwest, South, and West respectively. Year-over-year the changes were +6.1%, +17.8%, +6.0%, and +11.2% for the Northeast, Midwest, South, and West respectively.
New Residential Sales (Single-Family) – March, 2026
{The Census Bureau has finally caught up on its data and analyses after being impacted by last year’s historic government shutdown.}
New home sales increased in March as part of a rebound from January’s 3 1/2 year low. Sales rose 7.4% from February’s sales figure of 635K to 682K in March. Year-over-year sales increased 3.3%. The margin of error on the sequential change is a particularly large ±15.5% and less than February’s ±21.1%. In other words, the gains could easily go to zero or even reverse in future revisions.
The NAHB attributed the increase in sales to greater inventory availability at the lower end of the market.
![US. Bureau of the Census, New One Family Houses Sold: United States [HSN1F], first retrieved from FRED, Federal Reserve Bank of St. Louis, May 6, 2026](https://drduru.com/onetwentytwo/wp-content/uploads/2026/05/20260506_New-home-sales-March-2026.png "new home sales")
For March, the median price for new homes declined 5.3% sequentially and declined 6.2% year-over-year to $387,400, a near 5-year low. The ongoing downtrend in prices accelerated in March.
March’s price swung with a notable shift in sales mix to the lower price tiers. While sales of homes priced over $1M increased sequentially from 6% to 7% of sales, the two lowest tiers increased from 46% to 54% of sales. All other tiers declined. Nearly the same shift occurred year-over-year.
February’s inventory was 9.1 months of sales. March’s inventory declined to 8.5 months of sales compared to 9.2 months a year ago. Absolute inventory declined slightly sequentially from 483K to 481K.
The Northeast, Midwest, South, and the West changed +3.8%, +11.8%, +8.1%, -12.7% respectively year-over-year. Sequentially, the Northeast, Midwest, South, and the West changed +80.0%, -5.0%, +11.1%, -3.5% respectively. The wide swings and variety in price changes align with the high degree of uncertainty in the aggregate estimate.
Existing Home Sales – March, 2026
Existing home sales decreased in March. The National Association of Realtors (NAR) reported a 3.6% month-over-month decrease to a seasonally adjusted annual rate of 3.98M, alongside a 1.0% year-over-year decline. Condo sales fell to a new all-time low for data going back to 2010.

(For historical data from 1999 to 2014, click here. For historical data from 2014 to 2018, click here) Source for chart: National Association of Realtors, Existing Home Sales© [EXHOSLUSM495S], retrieved from FRED, Federal Reserve Bank of St. Louis, April 17, 2026

Total housing inventory in March was 1.36M units, up 3.0% from February and up 2.3% from March 2025. The NAR reported a 4.1-month supply of unsold inventory, up from 3.8 months last month and up from 4.0 months one year ago. Remarkably, increases in inventory continue to be unreliable catalysts for sales as the NAR has long hoped. Despite the recent gains in inventory, the NAR focused on scarcity in the market, noting that the inventory-to-sales-ratio is below “historical norms.” These same constraints continue to support higher prices.
The median sales price of an existing home was $408,800 in March, up 1.4% from one year ago ($403,100). March marked the 33rd consecutive month of year-over-year price increases. The median sales price troughed in January, 2026 at $395,000. The NAR noted the upside to the price gains in the form of another $128,100 in housing wealth in the last 6 months for the “typical” homeowner. The NAR’s Housing Affordability Index fell slightly to 113.7 in March, down from 117.5 in February and up from 104.2 one year ago.
The REALTORS® Confidence Index showed a median time on market of 41 days in March, down from 47 days in February and up from 36 days in March 2025.
The NAR also reported that first-time homebuyers represented 32% of sales (down from 34% in February and unchanged from one year ago). Separately, the NAR reported that first-time homebuyer’s share of the entire housing market dropped to an all-time low. First-timers now represent just 21% of sales, down from 24% just a year ago. Baby Boomers are the biggest buyers and sellers at 42% and 55% respectively.
Month-over-month sales fell in all four regions. The regional year-over-year changes were: Northeast -12.2%, Midwest -3.2%, South +2.2%, West +1.3%.
Single-family existing home sales decreased 3.5% month-over-month in March to a seasonally adjusted annual rate of 3.63M and declined 0.3% year-over-year. The median price of a single-family home was $412,400, an increase of 1.3% from last year.
California Existing Single-Family Home Sales – March, 2026

After increasing in February, California existing home sales declined in March. The California Association of Realtors (C.A.R.) reported that existing single-family home sales declined 3.5% in March to 265,320, down 2.5% year-over-year. The C.A.R. pointed to the war against Iran and economic fears to explain these sales declines. The organization even suggested that buyers canceled contracts at the last minute because of these headwinds.
The median price increased 7.1% month-over-month and up 0.4% year-over-year to $889,190. This price increase comes on the tail of an ongoing downtrend. The statewide median price per square foot was $428, down from $431 a year ago. The sales-price-to-list-price ratio was 100% in March, unchanged from a year ago.
March’s unsold inventory index (UII), which measures the number of months needed to sell the supply of homes on the market at the current sales rate, declined 17.5% from February and was down 5.7% from March 2025. Total active listings rose from February 2026 but fell year-over-year for a second straight month. The C.A.R. blamed the decline in inventory on the “lock-in effect”, where existing homeowners with low mortgage rates are reluctant to move and incur higher mortgage rates for a replacement residence. However, this lock-in has been a salient feature of the housing market for around four years. Thus, it is possible there is some other as yet unexplained market force pushing inventory down again.
The median time on market increased from 22 days a year ago to 23 days.
March was a softer month of sales in California after February’s increase. The California market for existing home sales remains firmly trapped below the 300,000 benchmark for 42 consecutive months and running.
Georgia’s Housing Market – March, 2026
The following infographic was created from Notebook LLM based on the March Georgia housing data posted by the Georgia Association of Realtors. (Note that the GAR does not clarify whether the reported percentage changes are month-over-month, year-over-year, or a mix).
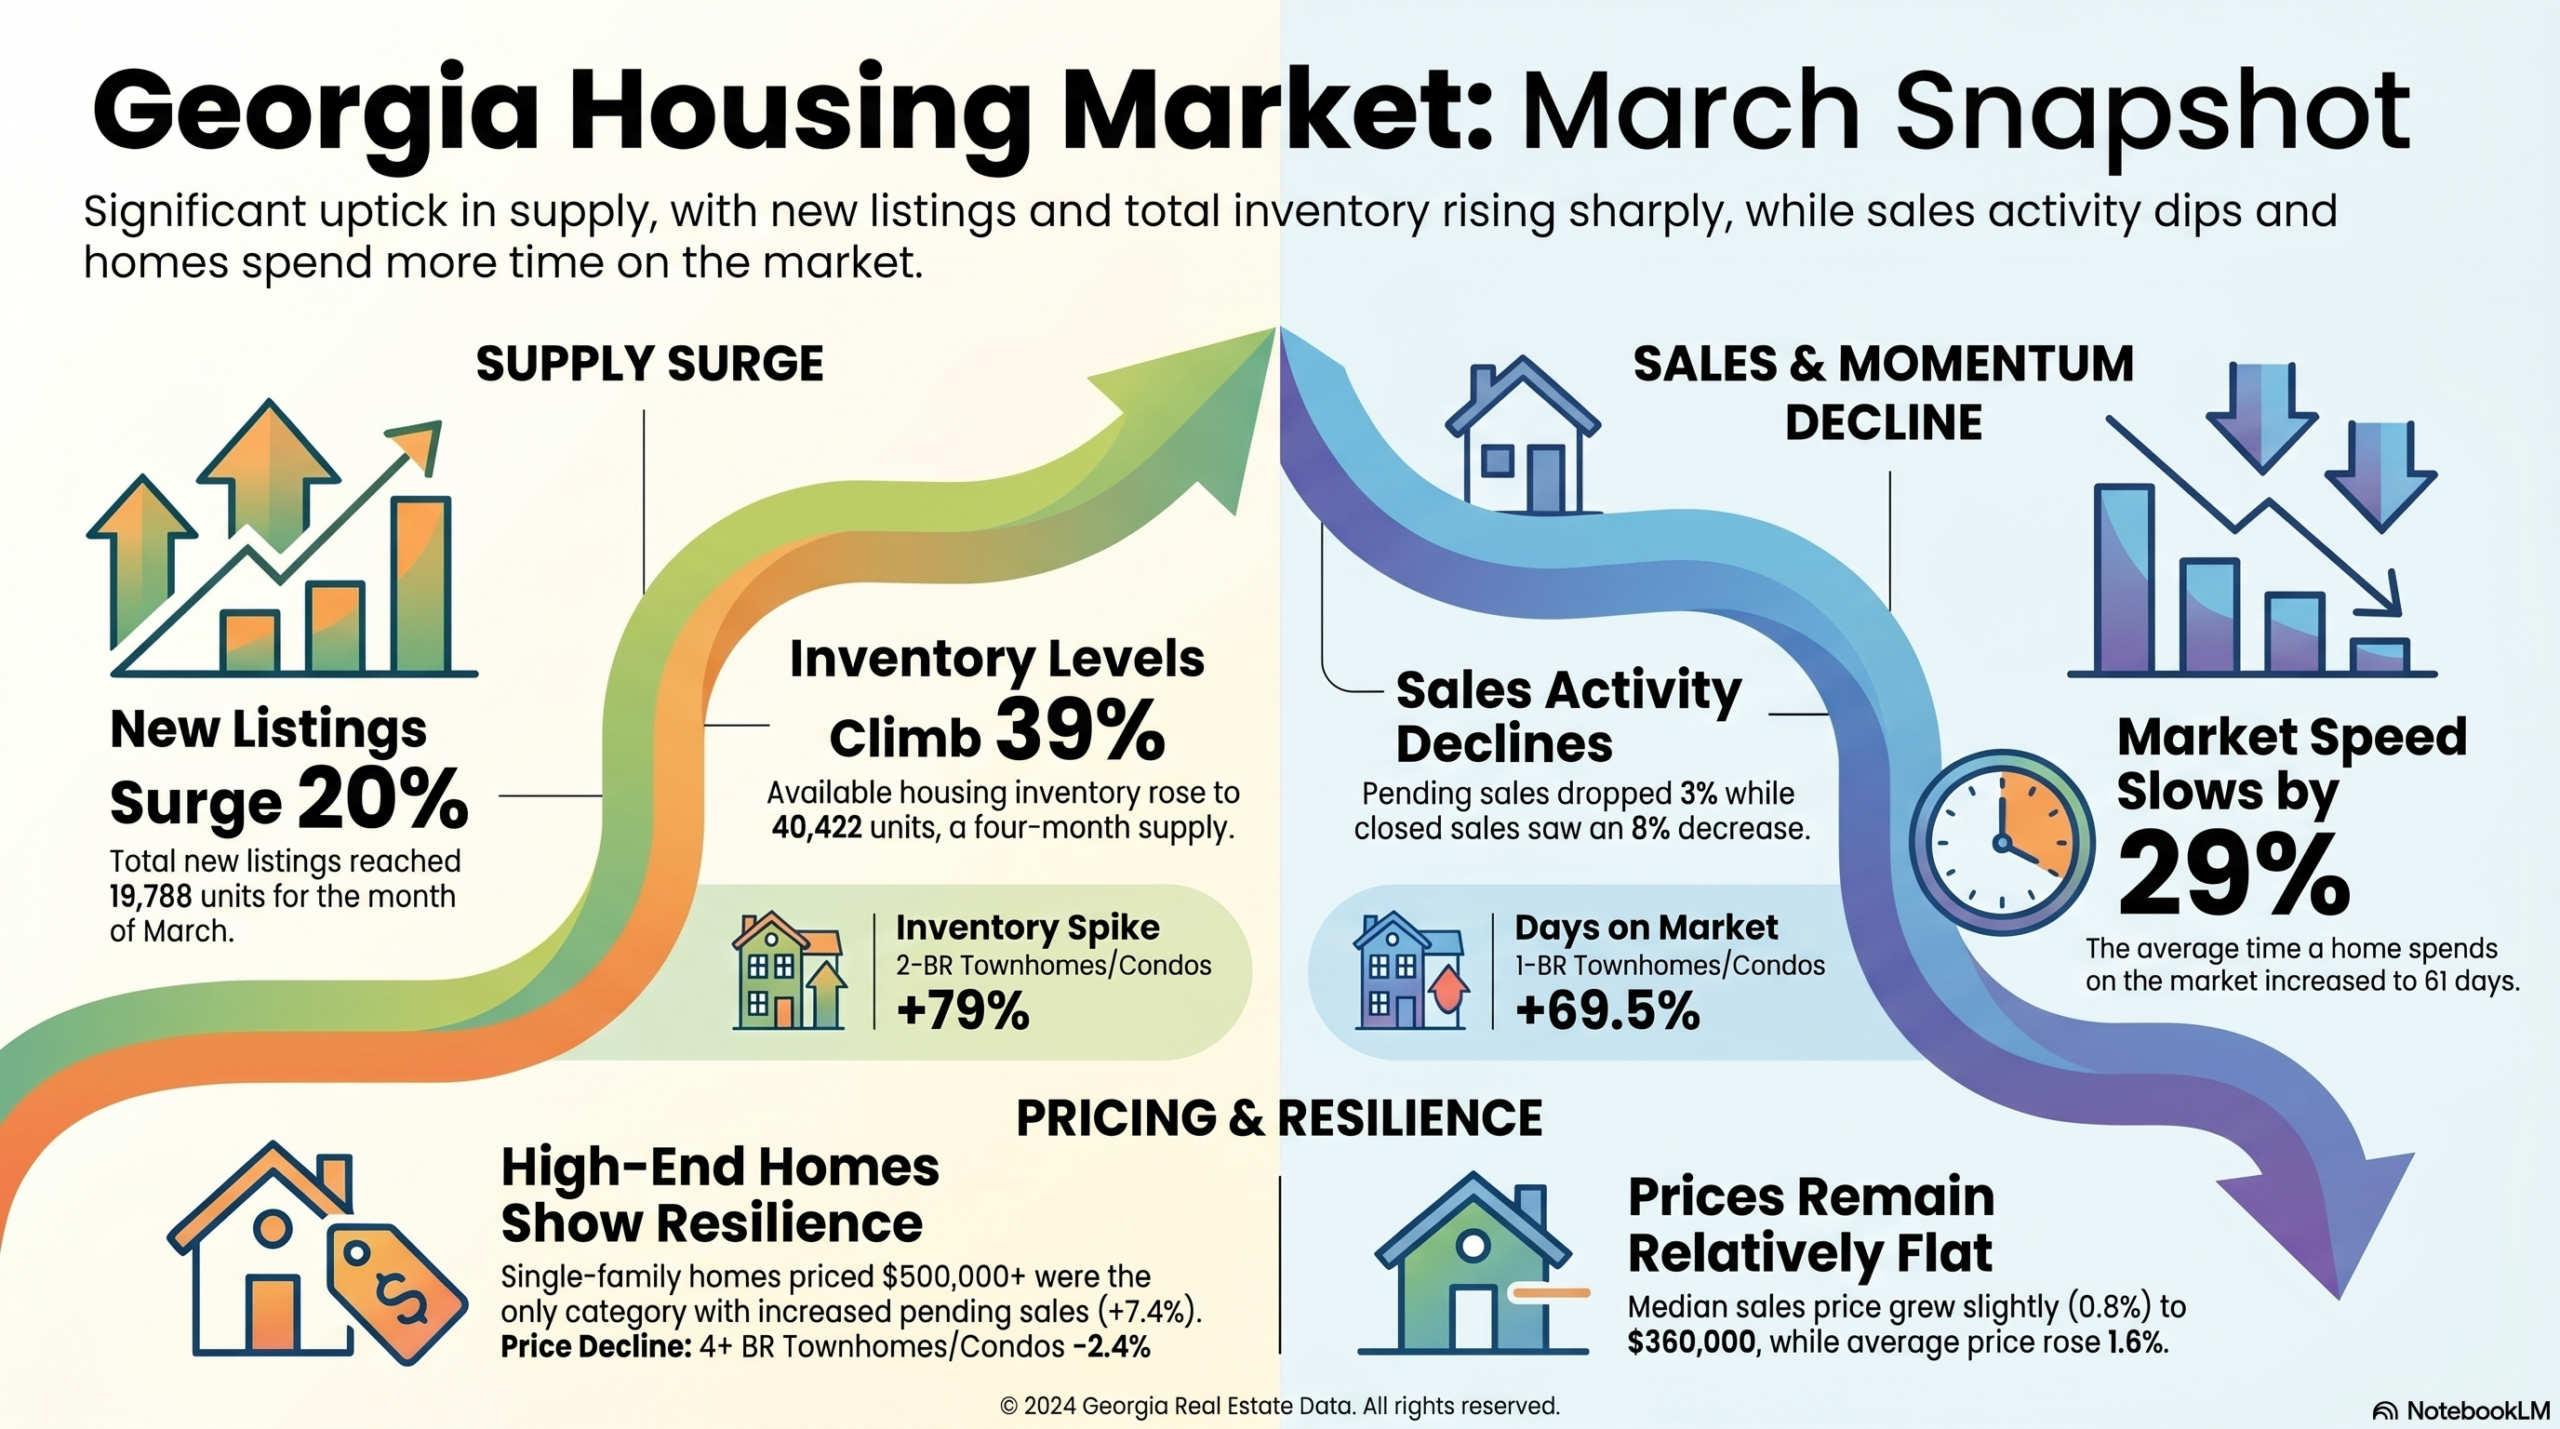
The Association noted once again that housing inventory remained tight despite an ongoing increase. Sales momentum flattened out in March.
Home closing thoughts
Beyond the monthly data, several housing-related developments continue to shape affordability, supply, and market structure. Below are some of the more notable stories that caught my interest over the last month or so.
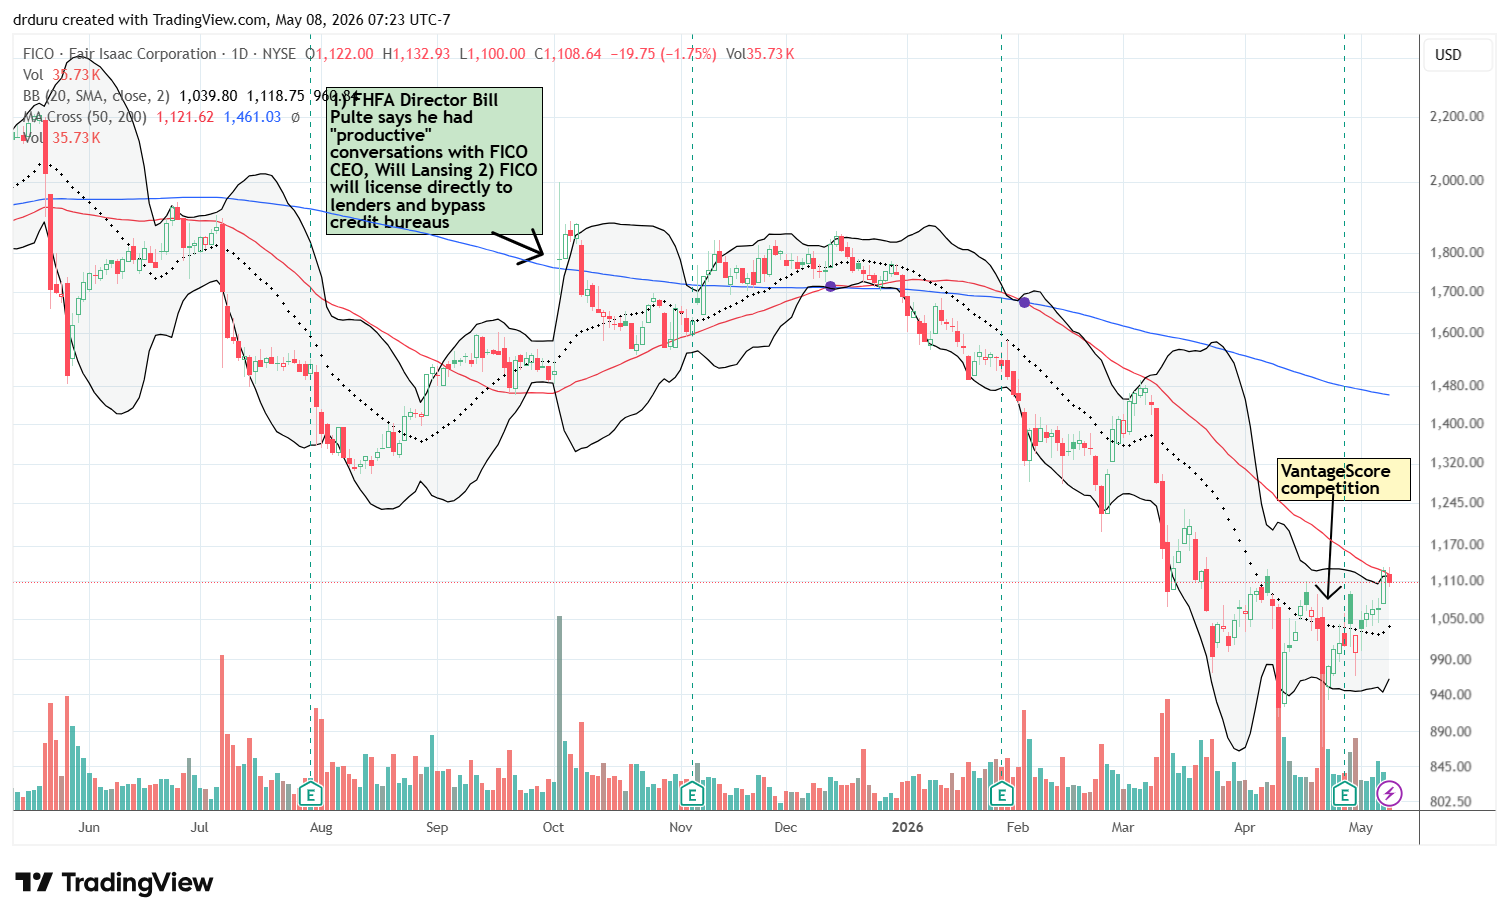
Make Room, FICO?
A big change in credit scores has unfolded for almost a year as Federal Housing Finance Agency (FHFA) Director William J. Pulte put a spotlight on Fair Isaac Corporation (FICO) for the high fees it charges for access to credit scores (FICO). On April 22, 2026, Pulte and the head of the Department of Housing and Urban Development (HUD) Scott Turner officially announced new competition for FICO.
“…the Federal Housing Administration and Fannie Mae and Freddie Mac are implementing their first new credit score models for mortgages in decades…the Federal Housing Administration will permit the use of VantageScore 4.0 and FICO 10T as eligible credit scoring models for FHA-insured mortgage underwriting.”
This competition will likely expand mortgage options for borrowers and reduce the costs of some loans.
FICO fell 6.4% on the news but has recovered since. The stock is struggling to break free of a downtrend defined by its 50DMA. FICO is down 54% from its all-time high and at one point last month traded at a 2 1/2 year low.
Denver Prices Falling
The median price of a home in the Denver metro area fell 2.2% year-over-year. The decline is small, but it still makes Denver the metro area with the largest price reduction. Denver prices have essentially flatlined in the last 5 years after 10 years of near relentless increases. Thus, being the metro area with the largest drop in home values is just a blip on the screen.
A representative of the Colorado Association of Realtors listed out the current affordability struggles for buyers: prices, HOA dues, insurance, and increased taxes.
Inventory Rebound
The NAHB tracks total housing market inventory, new plus existing single-family homes. The latest data shows a sharp rebound inventory in recent months but still a total well below the peak from 2025. It was that peak which caused some concern of looming over-supply. Now, inventory looks set up to bounce around within a range.

Housing Market’s Shrinking Share of GDP
The NAHB reported a decline in housing’s share of GDP to levels last seen in 2019. After a brief surge in the early months of the pandemic, housing’s share of GDP has steadily declined. The graph below shows the timeseries back to 1980. The entire history shows that the current share of GDP is around the average (or pivot line) over the last 46 years. So the current drop is a revision to the mean. This decline also makes sense in the context of an economy that is gearing up for infrastructure buildouts for AI, energy, and manufacturing.

Spotlight on Mortgage Rates…And Affordability
The Mortgage Bankers Association (MBA) reported three weeks with a decrease in mortgage applications and two weekly increases for the month of April. For all of March, new home purchase mortgage applications increased 11% year-over-year and surged 26% sequentially (not seasonally adjusted). Mortgage rates rose in March and remained elevated in April. So I am surprised new home sales rose. However, it is very possible that new home sales only rose at the expense of existing home sales which plunged in March.
![Freddie Mac, 30-Year Fixed Rate Mortgage Average in the United States [MORTGAGE30US], retrieved from FRED, Federal Reserve Bank of St. Louis; May 7, 2026.](https://drduru.com/onetwentytwo/wp-content/uploads/2026/05/20260507_30-Year-Fixed-Rate-Mortgage-Average-in-the-United-States.png)
Be careful out there!
Full disclosure: long ITB