
Stock Market Commentary
The Federal Reserve seemed to change the rules of the game. To-date, easy money policies and stubborn dovishness in the face of rising inflation was a formula for higher asset prices, reflation and inflation-friendly trades, and even rising fears of an over-heating economy. Last week, Federal Reserve Chair Jay Powell shifted the narrative just enough from an oblivious Fed to a Fed that is on the case of inflation. St. Louis Fed president and CEO James Bullard sealed the deal with his hawkish commentary to end the week (see “Powell Served Up the Ball On Inflation, Bullard Delivered the Slam Dunk“). The end result was a rare stumble for the stock market as multiple major indices broke 50DMA support. More importantly, market breadth plunged right back to its lowest levels of the year. The sharp and sudden shift looks over-done, but I think it signals that oversold conditions loom…whether this week or in coming weeks.
The Stock Market Indices
The S&P 500 (SPY) ended the week with a 50DMA breakdown and a 1.3% loss. The index has now closed below its 50-day moving average (DMA) (red line below) a grand total of 18 times since its April emergence from the depths of last year’s stock market collapse. For 2021, the S&P 500 has only closed below this important trendline TWICE. So while this breakdown may look ominous coming so soon after a marginal all-time high, sellers have a LOT to prove from here. Let’s see whether they can even break May’s lows.
The NASDAQ (COMPQX) could be cooking up a triple top. However, last week’s retreat from the reflation trade barely scathed the tech-laden index. The NASDAQ remains above both its 20DMA (dotted line below) and 50DMA. If the market swings violently from inflation fears to growth fears then the NASDAQ could benefit as the presumed haven of tech companies that can thrive in a slow growth economy.
The iShares Trust Russell 2000 Index ETF (IWM) completed a disappointing week with a fresh 50DMA breakdown. Needless to say, I am leaving IWM alone for a while. My timing on trades for IWM has been particularly poor despite looking back on what looks like a relatively well-behaved, months-long trading range.
Stock Market Volatility
The volatility index (VIX) came to life once again. The churn at the recent lows and the refusal to follow through with more complacency set up last week’s scramble of selling. The VIX even managed to hurtle over the important 20 threshold level: volatility is once again “heightened”. As a result, I think the VIX could survive another day or two at higher levels before the faders return to do their regularly scheduled work on the VIX. I will be looking to see whether the VIX can endure the near inevitable assault of faders with a defense of the 18 level or so.
My last call options on ProShares Ultra VIX Short-Term Futures ETF (UVXY) expired worthless on Friday. Timing is everything.
The Short-Term Trading Call As Oversold Conditions Loom
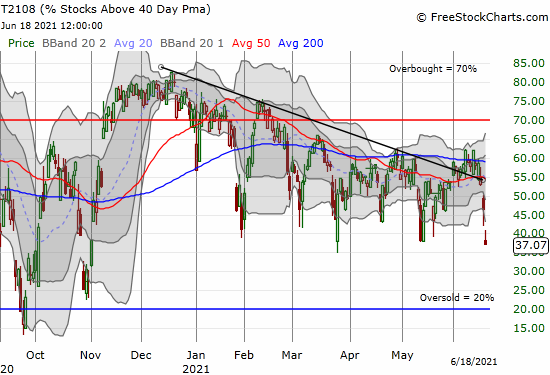
- AT40 (T2108) = 37.1% of stocks are trading above their respective 40-day moving averages
- AT200 (T2107) = 74.3% of stocks are trading above their respective 200-day moving averages (TradingView’s calculation)
- Short-term Trading Call: neutral
AT40 (T2108), the percentage of stocks trading above their respective 40DMAs, plunged for a second straight day. I thought Thursday’s plunge was steep enough to rouse the “bargain shoppers.” Instead, the broad-based selling got a second wind on Friday. AT40 closed at 37.1%. This 2021 closing low further highlights the rare stumble in the stock market. Suddenly, oversold conditions loom. I am tempted to come off the neutral short-term trading call to make a (cautiously) bullish call, but I see too many signs that the coming (relief) bounce could be short-lived. I prefer to flip bullish on a true oversold reading with AT40 below 20%.
While the parallel spike in the volatility index means that a relief rally could erupt at any moment, I interpret the head fake on the breadth breakout as particularly damaging to sentiment and the underlying technicals of the stock market. The stock market looks more overdue than ever for the flush that comes with a visit to oversold conditions. Note that in a bull market a drop to the 30s for AT40 is often “close enough” to oversold. The chart below shows close enough has been good enough all year; even the 40s have been sufficient to entice the buyers to rush right back into the stock market.
A Further Warning from the Currency Market
With sentiment breaking down with AT40, I am looking to the currency market for additional clues for market direction. The Australian dollar versus the Japanese yen (AUD/JPY) provided clear confirmation of a negative turn in sentiment with follow-through selling. AUD/JPY closed last week at its lowest level since March. Moreover, AUD/JPY looks like it has topped out. So, even if a relief rally erupts this week, I think the 50DMA will serve as sufficient resistance. Accordingly, I have swung to accumulating a short on AUD/JPY. AUD/JPY is also signaling that the recent all-time high in the S&P 500 may approximately hold for a while even if the index just churns in place for some time as some individual stocks benefit greatly from a rebound from oversold (-like) conditions. (See Why the Australian Dollar and Japanese Yen Matter for Stock Traders to understand the importance of AUD/JPY as an indicator of risk-on, risk-off sentiment).
Stock Chart Video Review
Stock Chart Reviews – Below the 50DMA
Financial Select Sector SPDR Fund (XLF)
The telling weakness in financials continued into the close of trading for the week. The Financial Select Sector SPDR Fund (XLF) lost another 2.4% and confirmed a 50DMA breakdown. Support at the 200DMA remains quite a distance away, but current momentum suggests that a test is on its way at some point this summer or autumn. Oversold conditions surely loom for financials. XLF could fall to its 200DMA tomorrow and still be up 6.9% for the year.
Allegheny Technologies Incorporated (ATI)
Allegheny Technologies Incorporated (ATI) sells specialty materials to industrial companies. ATI is the kind of stock to buy for the reflationary trade. Accordingly, ATI broke down during last week’s retreat from such trades. After steadily climbing the 50DMA uptrend all year, ATI is suddenly at a 3-month low after just one week of selling. I have traded in and out of ATI in the past, but its price is now in no-man’s land. In other words, ATI is mainly a buy on the strength of a fresh 50DMA breakout or at the end of weakness with a successful test of 200DMA support.
BHP Group Limited (BHP)
As a diversified commodities company, BHP Group Limited (BHP) provides a healthy window into the commodity-related trade. Looking back, I can now see that BHP carved out a double-top between March and May. Last week’s 50DMA breakdown confirmed the double-top. A test of 200DMA support will coincide with the lows of 2021. I am primed to buy back into BHP at that support… after a bounce off support.
Nike, Inc. (NKE)
Earnings are coming up this week for Nike, Inc. (NKE). NKE’s laces are unraveling a bit going into that important event. The stock has not been the same since March earnings took the stock down 4.0%. Now NKE is testing its lows of the year following confirmed 50 and 200DMA breakdowns. NKE’s topping pattern makes me worry about retail in general. That concern will double if NKE earnings create fresh lows for the year.
Applied Materials, Inc. (AMAT)
As a semiconductor equipment maker, Applied Materials, Inc. (AMAT) stands to benefit from the current chip shortage. Yet, AMAT still suffered a 50DMA breakdown in May’s selling. Earnings later in the month reminded investors of the bullish story. However, the subsequent rebound stopped cold right under the all-time high set in early April. AMAT closed last week with a fresh 50DMA breakdown. Something does not smell right here. Of course, with a 21 forward P/E, 6x sales, and 10x book, investors have already priced in most of AMAT’s good news for the coming year or so. AMAT is also up a healthy 46% for the year.
The Mosaic Company (MOS)
Fertilizer provider The Mosaic Company (MOS) has been selling off most of June. MOS confirmed a 50DMA breakdown ahead of the Fed. I sold out of MOS years ago after waiting in vain for momentum to return. I did not think to buy back during last year’s stock market calamity. MOS is up 362% from those lows but still down a whopping 81% from the all-time high set in 2008. The swoosh of selling from the pandemic was enough of a flush to help end a 9-year downtrend. MOS is also falling back from challenging its last peak in 2018.
In other words, soaring prices in the agriculture space are insufficient for boosting The Mosaic Company back to former glory.
Corning Incorporated (GLW)
I am always amazed to see high-tech glass company Corning Incorporated (GLW) still chugging along. The stock was famous back in the tech bubble days of the late 1990s when Corning provided materials for the frenzied market in fiber optic cables. GLW traded above $110 at its peak. As with so many stocks, the flush of selling from last year’s stock market crash cleared the path for fresh buying interest. GLW last peaked in April following a post-earnings pullback. The recent retreat from reflation trades was particularly unkind to GLW. Sellers took GLW straight down to 200DMA support. GLW last touched this line 11 months ago. With a relatively reasonable valuation, I am eyeing GLW for a buy on a bounce from 200DMA support.
Best Buy (BBY)
A trading range endures for Best Buy (BBY). BBY is limping along with 50 and 200DMA breakdowns. However, unlike Nike, BBY is well above its lows for the year. I have no interest in a trade here in no-man’s land. I suspect BBY will be of little interest until its next earnings report.
Winnebago Industries, Inc. (WGO)
The trade in outdoors and recreational plays has apparently run its course for now. RV maker Winnebago Industries, Inc. (WGO) cracked 200DMA support on high trading volume. The stock is now a short here with a stop above its 200DMA. With earnings coming up this week, I am content to wait to first observe the market’s reaction to that report. WGO is almost flat for the year.
Illinois Tool Works Inc. (ITW)
Illinois Tool Works Inc. (ITW) is one of those “old school” industrial stocks that gets little attention. The company’s tooling is a key component of the industrial economy. As a result, ITW has maintained a general uptrend for decades.
ITW’s confirmed 50DMA breakdown added more corroboration to the hasty retreat from industrial plays. I think it is about time I invested in this company, so I am a buyer on a test of 200DMA support. Those shares will get tucked away not to be seen again for years to come (I hope!). ITW also pays a 2% dividend yield.
AGNC Investment Corp (AGNC)
It was difficult, but I finally had to take profits in AGNC Investment Corp (AGNC). I explained the rationale in a previous post on the moves from the Federal Reserve. I will keep watching the mortgage-backed securities space for clues to the health of the housing market.
SPDR Gold Trust (GLD)
I also talked about SPDR Gold Trust (GLD) in my post discussing the Federal Reserve’s latest moves. This severe 200DMA and 50DMA breakdown loudly confirms the market’s sudden reduction in inflation fears. Note, GLD fell short of challenging even the high for the year set in January. Accordingly, GLD looks like it will churn at best for months to come.
iShares Silver Trust (SLV)
What applies to GLD also applies to iShares Silver Trust (SLV). Yet, SLV is in better shape. SLV is clinging to 200DMA support and can still “see” its high for the year. SLV is also further away from a test of its low of the year (a 7% drop away versus 5% for GLD).
Meritor, Inc. (MTOR)
Meritor, Inc. (MTOR) supplies parts for original equipment manufacturers (OEMs) in the commercial trucking industry and other industrial transportation companies. Meritor is a 112-year-old company that started trading publicly in the 1970s. The stock has gone absolutely nowhere since that time. I am astounded by that record of stock market futility. Still, such a long-established trading range can offer well-defined trading opportunities. MTOR last peaked in February and March and is now imploding with the rest of the industrial sector. MTOR confirmed bearish territory by breaking to a new low for the year last week. I will consider buying it for a rebound on a test of the lows from last September. The valuation for MTOR is also eye-popping. It is hard to find numbers THIS low anymore: 5.5 forward P/E, 0.5x sales, and 2.8x book.
Lennar Corporation (LEN)
I just finished reading the transcript from the earnings call for Lennar Corporation (LEN). It looks like LEN reignited interest in home builders right in the face of what should have been additional confirmation of the end of the seasonal trade in home builders. Lennar is as bullish as ever about the housing market and said nothing to even hint at problems.
Lennar’s message runs in stark contrast to the bearish alarm bells from Zelman & Associates. The results and assessment of its monthly survey sent the entire sector reeling on June 10th. Ivy Zelman was on the Lennar conference call but barely challenged the company on any of Zelman’s bearish observations about the industry. I will publish my own assessment of the drama in coming days. I cannot wait to see whether Zelman changes its “hold” rating on LEN. Zelman went negative on October 26th with the stock in the middle of a 50DMA breakdown; LEN took another 3 months to finish its bottoming process.
Stock Chart Reviews – Above the 50DMA
DoorDash, Inc. (DASH)
DoorDash (DASH) is enjoying a resurgence. May earnings picked the stock off the floor of all-time lows, and buyers have been active ever since. Buyers kept on purchasing right through last week’s selling in the stock market. However, the sharp fade from Friday’s intraday highs on high volume could signal the end of the momentum. Accordingly, DASH is a short on a break from Friday’s intraday low. Conversely, DASH is as bullish a buy as ever if it invalidates the topping signal with a higher close.
Maxar Technologies (MAXR)
Suddenly, bullish breakouts are hard to find. Maxar Technologies, Inc. (MAXR) broke out above its converged 50 and 200DMAs earlier in June. Wednesday’s 11.2% surge on high buying volume put an exclamation point on the breakout. Goldman Sachs (GS) initiated a buy rating on the stock with a $52 price target. While previous bullish calls on MAXR were losing propositions, I like buying the dips here on the breakout that closed the damaging post-earnings gap down from May (a 25.9% one-day plunge). From The Fly:
“The company has a ‘gem business’ in earth intelligence and a ‘turnaround opportunity’ in space Infrastructure, Poponak tells investors in a research note. The shares trade on a 14% free cash flow yield to 2023 estimates despite a ‘great long-term opportunity’ in the space market and company fundamentals that are improving, says the analyst.”
Be careful out there!
Footnotes
“Above the 40” (AT40) uses the percentage of stocks trading above their respective 40-day moving averages (DMAs) to measure breadth in he stock market. Breadth indicates the distribution of participation in a rally or sell-off. As a result, AT40 can identify extremes in market sentiment that are likely to reverse. Above the 40 is my alternative name for “T2108” which was created by Worden. Learn more about T2108 on my T2108 Resource Page. AT200, or T2107, measures the percentage of stocks trading above their respective 200DMAs.
Active AT40 (T2108) periods: Day #156 over 20%, Day #140 above 30% (overperiod), Day #1 under 40% (underperiod ending 26 days over), Day #2 under 50%, Day #7 over 60%, Day #69 under 70%


Black line: AT40 (T2108) (% measured on the right)
Red line: Overbought threshold (70%); Blue line: Oversold threshold (20%). Chart always show the latest download date. Source: FreestockCharts
Source for charts unless otherwise noted: TradingView.com
Grammar checked by Grammar Coach from Thesaurus.com
Full disclosure: short AUD/JPY, long BHP calls, long GLD, long SLV call spread and short SLV puts
FOLLOW Dr. Duru’s commentary on financial markets via StockTwits, Twitter, and even Instagram!
*Charting notes: Stock prices are not adjusted for dividends. Candlestick charts use hollow bodies: open candles indicate a close higher than the open, filled candles indicate an open higher than the close.