
Stock Market Commentary
The drag I described in the wake of the Federal Reserve’s pronouncements on monetary policy eroded the stock market a lot more than I thought. Market breadth printed a major fakeout with my favorite indicator plunging in the wake of deep selling in inflation-related trades from commodities to industrials to financials.
The Stock Market Indices
The S&P 500 (SPY) remained resilient with a second day in a row featuring a picture-perfect bounce off support at its 20-day moving average (DMA) (the dotted line below).
The NASDAQ (COMPQX) out-performed and bragged with a 0.9% gain. I am looking out for a major breakout…or major triple top.
The iShares Trust Russell 2000 Index ETF (IWM) disappointed this week with a near perfect rejection from the all-time high set in March. Despite a 1.1% loss on the day, IWM managed to bounce off 50DMA support (the red line below) and close above 20DMA support. The trading range remains full in-effect.
Stock Market Volatility
The volatility index (VIX) served as an arbiter of sentiment with a 3.1% loss. Clearly traders took sufficient solace in the tech and growth stocks that performed just fine on the day.
The Short-Term Trading Call With A Fakeout in Market Breadth Breakout
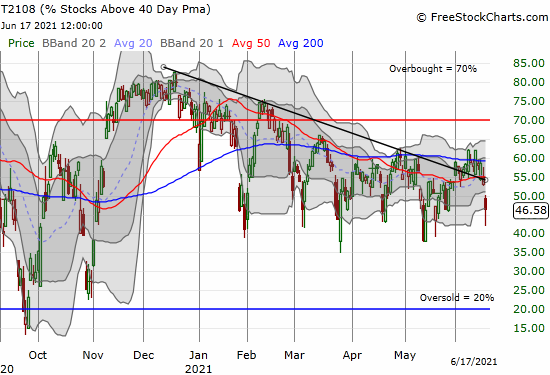
- AT40 (T2108) = 46.6% of stocks are trading above their respective 40-day moving averages
- AT200 (T2107) = 77.2% of stocks are trading above their respective 200-day moving averages (TradingView’s calculation)
- Short-term Trading Call: neutral
AT40 (T2108), the percentage of stocks trading above their respective 40DMAs, plunged all the way to 46.6%. The decline started the previous day, and today’s follow-through returned my favorite technical indicator to its previous downtrend. The fakeout in market breadth breakout is a major setback. I transitioned from preparing for a challenge of overbought trading conditions (AT40 at 70%) to wondering whether AT40 could finally break below its lows for the year.
The fakeout also created a surreal dichotomy between the inflation-related plays that are suddenly selling off sharply and the tech stocks that are rotating back into strong favor. However, just like previous plunges in AT40, the sharp drop may have created the conditions for the next rebound. Accordingly, this is not a time to get bearish but instead a time to watch closely for locking in profits on shorts and jumping into the next rotation. Note the tech stocks benefiting from the current rotation will not provide enough firepower on their own to turn AT40 around.
A Warning from the Currency Market
The currency market is flashing fresh warning signs with the Australian dollar versus the Japanese yen (AUD/JPY) suddenly dropping from its recent highs and into a confirmed 50DMA breakdown. AUD/JPY looks over-extended to the downside with the trading well below the lower Bollinger Band (BB). Still, I expect any rebound to meet stiff resistance at the 50DMA. In other words, while the drop in the VIX looks like it will give the stock market some more time to rally, I think AUD/JPY is placing a stopwatch on the lingering pockets of strength. (See Why the Australian Dollar and Japanese Yen Matter for Stock Traders to understand the importance of AUD/JPY as an indicator of risk-on, risk-off sentiment).
Stock Chart Reviews – Below the 50DMA
Financial Select Sector SPDR Fund (XLF)
The signs of weakness in financials showed up the previous day. The follow-through in weakness happened with a 50DMA breakdown in the Financial Select Sector SPDR Fund (XLF).
Stock Chart Reviews – Above the 50DMA
iShares Expanded Tech Software Sector ETF (IGV)
The iShares Expanded Tech Software Sector ETF (IGV) summarizes the fresh rotation back into tech and expensive growth stocks. The rebound is over a month old, but today’s strong out-performance is very telling. IGV still needs to beat out the February all-time high to return to fully bullish form.
Be careful out there!
Footnotes
“Above the 40” (AT40) uses the percentage of stocks trading above their respective 40-day moving averages (DMAs) to measure breadth in he stock market. Breadth indicates the distribution of participation in a rally or sell-off. As a result, AT40 can identify extremes in market sentiment that are likely to reverse. Above the 40 is my alternative name for “T2108” which was created by Worden. Learn more about T2108 on my T2108 Resource Page. AT200, or T2107, measures the percentage of stocks trading above their respective 200DMAs.
Active AT40 (T2108) periods: Day #155 over 20%, Day #139 above 30%, Day #26 over 40% (overperiod), Day #1 under 50% (underperiod), Day #6 over 60%, Day #68 under 70%


Black line: AT40 (T2108) (% measured on the right)
Red line: Overbought threshold (70%); Blue line: Oversold threshold (20%). Chart always show the latest download date. Source: FreestockCharts
Source for charts unless otherwise noted: TradingView.com
Grammar checked by Grammar Coach from Thesaurus.com
Full disclosure: long IWM calls, long AUD/JPY
FOLLOW Dr. Duru’s commentary on financial markets via StockTwits, Twitter, and even Instagram!
*Charting notes: Stock prices are not adjusted for dividends. Candlestick charts use hollow bodies: open candles indicate a close higher than the open, filled candles indicate an open higher than the close.