
Stock Market Commentary
Even the Federal Reserve must sit back and marvel as the S&P 500 (SPY) refuses to rest for long. Post-Fed handwringing sent the stock market into a period of doubt over previous assumptions of inflation fears. The previous week even ended with oversold conditions looming. However, as is the case with so many initial post-Fed reactions, the stock market quickly changed its mind on how to interpret the tea leaves. Buyers stepped in all of last week with a particular preference for tech and financials. Even as commodity plays receded, many industrial and materials found new life with yet more infrastructure talk in the U.S. government. Yet, even with the strong rebound in the stock market across the major indices, measures of market breadth failed to keep pace. The wounds in market breadth have yet to heal.
The Stock Market Indices
The S&P 500 (SPY) once again refused to spend much time below its 50-day moving average (DMA) (the red line below). The latest pullback generated a single close below the 50DMA. Buyers took over from there and notched two all-time highs to close the week in a relatively strong market rebound.
The NASDAQ (COMPQX) did not finish the week quite as strongly as the S&P 500. The tech-laden index also struggled more with its 50DMA this year. Still, the NASDAQ conquered its bearish double top pattern in convincing fashion. The NASDAQ rode the strong market rebound to three all-time highs last week. I am a buyer on this breakout until the NASDAQ closes below its previous double top line.
The iShares Trust Russell 2000 Index ETF (IWM) is playing laggard again. The index of small caps rallied all week but stopped short of making an all-time high. IWM effectively remains stuck in a 5-month trading range.
Stock Market Volatility
The volatility index (VIX) received a classic beatdown to start the week. The decline slowed down the last three days of the week. Faders applied just enough pressure to punch out a fresh 16-month low in the VIX. Accordingly, call option premiums on ProShares Ultra VIX Short-Term Futures ETF (UVXY) look exceptionally low. I jumped into a September $35/$45 UVXY call option to get early coverage for the S&P 500’s most dangerous months. UVXY closed the week at $27.54.
The Short-Term Trading Call As Oversold Conditions Loom
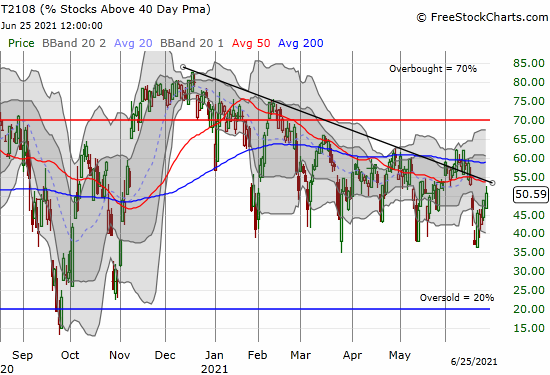
- AT40 (T2108) = 50.6% of stocks are trading above their respective 40-day moving averages
- AT200 (T2107) = 78.2% of stocks are trading above their respective 200-day moving averages (TradingView’s calculation)
- Short-term Trading Call: neutral
AT40 (T2108), the percentage of stocks trading above their respective 40DMAs, represents the wound yet unhealed. While my favorite technical indicator jumped convincingly off its low of the year, it remains below the prior downtrend. As a result, the failure to heal this wound means AT40 is far from confirming the all-time highs in the S&P 500 and the NASDAQ. AT40’s chart looks heavier and heavier, and I now fully expect (overdue) oversold conditions to visit the stock market by its most dangerous months from August to October. Needless to say, my short-term trading call resides comfortably on neutral.
A Reluctant Relief from the Currency Market
The Australian dollar versus the Japanese yen (AUD/JPY) represents another wound as yet unhealed. While this forex indicator of risk sentiment pushed upward with financial markets, it notably stopped short of 20 and 50DMA resistance the last two trading days of the week. Along with this reluctant relief from the currency market, I accumulated a short position in AUD/JPY. A new high invalidates my skepticism and punches me out of my position. (See Why the Australian Dollar and Japanese Yen Matter for Stock Traders to understand the importance of AUD/JPY as an indicator of risk-on, risk-off sentiment).
Stock Chart Video Review
Stock Chart Reviews – Below the 50DMA
Boise Cascade, L.L.C. (BCC)
As commodity plays steadily retreat, I am keeping my eyes on opportunities to trade on the next wave of inflationary pressures and fears. Lumbers prices have been in near freefall since reaching a peak on May 10th. Wood and paper company Boise Cascade, L.L.C. (BCC) is following the same path. I am a buyer on a successful test of 200DMA support. BCC last tested its 200DMA in October, 2020.
Corning (GLW)
My short-term trade on Corning (GLW) worked out as a classic test of 200DMA support. I took profits on Thursday when sellers looked ready to end the party. Friday’s small pullback gives me the impression that 20DMA resistance will hold firm as it did before the selling accelerated into a 200DMA test.
Caterpillar, Inc. (CAT)
The industrial plays had a strong rebound last week until Caterpillar (CAT) smeared the last day of trading for the week. I promptly dove into two put options expiring this Friday. I am looking for a mirror image kind of week that shows the industrial rebound was a temporary relief rally. If CAT instead closes above last week’s high, the stock will be clear to challenge now downtrending 50DMA resistance.
Teucrium Corn Fund ETV (CORN)
Teucrium Corn Fund ETV (CORN) looks toppy and adds to the impression that the run in commodities exhausted itself. The May and June peaks form a double top. Friday’s 2.7% loss created a 2-month closing low that confirmed the double top. I will not dip back into CORN until 1) a successful test of 200DMA support, or 2) a fresh confirmed 50DMA breakout – whichever comes first.
Allegheny Technologies Incorporated (ATI)
The fresh plunge in Allegheny Technologies Incorporated (ATI) on extremely high trading volume flags a renewed downside risk. Volume surged close to 8 times average on a 6.3% loss in price. However, I cannot find explanatory news. Perhaps some trader(s) got the drop on imminent bad news. Surprisingly, there was almost no trading volume on any ATI options.
KB Home (KBH)
KB Home (KBH) is now one of the most important home builder charts for me. Even though shares typically lag the sector, KBH’s latest woes expose waning momentum in the housing market; the tide lifting all boats is heading back out to sea. KBH lost 6.7% post-earnings and confirmed the 200DMA breakdown the next day. Extremely high trading volume ahead of and following earnings flags a rapid exit from KBH. When KBH last touched its 200DMA at the beginning of the year, the iShares U.S. Home Construction ETF (ITB) was testing 50DMA support. So if downward pressure continues for KBH, I fully expect the same for ITB. Looks like the seasonal trading patterns ended right on schedule this year. The housing market is another wound left unhealed by the strong rebound in the stock market.
Stock Chart Reviews – Above the 50DMA
Financial Select Sector SPDR Fund (XLF)
The previous week, the Financial Select Sector SPDR Fund (XLF) look fit and snug in a bear suit. XLF definitively confirmed a 50DMA breakdown on high trading volume. The following week, buyers happily stepped right in and scooped up shares all week. XLF ended the week a hair above its 50DMA. I still think the 50DMA breakdown is the more important signal. The subsequent buying looks like a relief bounce until XLF hurtles the top of the big candle that generated the 50DMA breakdown.
Celsius Holdings, Inc. (CELH)
The secondary lessons from Celsius Holdings, Inc. (CELH) continue to unfold. I bought more CELH after it closed above the offering price of $62.50. That signal of a successful absorption of the extra shares allowed me to participate in the complete recovery of the post secondary loss. The stock wavered with Friday’s 1.2% loss, so upward momentum may take a rest for a bit here. I am giving the stock some latitude given the impressive recovery.
Etsy, Inc. (ETSY)
I will never understand the valuation of Etsy, Inc. (ETSY), but I do not need to (now 13x sales and 65x forward earnings). ETSY broke out of a consolidation period with a 200 and then a confirmed 50DMA breakout. I dutifully bought call options as a trade on this bullish move.
Carmax (KMX)
Earnings treated Carmax (KMX) well. KMX pulled off a 50DMA breakout on a 6.7% post-earnings gain. I am a buyer after the dust settles a bit and at least the upper Bollinger Band (BB) catches up to the price action.
Granite Construction Incorporated (GVA)
News of an agreement on infrastructure spending between President Biden and a bipartisan group of Senators helped complete a week of recovery for related trades. Granite Construction Incorporated (GVA) is one of the strongest of the group. GVA broke out to a near 2-year high on Friday. However, the sharp fade from the intraday highs keeps me skeptical that the rally in infrastructure names still has legs. Indeed, both political parties are already raising heckles over the deal and some Senators in the deal are walking back some of their support.
Logitech International S.A. (LOGI)
Logitech International S.A. (LOGI) was a pandemic darling as computer accessories became popular for remote learning and work-from-home. This year, LOGI has stumbled more even as it logged an all-time high earlier this month. I am looking to buy this latest dip after buyers show interest again.
lululemon athletica inc (LULU)
Lululemon athletica inc (LULU) demonstrated both the potential trickiness and power of a 200DMA breakout. LULU suffered a fakeout in April after an impressive post-earnings recovery. LULU enjoyed a 3.8% post-earnings gain this month which in turn launched the momentum for a fresh 200DMA challenge. The key difference in these moves lies in the prior trading. In April, LULU fought against bad news. Now, LULU surfs with good news.
Match Group, Inc. (MTCH)
I thought I did well to trade Match Group, Inc. (MTCH) for a rebound to 50DMA resistance. After additional churn, MTCH finally ignited. A 3.6% gain on a 50DMA breakout was the signal…and I completely missed it! All I can do now is look for future dips to buy. The all-time high set in February looms as resistance.
Nike, Inc. (NKE)
So much for limping into earnings! Nike (NKE) crept higher into earnings after testing its 2021 lows. NKE even managed to close right at its 200DMA ahead of earnings. A 15.5% post-earnings pop to an all-time high re-established NKE bullishness after an 8-month trading range. The reward here went to the patient!
Sally Beauty Holdings, Inc. (SBH)
Some stocks just need more love from an analyst. Sally Beauty Holdings, Inc. (SBH) looked like it was slipping away to an eventual test of 200DMA support until analysts hiked ratings on the stock. SBH got a double heaping from upgrades to outperform from Cowen and Oppenheimer. The stock responded in kind with a 13.6% gain and 50DMA breakout. Oppenheimer’s $24 price target is already in view, so Cowen’s $30 price target will have to carry the load going forward. Regardless, I want to buy SBH here on the confirmed 50DMA breakout.
Tesla (TSLA)
Tesla (TSLA) finally broke out above its 50DMA resistance again. Unlike the last breakout, TSLA confirmed the move with a higher close. I already flipped through a calendar call spread on the move. I am looking to buy dips until/unless TSLA drops below its 50DMA.
Twitter Inc (TWTR)
Shame on me for continuing to under-estimate the staying power of Twitter (TWTR). I took profits on my last TWTR trade as it approached 50DMA resistance. Last week, TWTR confirmed a 50DMA breakout and shot straight for a close of its post-earnings gap down. Needless to say I am buying dips from here.
Uber (UBER)
Uber (UBER) snuck in a 50DMA breakout to close the week of trading. I am a buyer on a higher close. UBER took a while but it closed its post-earnings gap down. This breakout could be the start of fresh momentum going into the next earnings report. Of course I am keenly aware of the lessons learned from LULU’s post-earnings recovery (described above).
Be careful out there!
Footnotes
“Above the 40” (AT40) uses the percentage of stocks trading above their respective 40-day moving averages (DMAs) to measure breadth in he stock market. Breadth indicates the distribution of participation in a rally or sell-off. As a result, AT40 can identify extremes in market sentiment that are likely to reverse. Above the 40 is my alternative name for “T2108” which was created by Worden. Learn more about T2108 on my T2108 Resource Page. AT200, or T2107, measures the percentage of stocks trading above their respective 200DMAs.
Active AT40 (T2108) periods: Day #161 over 20%, Day #145 above 30%, Day #5 over 40%, Day #1 over 50% (overperiod), Day #12 over 60%, Day #74 under 70%


Black line: AT40 (T2108) (% measured on the right)
Red line: Overbought threshold (70%); Blue line: Oversold threshold (20%). Chart always show the latest download date. Source: FreestockCharts
Source for charts unless otherwise noted: TradingView.com
Grammar checked by Grammar Coach from Thesaurus.com
Full disclosure: short AUD/JPY, long UVXY call spread, long CELH, long CAT puts, long ETSY calls
FOLLOW Dr. Duru’s commentary on financial markets via StockTwits, Twitter, and even Instagram!
*Charting notes: Stock prices are not adjusted for dividends. Candlestick charts use hollow bodies: open candles indicate a close higher than the open, filled candles indicate an open higher than the close.