
Housing Market Intro and Summary
The Spring selling season looked like it started strong for new home sales. The data for April reveal a story evolving differently. Absolute inventories rose for both existing and new homes and yet sales declined. Housing starts also suffered a setback. Median prices of homes soared, especially for new homes, as sales skewed more toward the higher end of markets. Home builders face increasing cost pressures and buyers lament affordability challenges. The stocks of home builders also felt the pressure in May during a sharp 2-day pullback. Yet, with mortgage rates still near record lows, sentiment remaining high among home builders, and the tailwinds of strong housing demand still blowing, the current “cooling” resembles an overdue normalization of the housing market. Important trends continue to point upward for now.
Housing Stocks
The iShares Dow Jones US Home Construction Index Fund (ITB) fell 1.8% in May for a rare down month. I finally brought my seasonal trade on home builders to an end given the sharp pullback in May and the softening housing data. ITB remains in a strong uptrend given support at its 50-day moving average (DMA) (the red line below) remains intact. However, I concluded the risk/reward no longer favors the seasonal trade with normalization placing fresh pressures on the Spring selling season. I made one last trade in ITB June call options during the May dip. Per the seasonal trade, I now look toward October/November to get aggressive on trades in housing-related plays.
Toll Brothers (TOL) joined the ranks of stronger home builders with a solid 3.8% post-earnings bounce. TOL looks poised to challenge its all-time high set in early May.
Century Communities, Inc. (CCS) held onto its post-earnings momentum through the May pullback. CCS even ended the month hitting a new all-time high.
Lennar Corp. (LEN) is one of the home builder stocks that suffered most from the May pullback. LEN lost 7.1% on the day it sliced through 50DMA support. The stock traded down to a 2-month low before bottoming. The stock now faces overhead resistance converged at its 50DMA and downtrending 20DMA. While a fresh 50DMA breakout would suggest new light for the home builder trade, I will stay neutral even at that point.
Housing Data
New Residential Construction (Single-Family Housing Starts) – April, 2021
The February data showed softening for single-family housing starts. Starts normalized and returned to the year ago levels and the existing uptrend. March starts bounced smartly off the uptrend, but April starts dropped right back to February levels. While the monthly drop seems alarming, I continue to interpret the data as part of a process of normalization. Starts soared well above trend last year and are now returning to trend.
Single-family home sales dropped to 1,087,000 which was 13.4% below March’s 1,255,000 starts (revised slightly upward from 1,238,000). Starts were 58.7% above last year’s pandemic impacted starts. The rate of year-over-year change has remained positive for ten straight months.

Source: US. Bureau of the Census, Privately Owned Housing Starts: 1-Unit Structures [HOUST1F], first retrieved from FRED, Federal Reserve Bank of St. Louis, May 30, 2021.
The Northeast led all regions with year-over-year gains. Housing starts in the Northeast, Midwest, South, and West each changed +247.8%, +44.7%, +43.6%, +81.5% respectively year-over-year.
Existing Home Sales – April, 2021
The report on existing home sales included the classic signs of a housing slowdown: an increase in inventory accompanied by a decline in sales. So far, I have yet to read a satisfactory explanation for this divergence (for example, did California’s jump in inventory and sales skew the numbers?).
Existing home sales dropped to levels last seen July, 2020 and have yet to respond to the start of the Spring selling season. The seasonally adjusted annualized sales in April of 5.85M decreased 2.7% month-over-month from the downwardly revised 6.01M in existing sales for March. For the second month in a row, the National Association of Realtors (NAR) blamed the monthly drop in sales on insufficient inventory despite an increase in absolute inventory. The NAR looks forward to more inventory with “the falling number of homeowners in mortgage forbearance”; a looming an unwelcome event for many households. Year-over-year sales increased 33.9% over last year’s lockdown-impacted sales.
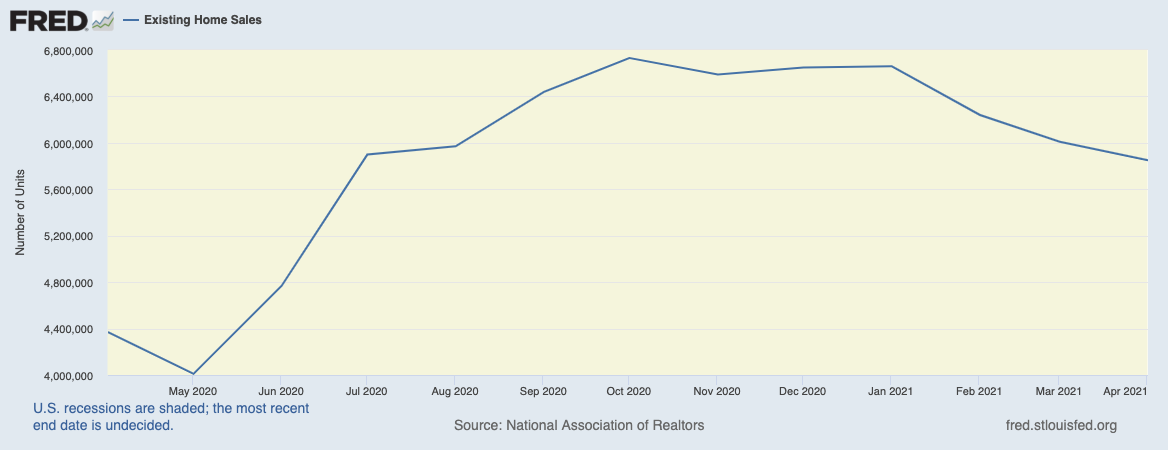
(As of the March, 2018 data, the NAR further reduced historical data to just 13 months. For historical data from 1999 to 2014, click here. For historical data from 2014 to 2018, click here) Source for chart: National Association of Realtors, Existing Home Sales© [EXHOSLUSM495S], retrieved from FRED, Federal Reserve Bank of St. Louis, May 24, 2021.

The absolute inventory level of 1.16M homes increased by 0.09M from March. Inventory dropped 20.5% year-over-year (compare to March’s 28.2%, February’s 29.5%, January’s 25.7%, December’s 23%, November’s 22%, October’s 19.8%, September’s 19.2%, August’s 18.6%, July’s 21.1%, June’s 18.2% year-over-year declines, unrevised). The inventory situation is finally improving ever so slightly even though the NAR did not recognize it as such. “Unsold inventory sits at a 2.4-month supply at the current sales pace, slightly up from March’s 2.1-month supply and down from the 4.0-month supply recorded in April 2020. These numbers continue to represent near-record lows.”
Given the slow start to the Spring selling season, I now fully doubt that the NAR’s optimistic forecast for an 8.2% year-over-year increase in single-family existing home sales will bear fruit. The tough comps coming later this year will wipe out the strong year-to-date, year-over-year gain of 20%. Affordability problems present more and more challenges to buyers. Yet, the NAR remains steadfastly optimistic that coming inventory will cool down price appreciation: “The additional supply projected for the market should cool down the torrid pace of price appreciation later in the year.”
The average 17 days it took to sell a home set a new all-time record low that slipped by the record of 18 set in March (once again, the NAR did not acknowledge the new record). The on-going year-over-year decline in inventory is on a 23-month streak.
The median price of an existing home soared to $341,600 and set a fresh record high. Prices have increased year-over-year for 110 straight months, and April’s was a 19.1% year-over-year gain. The percentage gain was also a new all-time record surpassing the 17.2% record from the previous month. The median price increased from March by 4.7%.
Soaring prices are still not slowing down first-time home buyers as a share of all buyers. First-time home buyers took a 31% share of sales in April down just slightly from March’s 32%. The NAR’s 2017 Profile of Home Buyers and Sellers reported an average of 34% for 2017, 33% for 2018, 33% for 2019, and 31% for 2020. Investors picked up the slack with 17% share of sales, up from March’s 15%, up from 10% a year ago.
The West towered above all other regions for existing home sales. The regional year-over-year changes were: Northeast +16.9%, Midwest +0.8%, South +15.9%, West +15.5%.
All regions registered strong year-over-year price gains. For April: Northeast +22.0%, Midwest +13.5%, South +15.8%, West +19.9%.
Single-family home sales decreased 3.2% from March and increased on a yearly basis by 28.9%. The median price of $347,400 was up 20.3% year-over-year.
California Existing Home Sales – April, 2021
Unlike the country overall, existing home sales in California are responding to the Spring selling season. An expanding set of records are staving normalization. These sales increased for the third month in a row (after revisions). A monthly 7.4% increase in inventory helped support red hot demand in the state. For April, the California Association of Realtors (C.AR.) reported 458,170 in existing single-family home sales for California. Sales increased 2.6% from March and increased 65.1% year-over-year. At $813,980 the median price jumped 7.2% month-over-month and 34.2% year-over-year.
California set yet more records for existing sales in April.
- $813,980 median price (broke March’s record)
- $383 per square foot
- 65.1% year-over-year price increase (from pandemic-impacted levels)
- The share of homes sold above asking price
- The sales-to-list price ratio
- 7 median number of days to sell a single-family home (down from 13 days a year ago and down from 8 in March).
The increasing price pressures prompted C.A.R. Vice President and Chief Economist Jordan Levine to doubt the durability of California’s housing market: “Not only do skyrocketing home prices threaten already-low homeownership levels and make it harder for those who don’t already have a home to purchase one, it also brings to question the sustainability of this market cycle.” In other words, the Californian housing market is overdue for normalization.
Inventory dropped to 1.6 months of sales in April from 1.7 in March (revised upward). Active listings dropped over 50% year-over-year for the fourth month in a row. San Francisco sat alone as California’s only county that increased listings (22.7%). Still, the county recorded a healthy 165.7% year-over-year increase in sales with the 2nd smallest increase in median price in California at 5.9%. Clearly, buyers are finding relative “bargains” in San Francisco. The sales activity now flies directly counter to the exodus narrative.
San Mateo became the first Californian county to crack the $2M median price mark. California experienced a stark skew in sales toward higher-priced markets:
“The million-dollar segment increased in demand by more than 200 percent year-over-year, with sales of homes priced $2 million and higher surging over 300 percent from a year ago. Sales of properties priced below $300k, on the other hand, continued to fall precipitously, with the year-over-year growth rate dropping 34 percent in April. Tight housing supply continues to be the primary constraining factor for sales in the lower price segment.”
New Residential Sales (Single-Family) – April, 2021
The path to normalization for new single-family home sales includes a peak that stretches out from July, 2020 to January, 2021. New home sales in February dropped to the lowest point since June, 2020. After what looked like a strong start to the Spring selling season for new home sales, April undermined the narrative with a monthly decline of 5.9%. April sales increased 48.3% year-over-year from the pandemic trough. March sales were revised significantly down from 1,021,000 to 917,000.

Source: US. Bureau of the Census, New One Family Houses Sold: United States [HSN1F], first retrieved from FRED, Federal Reserve Bank of St. Louis, May 30, 2021.
Median home prices ended a two month decline and rebounded sharply just short of the all-time high. The 11.4% increase was the second highest since on record (since 1963). Last Fall’s breakout to all-time highs now looks sustainable. April featured a strong skew to higher-end home sales, likely driven by California’s strong performance. The 19% of sales in the $500,000 to $749,999 price range could be a major high (I reviewed the reports as far back as 2014). The share of sales above that price range nudged up from 6% to 7%. The share of sales in the $200,000
to $299,999 price range plunged from 35% to 25%.
The monthly inventory of new homes for sale rebounded from March’s 3.6 months of sales to 4.4 months. The absolute inventory level of 316,000 was an increase from March’s 306,000. So, just as with existing home sales, my red flag went up seeing sales decline despite the increase in inventory.
The West lagged all regions for a second month in a row for year-over-year sales changes despite being the only region with a month-over-month gain. The Northeast soared triple digits again, this time 100.0%. The Midwest increased 46.7%. The South increased 61.2%. The West increased 11.6%. New home sales in the West remain well off their pandemic highs and are marginally off the pandemic lows. If not for California’s strong performance, the West may well be right back to pandemic lows.

U.S. Census Bureau and U.S. Department of Housing and Urban Development, New One Family Houses Sold: United States [HSN1F], retrieved from FRED, Federal Reserve Bank of St. Louis, May 30, 2021
Home Builder Confidence: The Housing Market Index – May, 2021
The National Association of Home Builders (NAHB) reported no change in the NAHB/Wells Fargo Housing Market Index (HMI) from April’s 83 level. In April, the NAHB pointed to strong demand as a driver boosting confidence despite supply chain issues. May’s report focused on soaring construction costs: “Policymakers must take note and find ways to increase production of domestic building materials, including lumber and steel, and suspend tariffs on imports of construction materials. In recent months, aggregate residential construction material costs were up 12 percent year-over-year, and our surveys suggest those costs are rising further. Some builders are slowing sales to manage their own supply-chains, which means growing affordability challenges for a market in critical need of more inventory.” Accordingly, the NAHB projects more price increases ahead for new homes.
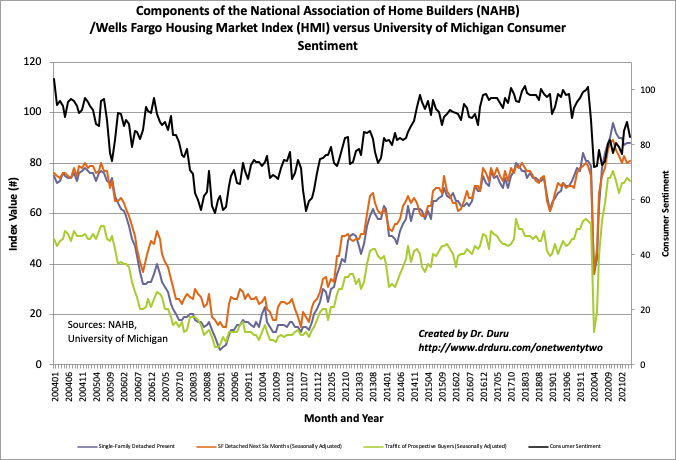
Source for data: NAHB
While the aggregate HMI remained flat, regional HMI’s moved all over the place. The Northeast plunged from 84 to 77. The Midwest pulled back from 75 to hit 72, a new low for 2021 and the lowest point since August, 2020. The South nudged upward from 84 to 86 for a new high for the year. The West remained at its lofty level of 91. These high levels stand in stark and surprising contrast to the relatively low levels of new home sales. For more consistency, I want to see the West’s new home sales move much higher from the pandemic lows.
Home closing thoughts
Housing On A Sugar High?
Demand and prices in the housing market are both strong. Yet, the Federal Reserve continues its furious pace of purchasing Mortgage Backed Securities (MBS). The traders on CNBC’s Fast Money cannot explain why. As a result, they mused over whether the housing market is feeding off a “sugar high”, a high that inevitably comes crashing down. Is it possible the MBS market remains broken? Insufficient buyers? Whatever the reason, the support for MBS’s is helping to support a high velocity of housing activity.
My favorite investment in the MBS recovery remains AGNC Investment Corp (AGNC). I made the case for buying AGNC in the immediate wake of the collapse of the MBS market.
Lumber Watch
Lumber prices finally cooled off in May. Futures for lumber are still in a strong uptrend as demonstrated by the 50DMA. While this pullback brings some relief to the industry, the accompanying drop in housing sales and starts make me wonder whether cooling lumber prices signal a cooler housing market ahead. This decline could at minimum represent a reluctant slide into normalization.
Earlier in the month, the NAHB posted alarming info on soaring material costs for home builders. Building materials prices are setting new records in aggregate. Chart after chart in this article show soaring prices for steel mill products, softwood lumber, gypsum products, and on-going price increases in ready-mix concrete.
Be careful out there!
Full disclosure: long ITB call options