
The S&P 500’s maximum drawdown for October was 9.4% on a closing price basis. That was the third worst October for the S&P 500 (SPY) on a drawdown basis since since 1951. Only the 30.1% maximum drawdown from October, 1987 and the 27.2% maximum drawdown from October, 2008 were worse. THAT is some awful company to keep! After October, 2018 comes October, 1978 with its maximum drawdown of 9.2%.
For November, I still expected the S&P 500 to be relatively benign as the history of the S&P 500 (SPY) suggests it should be. A strong start to the month seemed to validate history. The month was anything but benign.
Thanks to a sell-off that was part of yet another poor reaction to the Fed, the S&P 500 (SPY) retested the October low which occurred at the end of a major oversold period.
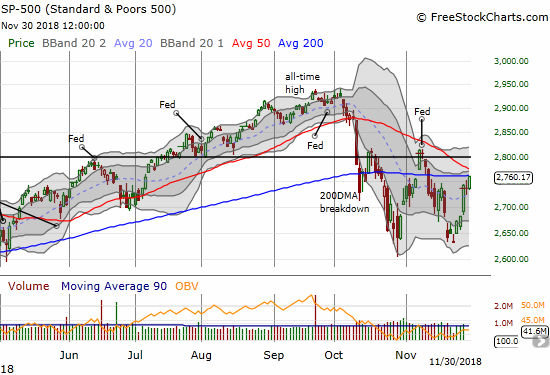
Source: FreeStockCharts.com
Somehow, the stock market avoided a return to oversold conditions in November. I consider that escape a “good enough” form of a bullish divergence which supports the notion of a confirmed double-bottom. December will provide a critical proof point for that conclusion.
Even more telling was the drawdown story. The maximum drawdown for November was 2.9%. As the chart below shows, the average maximum drawdown for November is 2.3% and the median maximum drawdown is 1.1%. Last month’s drawdown was in-line with the “most dangerous months” of August to October.
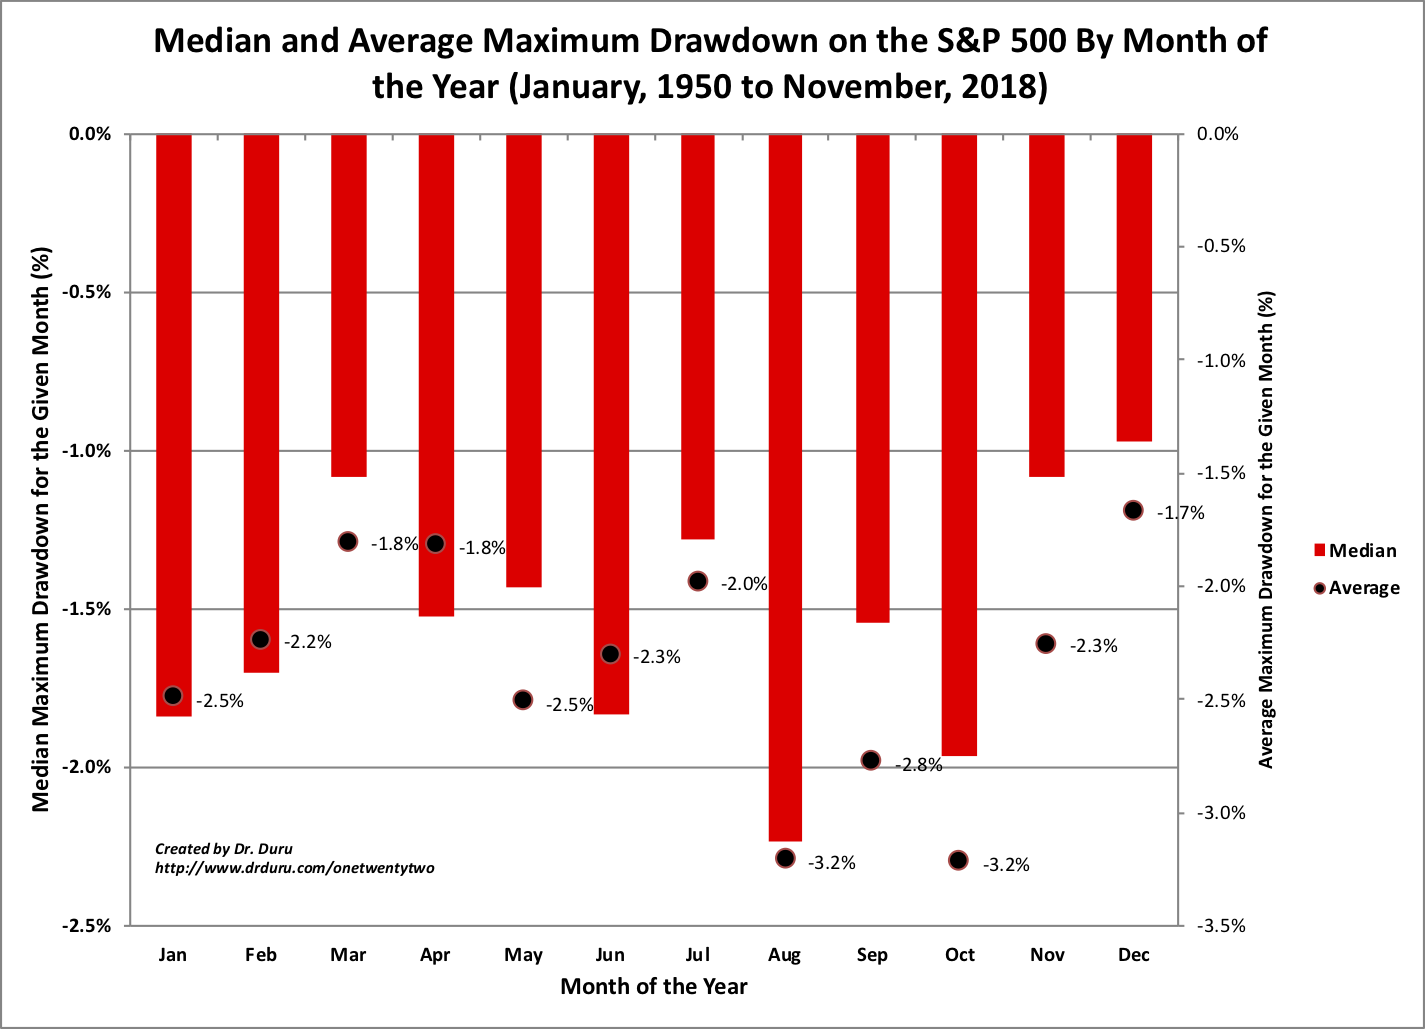
Source for data: Yahoo Finance
Through it all, November ended with a GAIN of 1.7%. That gain may be a temporary respite if the S&P 500 does not soon break through its 200DMA resistance and then its declining 50DMA resistance. Even after THOSE milestones, the index must manage to climb over the 2816 price level to return to a more bullish stature.
Be careful out there!
Full disclosure: long SSO