
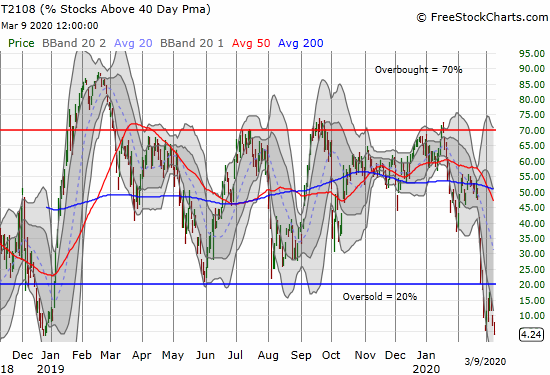
AT40 = 4.2% of stocks are trading above their respective 40-day moving averages (DMAs) (9th oversold day)
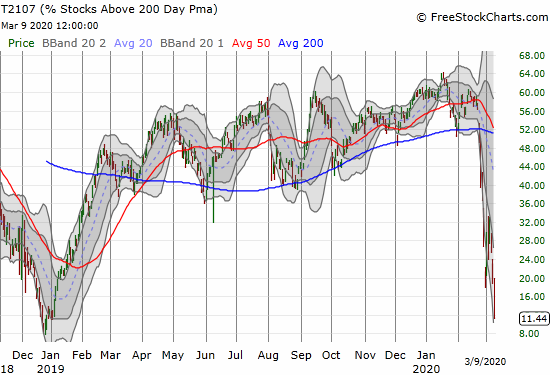
AT200 = 11.4% of stocks are trading above their respective 200DMAs
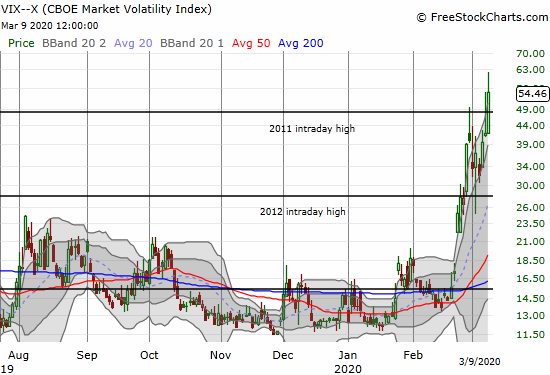
VIX = 54.5
Short-term Trading Call: bullish
Stock Market Commentary
The Shake and Bake bottom completely collapsed on Monday in the face of massive second derivative selling. The stock market is officially in “anything can and will happen” territory as a rolling global crash began Sunday night. The extreme oversold conditions keep getting more extreme. The sellers completely dominated the trading action and have essentially pushed the stock market into bear market territory.
Oversold
AT40 (T2108), the percentage of stocks trading above their respective 40-day moving averages (DMAs), hit new lows as the oversold period stretched into its 9th day. My favorite technical indicator was last this low at the end of the big 2018 sell-off that bottomed December 24th. I would like to think that history will soon repeat itself with a sharp rebound, but this time looks a lot different with so many negatives weighing down on the market and the global economy.
While AT40 is at extremes, AT200 (T2107), the percentage of stocks trading above their respective 200DMAs, is the signature of a bear market. At 11.4%, AT200 says that the vast majority of stocks are suffering under their critical long-term trend lines. Anyone and everyone long the market is in some kind of pain. What makes this time so different is that the path to this point was nearly vertical whereas the last trip to these levels was more diagonal. In other words, this plunge is particularly violent, abrupt, and panicked.
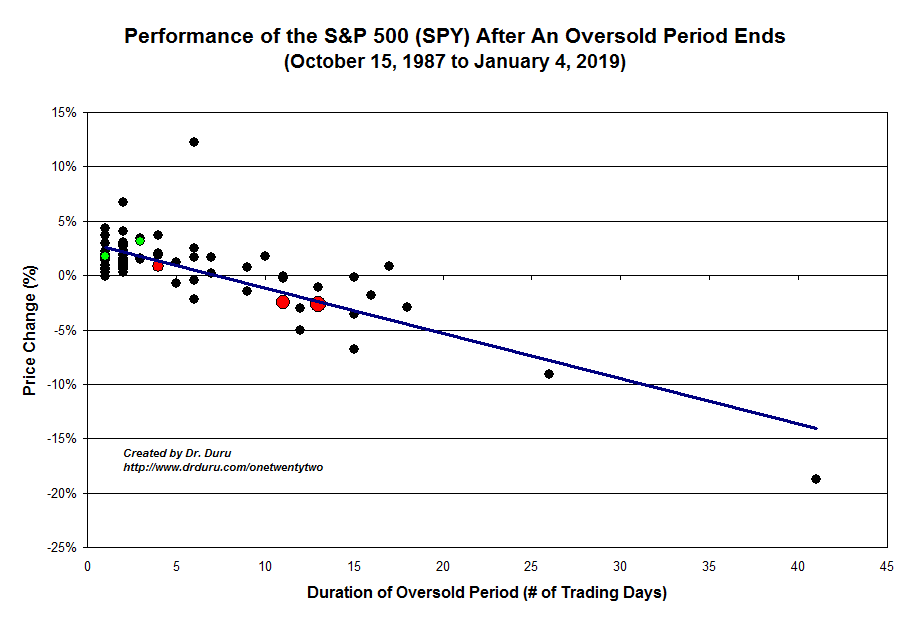
At 9 days in duration, this oversold period is very likely to end with the S&P 500 (SPY) printing a net loss. The chart below shows that starting at 10 days in duration the index has left oversold territory with a loss. That projected loss gets worse the longer these oversold conditions last. The S&P 500 is now down 11.9% since going oversold on February 26th. The good news is that odds favor buying here for an eventual gain within 5-7 trading days. If the oversold period lasts even longer, then this oversold period will become truly historic. The last two points on the chart below come from the 1987 stock market crash and the financial crisis.
The Stock Market Indices
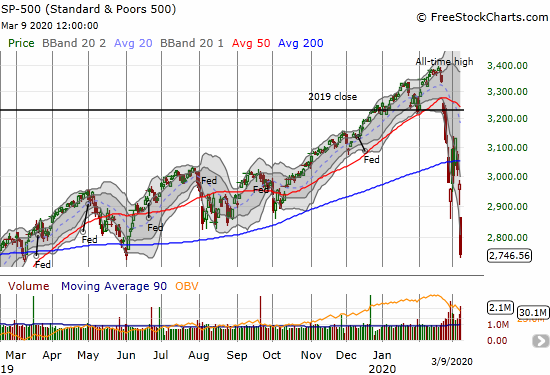
The S&P 500 (SPY) chart says it all. The 7.6% loss and close near the lows of the day decisively left behind a lot of churn. This move confirmed with a bang the 200DMA breakdown. The low from June, 2019 looks like no match as support against such heavy selling pressure. Circuit breakers which flipped after the first 3 minutes of trading probably prevented the index from losing a lot more on the day.
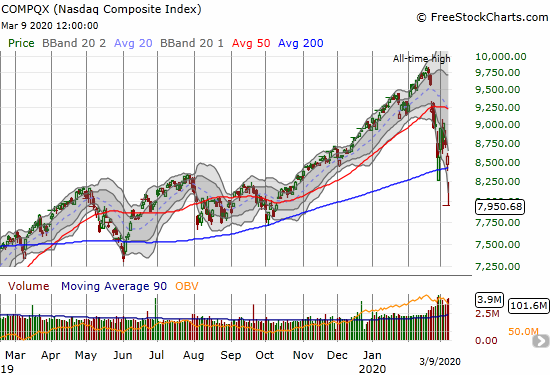
The NASDAQ (COMPQX) finally gave up its 200DMA support. An attempted rally was faded sharply going into the close. Like the S&P 500, the NASDAQ cleared up the signalling by leaving behind a lot of churn. Amazingly, the NASDAQ is just now reversing its October, 2019 breakout.
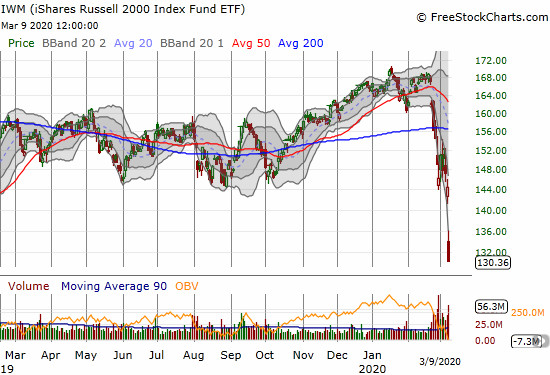
The iShares Russell 2000 Index Fund ETF (IWM) has behaved relatively poorly through much of the oversold period. Friday’s new low was the big signal of danger that I under-estimated. Today’s 9.7% loss was truly remarkable and almost erased all of the hard fought gains of the index of small caps since the bottom of the 2018 sell-off.
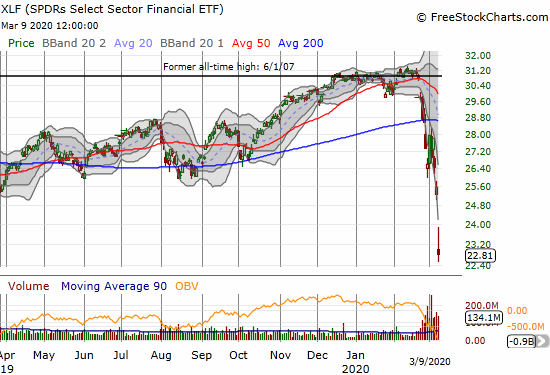
The SPDRS Select Sector Financial ETF (XLF) has also behaved poorly with Friday’s new low looking even worse than IWM. This plunge in financials highlights the bear market risk that I under-estimated for the short-term.
Friday’s divergence between the Invesco S&P 500 Low Volatility ETF (SPLV) and the Invesco S&P 500 High Beta ETF (SPHB) gave me fresh reason for concern. The collective action of these indices look more and more like key tells. Of course neither one escaped the broad-based selling in the market but performance diverged even further. SPLV lost 6.2% while SPHB lost 12.8%. Even more importantly, SPHB is back to the December, 2018 lows while SPLV is “only” at a 9-month low. The key question: is SPHB signalling a near bottom or is SPLV signalling the selling still has a ways to go? I will be throwing out yet another red flag if SPHB breaches its December, 2018 low.
Volatility
The volatility index (VIX) keeps stair-stepping higher and defying all topping patterns. The VIX was last this high during the financial crisis and acts like it wants to set new all-time records. At these levels and with this kind of upward persistence, the market is saying that the range of possibilities for direction are exceptionally wide. That read means both opportunity and huge risk in the short-term.
The Short-Term Trading Call
This oversold period is reaching toward historic proportions. The near tests of the lows of the big 2018 sell-off combined with a VIX at financial crisis levels says a lot of potential upside lays ahead, but more pain may be sustained trying to tap that upside potential. Financial authorities and global governments will surely scramble even more to try to defend the lows from 2018.
I hit the reset button on the AT40 trading strategy. I slowed down the pace of buying and almost focused more on accumulating shares in the Pro Shares Ultra S&P 500 (SSO) and my rag-tag crew of housing-market plays. Once the VIX finally logs a definitive down day, especially a close below 39 (past the last big up bars), I will think of grabbing more individual shares, selling puts, and the like. The market’s response to inevitable interference from financial and government authorities will also be important for sizing my positions: the better the response, the more risk I will take.
Stock Chart Reviews – Below the 200DMA
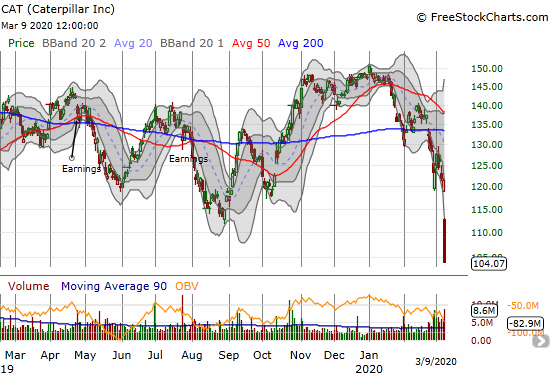
Caterpillar (CAT)
I missed quite a few big opportunities this oversold period. Caterpillar (CAT) is perhaps the biggest. CAT is my favorite hedge against bullishness, and its amazing 14.3% loss on Monday would have delivered a tremendous cushion to my bullish positions. Alas, I flipped out of CAT puts TWICE last week to take profits ahead of what I thought would be resounding confirmation of a (even if not THE) bottom in the stock market. I relearned a lesson in holding onto hedges longer than I think I need them!
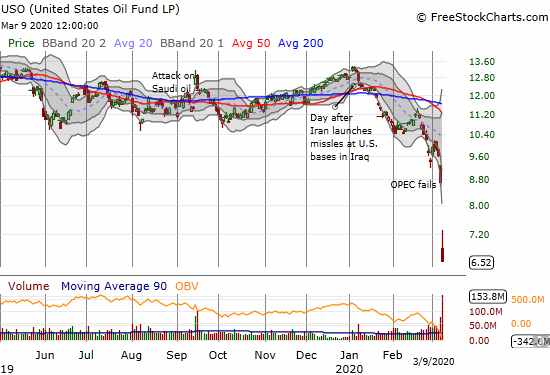
United States Oil Fund LP (USO)
Oil was at the epicenter of the sell-off and even shared the stage with the on-going coronavirus panic. The United States Oil Fund LP (USO) cratered 25.3% to an all-time low. The entire energy sector experience a tsunami of massive selling that promises to ripple far and wide through the sector and economy for some time to come. I would not even consider going long USO until it closed above Monday’s intraday high. My contrarian call for 2020 is pretty much dead in the water!
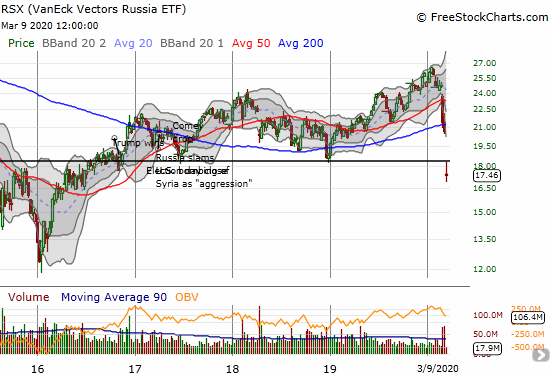
VanEck Vectors Russia (RSX)
Russian stocks paid a dear price for Russia’s game of chicken with Saudi Arabia on oil prices. VanEck Vectors Russia (RSX) lost 15% and closed at a near 4-year low.
Stock Chart Reviews – Above the 50DMA
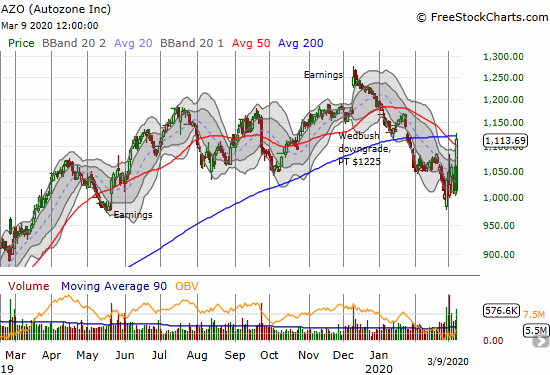
Autozone (AZO)
I am pretty sure Autozone (AZO) was my only bullish position besides gold that produced a gain (I did not dare look and gave my eyes a break for the day). AZO may finally be doing what I have expected for several weeks…act like a defensive play in the face of potential economic troubles. If AZO manages to close above its 200DMA, I will add to my position.
— – —
FOLLOW Dr. Duru’s commentary on financial markets via email, StockTwits, Twitter, and even Instagram!
“Above the 40” uses the percentage of stocks trading above their respective 40-day moving averages (DMAs) to assess the technical health of the stock market and to identify extremes in market sentiment that are likely to reverse. Abbreviated as AT40, Above the 40 is an alternative label for “T2108” which was created by Worden. Learn more about T2108 on my T2108 Resource Page. AT200, or T2107, measures the percentage of stocks trading above their respective 200DMAs.
Active AT40 (T2108) periods: Day #8 under 20% (oversold day #8), Day #9 under 30%, Day #20 under 40%, Day #11 under 50%, Day #30 under 60%, Day #34 under 70%
Daily AT40 (T2108)
")
Black line: AT40 (T2108) (% measured on the right)
Red line: Overbought threshold (70%); Blue line: Oversold threshold (20%)
Weekly AT40 (T2108)

*All charts created using FreeStockCharts unless otherwise stated
The T2108 charts above are my LATEST updates independent of the date of this given AT40 post. For my latest AT40 post click here.
Be careful out there!
Full disclosure: long IWM calls, long QQQ calls and shares, long SVXY call, long UVXY puts, long SSO, long USO calls, long AZO, short UVXY
*Charting notes: FreeStockCharts stock prices are not adjusted for dividends. TradingView.com charts for currencies use Tokyo time as the start of the forex trading day. FreeStockCharts currency charts are based on Eastern U.S. time to define the trading day.
“This oversold period is reaching toward historic proportions. The near tests of the lows of the big 2018 sell-off combined with a VIX at financial crisis levels says a lot of potential upside lays ahead, but more pain may be sustained….”
As in the past, we will likely look back at this period in a year or two and wonder why we didn’t buy….at least something….
In the near term, there is no bottom, and probably won’t be for a while.
But there are a few things to keep in mind:
a. The markets worldwide will be flooded with cash. The FED will be forced to cut rates even more.
b. Oil is at 20 year lows. Very good for the economy, worldwide.
The bad news is that more people are staying home every day, which will have a very negative effect on the worldwide economy. How long and severe is anybody’s guess. Earnings will get hit for sure. But like all previous crises, it is a one time event, and while this thing is clearly going to kill more people, it’s been elevated to the level of a global catastrophe. That it is not, but perception is reality, and the markets are treating it that way.
Real estate that sold for X in 2009 is now selling at 3X. Back then you could hardly even find a buyer.
Lunacy only persists for so long. 1929 made John Templeton a wealthy and happy man. Those buying in 2008 and 2009 (including me) are still happy. Those buying at the end of 2018 were happy for at least a year.
Will it go lower? Probably. I certainly hope so. And it will react to the news every day, just as in 2008/2009.
We’ll see in a year or two how well I’ve done. In the meantime, position sizing is key. Too much too soon isn’t good.
That is indeed the right perspective! Always in the middle of the crisis, we cannot imagine anything better. And then with the crisis in the rear view mirror, it looks obvious that we should have been greedy while others were fearful…
Thanks for checking in!
Wow. Would you agree?
Down about 10% today. The VIX closed at 75. Definitely a “Chicken Little” day.
I’ve been through these things before, but somehow this one FEELS different. It looks more like the ’87 decline, although that was greater, something like 22% down that Monday alone. Regardless, this is the fastest drop from an all time high to bear market territory ever, just 16 days. Maybe that’s what’s so unsettling.
It doesn’t change my plan, but it does make it psychologically harder to implement it. It’s so much easier to buy when things are up, isn’t it? Fortunately, I did some selling a few weeks ago, but of course, not enough. Selling at the highs was tough, just as buying at the lows is tough. Maybe tougher.
What’s so amazing is that this little virus, at least at this point, hasn’t caused a significant number of worldwide deaths. Many who’ve had it have recovered. But the reaction to it economically, if it continues, could be very bad, and very widespread.
Hopefully that’s all getting priced in, but who knows how long this will take to stabilize. That’s why position sizing is critical.
Wow indeed! This is a rolling, yet rapid, crash. I agree with all your sentiments. I am literally FORCING myself to find things to buy in spite of my discomfort and even occasional horror. I love my model for buying and selling the extremes, but it certainly did not prepare me for THIS kind of extreme.
My idea for position-sizing has had to rapidly evolve with the plunge as well. What I thought was reasonable just a week ago, now looks like an insane risk…in. hindsight.
Onward I go to force myself to buy into the next leg down!
Yesterday, recovering about what it lost the day before.
Volatility, anyone?
If you are familiar with the writings of Ayn Rand:
Galt turned and said, “I will stop the motor of the world.”
It may not be Galt who does this. It may instead be a little microscopic virus. So far, it’s been moving toward this result at a steady but increasing pace.
Apple is closing all of its stores outside of China. More and more schools are closing. Harvard has kicked everyone out of their dorm rooms. Everybody is working ‘from home’. On and on…
Once the market calms down, however you want to define that, it will not be over.
Because the next earnings season could be particularly ugly. Earnings revisions going forward will be unpleasantly reduced. And so, there could be a secondary hit farther down the road.
Anyone who doesn’t have AT LEAST a one to two year time frame should stay the hell out of this market.
But ultimately, the recovery will happen.
Pushing the ‘buy’ button isn’t getting any easier, though.
In any case, next week should be interesting.
Economic activity is definitely grinding to a halt and a lot of secondary and tertiary impacts will cascade throughout the year. The coming spike in unemployment and plunge in earnings will be particularly hard for the economy. An over-indebted government will be forced to spend even more and go even deeper into debt.
On the other side of the coming recession, the country, financial authorities, etc… will have a serious question to confront… how do our financial systems get out of this cycle of ever-increasing debts before we completely collapse the capacity of economies to absorb future calamities?
I joked with a friend of mine that this extreme crisis has made my long-term investments even longer! 🙂