
AT40 = 11.4% of stocks are trading above their respective 40-day moving averages (DMAs)
AT200 = 29.7% of stocks are trading above their respective 200DMAs
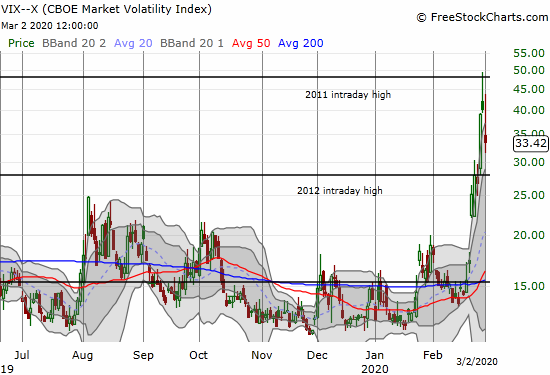
VIX = 33.4
Short-term Trading Call: bullish
Stock Market Commentary
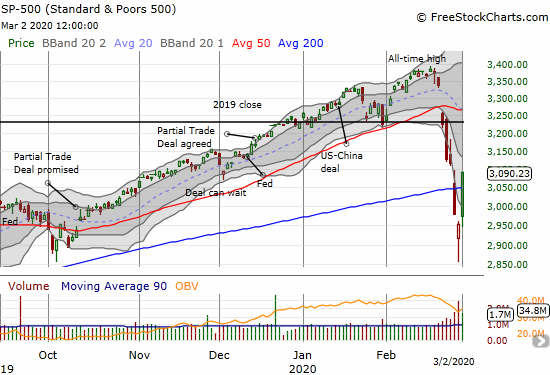
On a day of incredible moves, I was most surprised that the stock market gave traders a chance to get in on the ground floor of the rally. The S&P 500 (SPY) gapped open, but the index quickly faded back to Friday’s close before launching inexorably higher for the day. I am accustomed to seeing the majority of gains on huge up days coming from a gap open. In other words, it actually paid to chase a LOT of stocks and indices.
Oversold
While the stock market closed with incredible gains, AT40 (T2108), the percentage of stocks trading above their respective 40-day moving averages (DMAs), stayed well within oversold territory (below 20%). AT40 closed at 11.4%. Technically, the stock market then has plenty of upside left before the oversold period ends. At 4 days old, this oversold period is already beyond the median and average durations for an oversold period. So from an historical perspective, this oversold period should end this week.
The Indices
Friday’s intraday trading created a “shake and bake” bottoming pattern that firmed up my bullish convictions. However, the resulting rallies defied even my wildest and most extreme hopes. The S&P 500 rallied 4.6%. The buying was so strong that the index sliced through 200DMA resistance as it confirmed a bottoming hammer pattern. Four straight trading days closing below the lower Bollinger Band (BB) certainly built a lot of pent up buying energy!
In my last Above the 40 post I pointed to an interesting bullish divergence between the Invesco S&P 500 Low Volatility ETF (SPLV) and the Invesco S&P 500 High Beta ETF (SPHB). The rotation from SPLV to SPHB was telling, so I was surprised to see SPLV outperform SPHB on Monday 5.1% versus 3.0%. I will be keeping an eye on the implied risk preferences expressed through the relative performance of these two ETFs.
The NASDAQ (COMPQX) had a similar gain to the S&P 500 (SPY) but ended the day in better shape. The tech-laden index confirmed support at its 200DMA and became a firmer buy-the-dip candidate going forward.

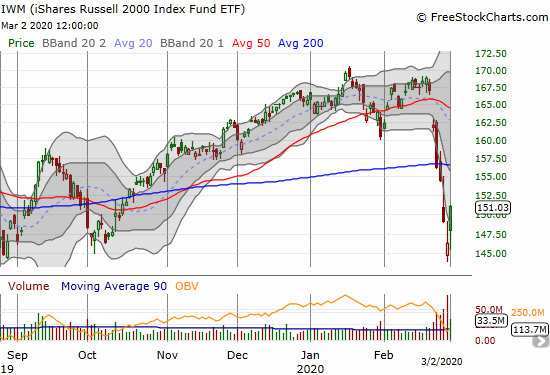
The iShares Russell 2000 Index Fund ETF (IWM) gained 3.2% without resolving much from a technical perspective. I expect IWM to keep pulling up the rear behind the S&P 500 and the NASDAQ. At least this index of small caps is making a bid to hold key support levels from 2019.
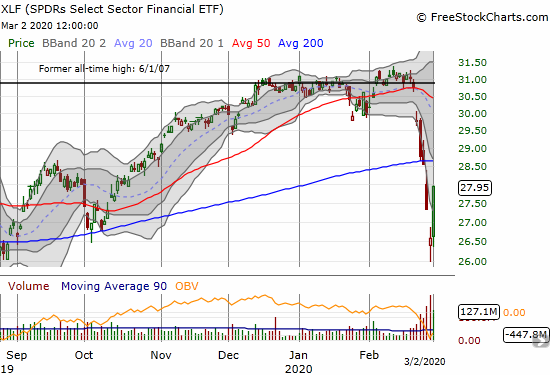
The SPDRS Select Sector Financial ETF (XLF) soared 5.1% and is just under a critical test of 200DMA resistance. I wanted to buy some financials (like Goldman Sachs (GS) and JP Morgan (JPM)) but ended the day without shares in either one. I will now wait to see what happens at the 200DMA.
Volatility
The volatility index (VIX) faded as it should on a rally day. Still, the VIX remains very elevated. I expect the end of the oversold period to coincide with the VIX returning at least to the top of the gap the started this huge volatility up cycle.
The Short-Term Trading Call
In my previous Above the 40 post I described myself as being uncomfortably bullish. I am still uncomfortable, but now because I decided to hold most of my positions bought for the oversold trade. I often take profits too early in the cycle of recovery from oversold periods. This time around I am forcing myself to hold on. (First on my to-do list on Tuesday is to buy a fresh tranche of put options in Caterpillar (CAT)!)
The rally was so sharp that it is subject to profit-taking. After last week’s vicious sell-off, traders and investors must have a mix of emotions including relief to get an opportunity to exit at better prices and a nagging feeling that this rally cannot be sustained. The market is not “normal” when it is swinging in such huge chunks. This trading action reminds me of the vicious swings from the financial crisis. Still, the defense of the shake and bake bottom was impressive. The 2,858 level on the S&P 500 now clearly divides the trading action between a correction in a bull(ish) market and a bear(ish) market.
Stock Chart Reviews – Below the 50DMA
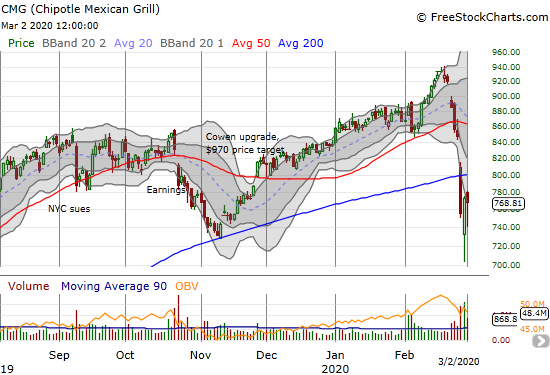
Chipotle Mexican Grill (CMG)
Chipotle Mexican Grill (CMG) did not participate in the day’s rally. The stock had to rebound just to squeeze out a 0.6% loss. CMG should make a great play when the market is on the other side of its coronavirus fears. A 200DMA breakout will re-estaiblish the stock in a bullish position. Until then, CMG is too close to its 200DMA to make it worth the risk buying. It could even be a short (for hedging other bullish positions).
Stock Chart Reviews – Above the 50DMA
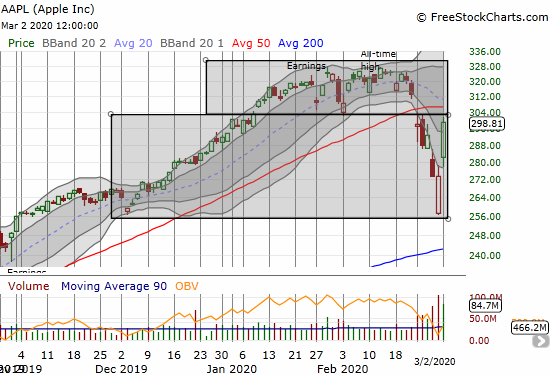
Apple (AAPL)
Apple (AAPL) led the market in a BIG way. This trillion-dollar company somehow managed to rebound for a whopping 9.3% gain. As big as that gain was, it still only erased two days of losses. I used the rally to take profits on two of my three call options…and left a LOT of money on the table. It just never occurred to me that AAPL could gain more than 4% or so on the day. I thought FIVE percent might be extreme!
In the chart below I drew two boxes to define areas of trading for AAPL. The top box is AAPL’s topping pattern. If the stock reachieves a 50DMA breakout, I think AAPL will get stuck in a trading range defined by the box. The bottom box defines the biggest trading opportunities for bulls and bears. Note how AAPL’s extreme rally covered almost the entire distance from the lower-BB to the 50DMA!
— – —
FOLLOW Dr. Duru’s commentary on financial markets via email, StockTwits, Twitter, and even Instagram!
“Above the 40” uses the percentage of stocks trading above their respective 40-day moving averages (DMAs) to assess the technical health of the stock market and to identify extremes in market sentiment that are likely to reverse. Abbreviated as AT40, Above the 40 is an alternative label for “T2108” which was created by Worden. Learn more about T2108 on my T2108 Resource Page. AT200, or T2107, measures the percentage of stocks trading above their respective 200DMAs.
Active AT40 (T2108) periods: Day #4 under 20% (oversold day #4), Day #5 under 30%, Day #16 under 40%, Day #7 under 50%, Day #26 under 60%, Day #30 under 70%
Daily AT40 (T2108)
")
Black line: AT40 (T2108) (% measured on the right)
Red line: Overbought threshold (70%); Blue line: Oversold threshold (20%)
Weekly AT40 (T2108)

*All charts created using FreeStockCharts unless otherwise stated
The T2108 charts above are my LATEST updates independent of the date of this given AT40 post. For my latest AT40 post click here.
Be careful out there!
Full disclosure: long IWM calls, long QQQ call spread and shares, long SVXY call, long AAPL call, long UVXY puts, long SSO
*Charting notes: FreeStockCharts stock prices are not adjusted for dividends. TradingView.com charts for currencies use Tokyo time as the start of the forex trading day. FreeStockCharts currency charts are based on Eastern U.S. time to define the trading day.