
I have revised and implemented the Apple Trading Model (ATM) for several years. Last year was a banner year for buying and selling AAPL weekly call options in the ATM. The success makes sense given Apple (AAPL), along with so many other stocks, especially in tech, experienced incredible runs. The patterns for the Apple Trading Model were so consistent in 2020, I pulled the data to understand the specifics and to compare 2020 to previous years. Last year sticks out so much that early detection of the end of the potential anomaly becomes the next challenge.
Strategy for the Apple Trading Model
I greatly simplified the Apple Trading Model that I first created in 2014 and tweaked for two subsequent years. The trades had great successes but not enough to make up for the many failures. I put a pause on the effort until I dusted off the toolkit in 2017. That year, AAPL broke out to a new all-time high; the stock never looked back. Accordingly, I realized a trade that simply followed the overall (up)trend made the most sense (and yes, buying and holding AAPL over all these years would have been the simplest approach of all!).
The current (short-term) Apple Trading Model consists of two steps:
- Buy weekly AAPL call options on a dip Thursday and/or Friday. Choose expiration for the following week.
- Take profits (or a loss) on the AAPL call options soon after the open for trading the following week (typically Mondays).
Actual conditions on the ground require some flexibility. As a result, I created adjustments for responsiveness. Again, simplicity is ideal: these “caveats” emphasize taking profits if they come early and expanding the risk profile in specific conditions.
- Quick rebound: If AAPL recovers from a dip on the same day of or the day following trade initiation, take profits. Reset the rules for the ATM.
- No dip: If no dip occurs by early Friday, buy a small position in weekly calls by the close of trading. If trading is particularly strong, buy a calendar spread. Set the short side to expire the next week and the long side to expire the following week.
- Monday dip: If AAPL opens the week down, consider doubling down on the current position. Sell the position by Wednesday.
- Monday strength: If AAPL opens the week exceptionally strong on fundamental news, hold the position until intraday weakness shows up in the stock.
The Supporting Data
From 2018 to 2020, Apple performed best from Monday to Wednesday. Thursday had a negative daily average that was close to zero. Friday had a -0.1% average daily performance. Averages hide skew and important segments of data; AAPL is no exception. On a yearly basis, 2018 performed the worst. The year 2020 delivered a perfect skew suited to the simplified Apple Trading Model: Monday delivered a large 0.8% average daily performance while Thursday and Friday both delivered -0.2% daily average performances. The data below use Apple’s closing price from January 2, 2018 to December 30, 2020.
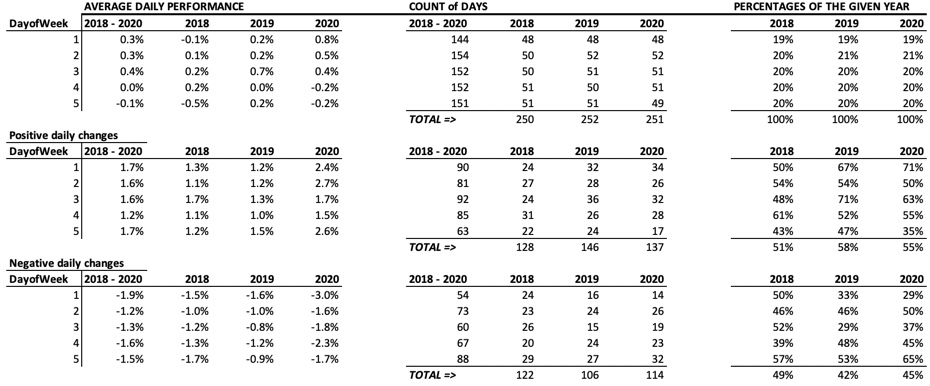
The skew in performance becomes particularly stark when segmented by positive and negative daily performance. The table above shows that when AAPL had an up day in 2020, Fridays were essentially as strong as Monday and Tuesday. In 2019, Friday was on average the strongest trading day for positive days. On negative days in 2020, Mondays on average performed the worst of the trading days by a large margin. The year 2019 had a similar story.
Finally, Monday’s performance conditioned by the previous trading day’s performance provides a great confirmation of the good odds of success when buying a dip on Friday and selling on Monday.
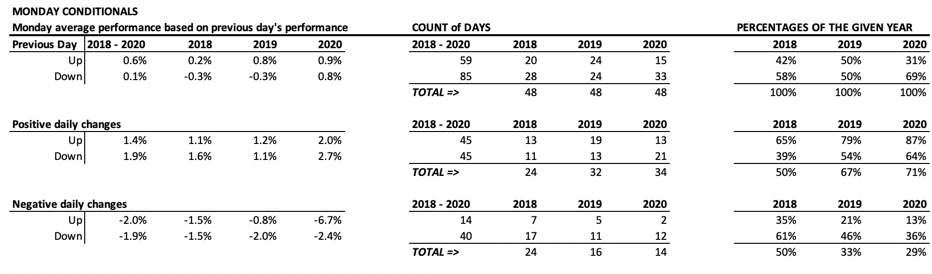
I was blown away to see that in 2020 the average performance for Monday was essentially independent of the direction of the performance of the previous trading day! Moreover, in 2018 and 2019 Monday performed best when Friday was an UP day. In other words, Apple had good momentum characteristics crossing from the end of one week to the beginning of the next.
The Trade
Only 29% of Mondays in 2020 delivered a negative performance. This share was 33% in 2019 and 50% in 2018. I would love for the trend to continue into 2021. If so, I can continue with the Apple Trading Model as-is. However, the proliferation of trading bots and algorithms works against the persistence of short-term trading trends over extended periods of time. (How many bots are already trading on AAPL’s daily price patterns?) I just have to be prepared to pivot when needed. For example, if the ATM fails 3 or 4 weeks in a row, I would be inclined to return to watch and learn mode.
In the meantime, the data give me a framework and template for searching for other stocks which offer weekly trading opportunities. Over the course of the year, I will post about my findings. I will also include formal statistical tests in future posts.
Be careful out there!
Full disclosure: long AAPL calls