
(T2108 measures the percentage of stocks trading above their respective 40-day moving averages [DMAs]. It helps to identify extremes in market sentiment that are likely to reverse. To learn more about it, see my T2108 Resource Page. You can follow real-time T2108 commentary on twitter using the #T2108 hashtag. T2108-related trades and other trades are occasionally posted on twitter using the #120trade hashtag. T2107 measures the percentage of stocks trading above their respective 200DMAs)
T2108 Status: 48.9%
T2107 Status: 52.9%
VIX Status: 18.7
General (Short-term) Trading Call: bullish
Active T2108 periods: Day #183 over 20%, Day #3 over 30%, Day #2 over 40% (overperiod), Day #32 under 50% (underperiod), Day #47 under 60%, Day #73 under 70%
Commentary
What a wild ride. I am catching my breath just long enough to write this post-election update on market technicals. There is so much to write that I started what will surely become a “Trumped Up Series” by first describing the currency context (see “Trump Change: The U.S. Dollar Swings Wildly from Election Despair to Elation“). The moves in the currency market are important context for the rest of financial markets.
In this T2108 Update, I will focus on the bullish signals that remain strong and some important caveats. I end with my an example “cheat sheet” for “Trump Trades.” The sometimes violent moves in the market have come from a combination of quick-trigger panic by traders and investors caught flat-footed, speedy portfolio adjusters, and related sector rotations. Opportunities abound when markets get this dynamic.
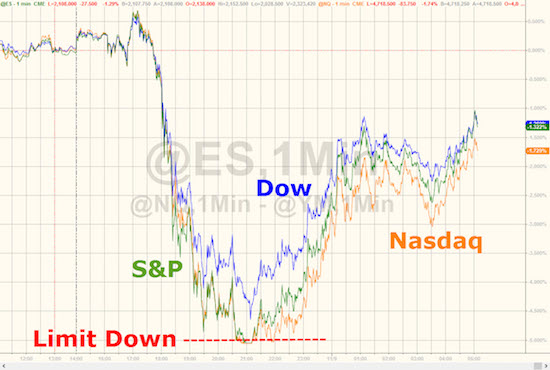
If you were not awake watching the market going into and away from President-elect Donald Trump’s victory speech, you may think that what has happened is a simple extension and confirmation of the bullish divergences that I started describing last week. What you missed in your sweet slumber was a limit-down move in S&P 500 and NASDAQ futures (I believe 5%). If I were a futures trader, I would have put my gameplan into action given the extreme oversold reading likely for the market. I would have read an article like this one – “Stocks set to plunge in massive risk-off trade following Trump upset” – and found confirmation of excessive panic. Alas, panic and fear is tough to sustain in financial markets. In no time, articles like this one – “Market shrugs off losses and brings on the ‘Trump trade’” – heralded the reversal.
Source: The Investors Wire
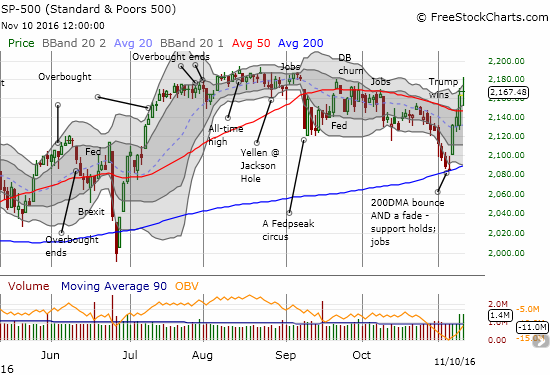
Surely, Trump’s victory speech confirmed the end of uncertainty over the election. Equally important is that traders and investors could quikcly sort through the market positives and negatives of the election’s outcome. The net result so far is an S&P 500 (SPY) that broke through the bracketed rally with convincing force. My limit orders for SPY call options never filled.
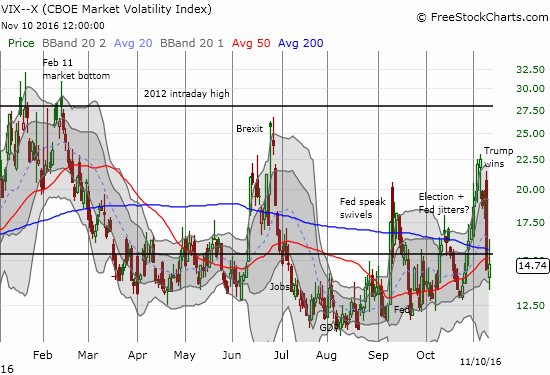
The volatility index, the VIX, supported the bullish move with a spectacular post-election volatility implosion that smashed right through the 15.35 pivot point with a 23% one-day loss. Today, the VIX gained a bit…more on that move a little further below.
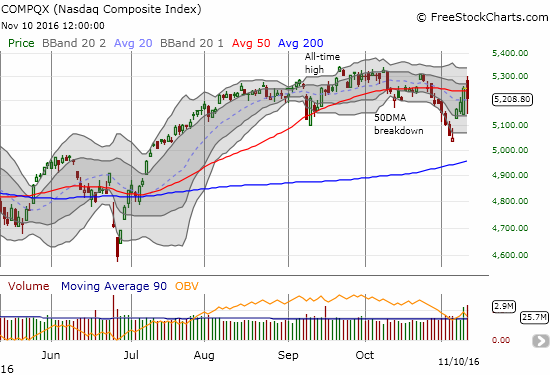
The NASDAQ (QQQ) also rallied through 50DMA resistance in the imemdiate wake of the election. However, today, the tech-laden index sank by 0.8% and at one time erased its ENTIRE gain from the previous day.
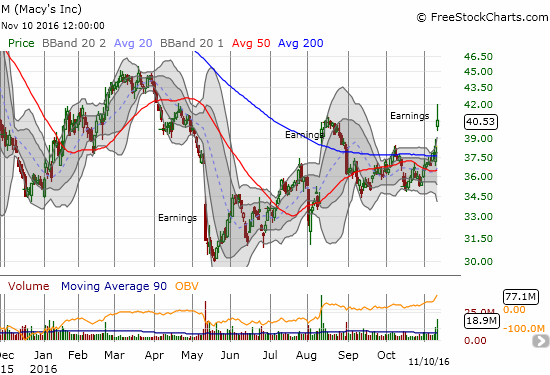
Big cap tech stocks behaved extremely poorly on this second rally day. At one point, Microsoft (MSFT) filled its post-earnings gap up in one move. Apple (AAPL) set a new post-earnings low and is working on an eventual retest of 200DMA support. I flipped my previous call options on the first post-election day and bought right back in today. Facebook (FB) cratered below its 200DMA with a loss as large as 6.4% before bouncing back to a 1.9% loss and a close above 200DMA support. Netflix (NFLX) barely closed off its low. Its 5.5% loss punched the stock into its huge post-earnings gap up. Alphabet (GOOG) closed well below 50DMA support and retested the post-earnings low with a -2.9% close.
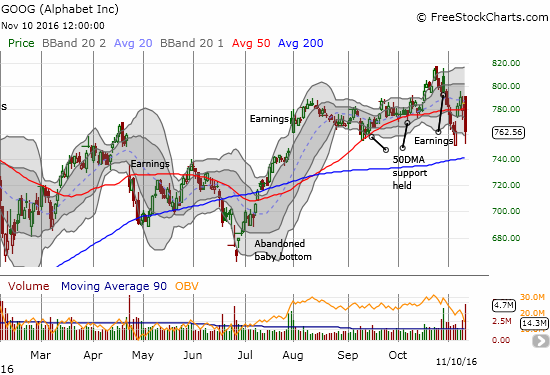
Given my bullishness, I treated all these plunges as buying opportunities. FB was the most successful given the strong recovery. I quickly locked in the profits on those call options. My profits in my GOOG call options were so fleeting that I ended the day in the red. I had my typical hedged trade on NFLX going into the election. Unfortunately, I closed out the put side one day too early.
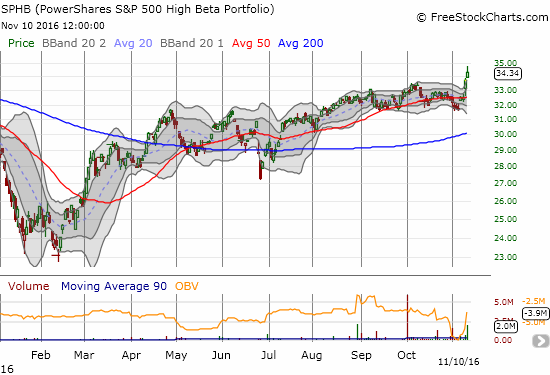
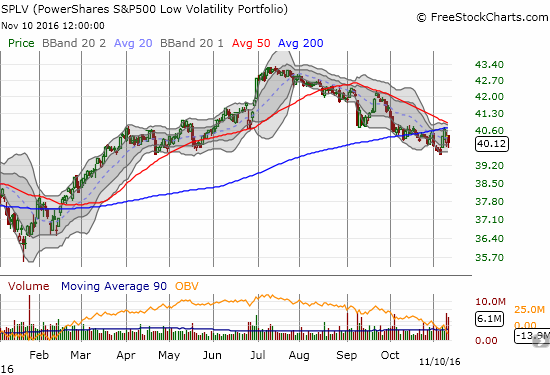
I was frankly startled by this stark divergence in performance. For confirmation I went to the high beta and low voaltility components of the S&P 500. Much to my surprise, PowerShares S&P 500 High Beta ETF (SPHB) soared for a second straight day to a new 17-month high. PowerShares S&P 500 Low Volatility ETF (SPLV) carried the losers for the day.
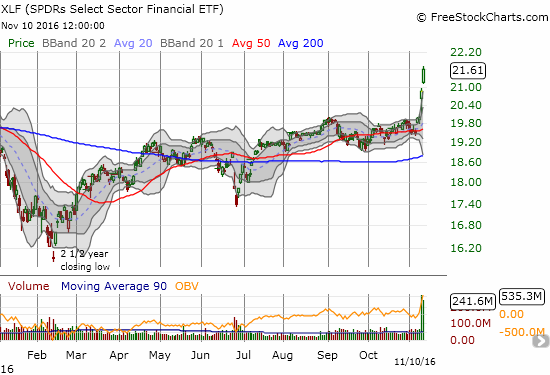
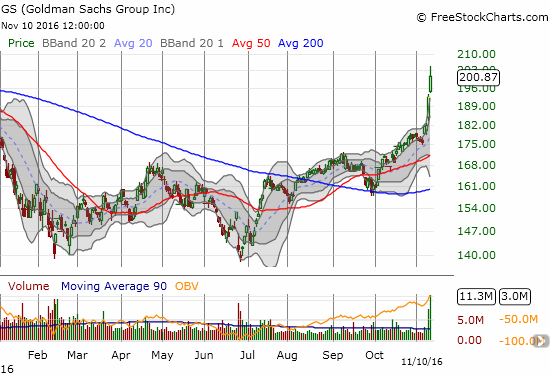
Without confirmation of a potential tech-driven bearish divergence, I turned to financials. These must be the stocks helping SPHB! I included Goldman Sachs (GS) because I was prepared to load up on a post-election dip. I never got the chance, and I surely did not expect GS to exhibit THIS kind of strength for two straight days. It is now well above its upper-Bollinger Band (BB) in what looks like a near classic parabolic move (in other words, too hot to touch now!).
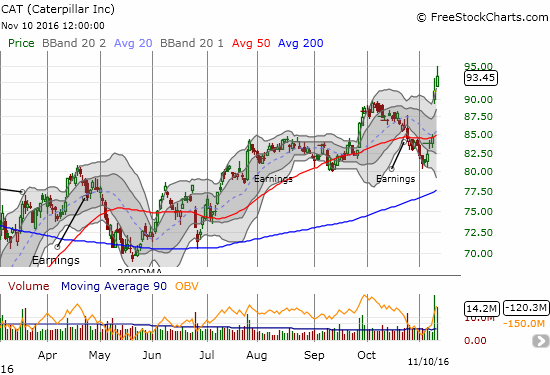
I next turned to my old friend Catepillar (CAT). On the first day after the election, my call options that I assumed were left for dead flipped instantly from near zero to $2.70. The move triggered an old limit order right at the open. Needless to say, that was a premature sale!
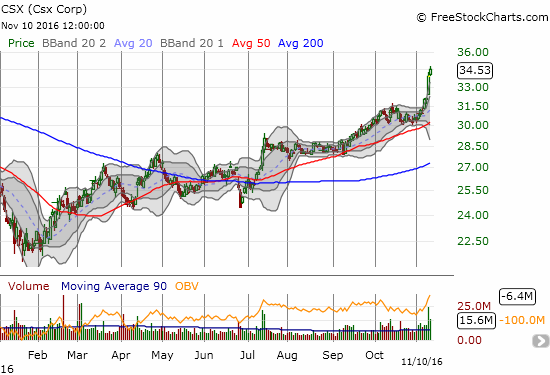
After I looked at this chart of CSX, I received all the confirmation I need that investors and traders are betting on a much stronger economy.
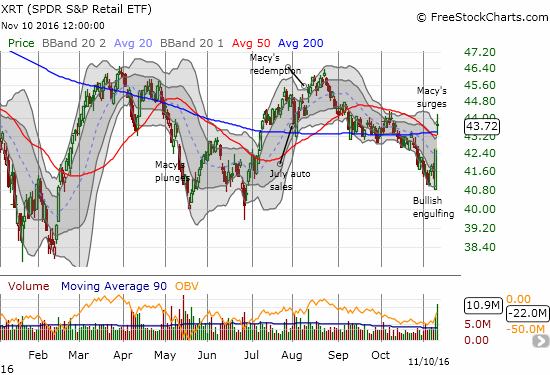
Even retailers were in rally mode after Macy’s reported well-received results. The bullish engulfing pattern on SPDR S&P Retail ETF (XRT) is a pretty convincing launching pad for a bottom.
I see absolutely every reason to maintain my bullish short-term trading call. HOWEVER, I do think that some of these run-ups look VERY stretched and very vulnerable to a fresh rotation back into today’s losers (tomorrow’s winners) like tech stocks. Accordingly, I returned to using CAT as a hedge against bullishness and bought some put options.
In these cases where theme-based trading and investing first blasts off, it can be tempting to think you can outsmart the market. For example, you might think that the earnings power in some industry cannot possibly meet investor expectations. Or perhaps you look at recent technical history and conclude that a reversion will surely come once the market returns to its “senses.” I think differently. The market is telling us that something fundamental has changed about the market’s underlying conditions. At this stage, many theories may take months, maybe even a year or two to come to fruition…or to fail. In that time, you can miss a LOT of healthy gains. I will never forget how I ignored the oil trade at the beginning of Bush Jr.’s presidency; or how for a while I ignored the reflation trade at the start of Obama’s presidency. This is NOT the time to argue with the market. This is a time to follow it. Buying dips is the safest approach to playing the new themes. As the rally matures, I may consider more hedged trades.
Finally, here is an example cheat sheet for referencing Trump Trades. In coming days and weeks, I will explore more specifics.
Positive: infrastructure, U.S. steel (protectionism), financials (increasing interest rates from inflation), home builders (inflation), prison stocks (law and order – I am actually inclined toward hedged trades here and favor shorting over the longer haul), coal stocks (lots of promises made to revive the industry and scrap regulations)
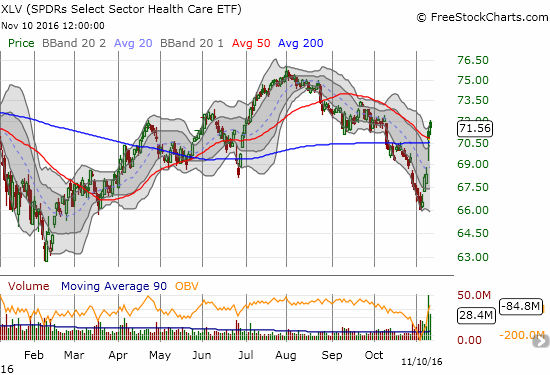
Negative: solar (no support for subsidies although at some point solar quickly becomes too cheap to sell), health care (fewer paying patients).
The health care sector is a bit complicated. If Obamacare goes down in flames, fewer paying patients will participate in the health market. Health care providers and device manufacturers go down with the ship. However, insurance companies will regain more flexibility and pricing power. In the middle sit drug makers. Assuming drug manufacturers no longer face pricing regulations, these companies should rally. However, fewer paying patients should limit their markets as well. See “The iShares Nasdaq Biotechnology (IBB) Overcomes Its First Bash” for some important technical markers for IBB.
I also think commodities are a bit complicated. On the one hand, a construction and infrastructure boom will demand lots of commodities like copper, iron ore, and even oil. However, trade restrictions and trade protectionism will disrupt the global flow of goods and suppress global commodity prices while making prices within the U.S. soar. I do not think anyone can honestly sit here at this time and work out a believable model – so let’s call this positive/negative 50/50.
— – —
FOLLOW Dr. Duru’s commentary on financial markets via email, StockTwits, Twitter, and even Instagram!
Daily T2108 vs the S&P 500
")
Black line: T2108 (measured on the right); Green line: S&P 500 (for comparative purposes)
Red line: T2108 Overbought (70%); Blue line: T2108 Oversold (20%)
Weekly T2108

*All charts created using freestockcharts.com unless otherwise stated
The charts above are the my LATEST updates independent of the date of this given T2108 post. For my latest T2108 post click here.
Related links:
The T2108 Resource Page
Be careful out there!
Full disclosure: long UVXY shares and short UVXY call, long CAT put options, long GOOG call options, long AAPL call options
Duru,
As you’ve clearly pointed out, some stocks and sectors have dramatically blasted through their upper Bollinger Bands. XLF is a great example.
Could these sectors go higher? Sure, in the short run. But in the long run, you could get severely burned getting in here. I don’t know any investor who retired holding copper or steel stocks on a long term basis. Bank stocks, while somewhat better, would have to be similarly classified. I’m starting to sell the ones I bought in 2010, as they look pretty pricey to me. By the time interest rates actually go up, they may have passed their peak. But I’l keep just a few, in case I’m wrong.
Even John Stumpf of Wells Fargo had a good week. Maybe he’s selling, too, and after his recent browbeating by Congress, crying all the way to the….um….bank….
On the other hand, some stocks which sold off dramatically this past week due to sector rotation look pretty good right now, and those you CAN retire on…in the long run…
I imagine it is hard to retire on cyclical stocks over the long-run. A lot can go wrong along the way. But for the time-being, I like riding the themes the market chooses to believe in.
I don’t think there are any post-election sell-offs that turned some stocks into screaming buys for the long-term though. Which are you specifically referring to?