
AT40 = 83.8% of stocks are trading above their respective 40-day moving averages (DMAs) (6th overbought day)
AT200 = 34.4% of stocks are trading above their respective 200DMAs (near 2-month high)
VIX = 16.1
Short-term Trading Call: neutral
Commentary
Starting in November or so, I developed an expectation for a January sell-off based in anticipation of earnings warnings and poor earnings reports. I expected slowing global growth, trade tensions, and tightening monetary conditions to help weigh the market down. Looking back with hindsight, the market looks like it rushed to discount all the potential headwinds in December’s historic sell-off. Even the major earnings warning from Apple (AAPL) that seemed to confirm the fears for January turned out to be a climax rather than a fresh spark.
I skipped over November and December as potential sources of the expected selling because these are seasonally benign, even bullish, months. Average maximum drawdowns for these months are historically the lowest of the year. Fortunately, I have AT40 (T2108), the percentage of stocks trading above their respective 40-day moving averages (DMAs), to help me effectively respond to changing market conditions and sometimes even anticipate these changes.
Last week I updated my data and analysis of AT40 and was pleasantly surprised to find that the S&P 500 (SPY) still performed roughly as expected given the various lengths of the oversold periods. The affirmations provide important guideposts for future trading extremes.
The stock market is at another extreme. AT40 is above the 70% threshold that defines overbought trading conditions. AT40 has even traded above 80% for three days. On average, the 80% overperiod lasts 5.5 days; the median is 2 days. My short-term trading call is neutral thanks to the 1-day overbought period that preceded the current overbought period. That episode flipped me from bullish to neutral. Key (and obvious) support levels kept me from going all the way to bearish. I am staying at neutral to avoid churn in the trading call; flipping bullish going into overbought is also too contrary/counter-intuitive.
Overall, the average overbought period lasts for 8.1 days with the median at 4 trading days. After 23 days, the performance of the S&P 500 improves almost linearly. In other words, this is a good time to anticipate the end of the overbought period, but it is too early to get bearish. I will go bearish if/when AT40 next drops from overbought conditions.
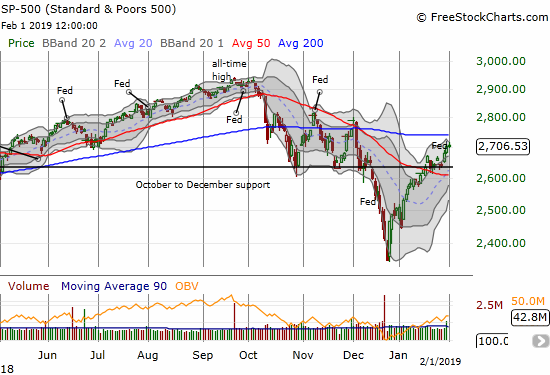
The S&P 500 (SPY) found new energy from a friendly Federal Reserve. Its 200DMA looms overhead as stiff resistance. It looks like a perfectly timed collision could happen just as the historic data says an overbought period should be coming to an end.
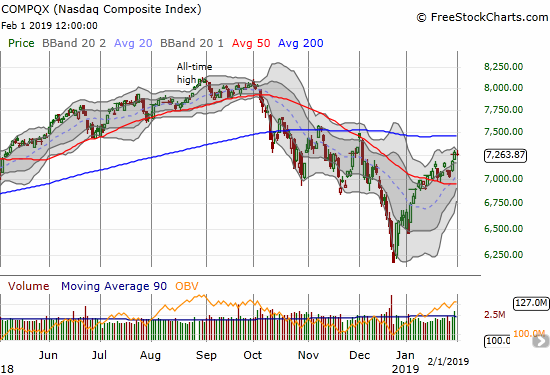
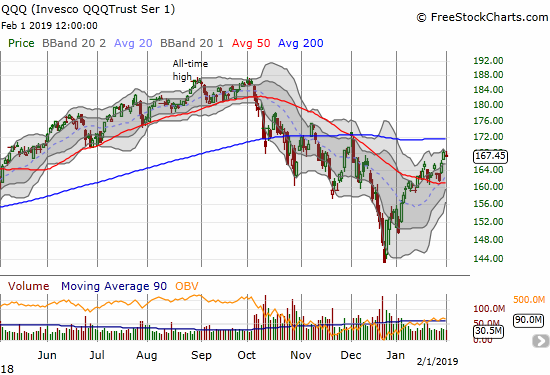
The NASDAQ and the Invesco QQQ Trust (QQQ) experienced small setbacks on Friday as big-cap giants stumbled a bit after reporting earnings.
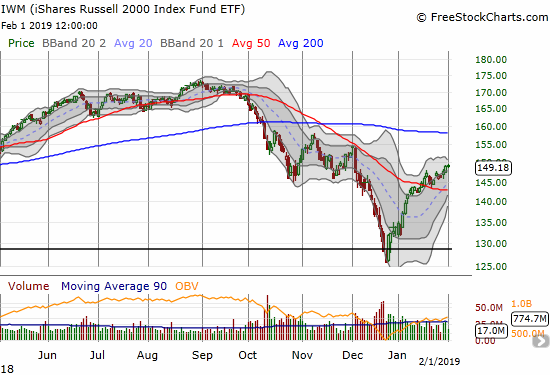
The iShares Russell 2000 ETF (IWM) slowed down relative to the recent fresh surges in the S&P 500 and the NASDAQ, but small-caps also have a lot more headroom to 200DMA resistance.
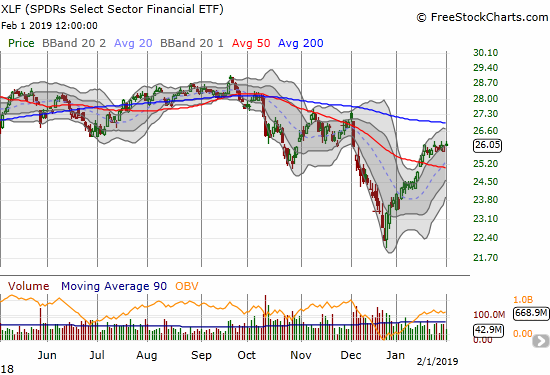
Financials have slowed down even more than IWM. Upward momentum has all but disappeared. I strongly suspect a test of 50DMA support is around the corner if the Financial Select Sector SPDR ETF (XLF) cannot regain some upward momentum in the coming week.
The volatility index, the VIX, is finally back to the floor that has provided support ever since the October breakout. If volatility makes a comeback, THIS is the perfect time for it to happen…and just in time to help bring an end to the overbought period. However, if the VIX continues downward through the 15.35 pivot, then I will interpret such a move to confirm the onset of an extended overbought trading period. I am long volatility as a hedge; otherwise, I would have been short in anticipation of the Fed’s official capitulation on its hawkishness.
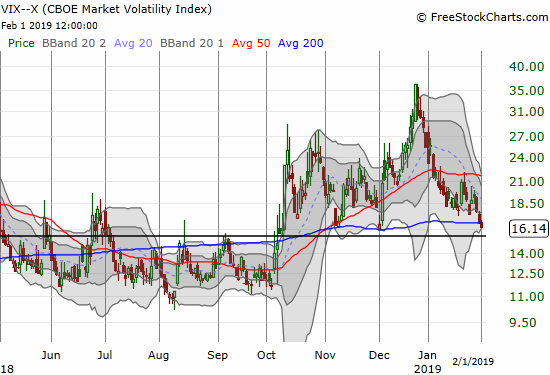
CHART REVIEWS
Apple (AAPL)
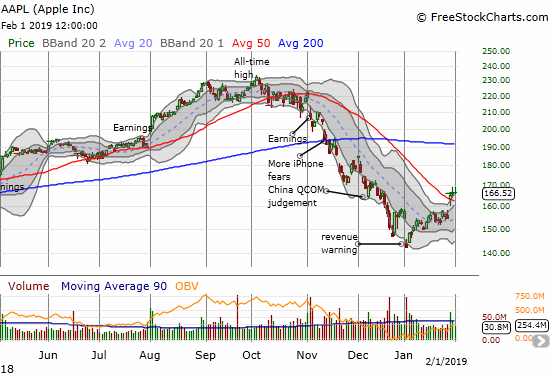
What earnings warning? AAPL reversed its post-warning gap ahead of earnings. The gap up and 50DMA breakout confirmed that the earnings warning is officially ancient history. Much ado about nothing perhaps? I did not buy my weekly dose of call options, but AAPL is clearly a buy on the dips from here until/unless it dives below 50DMA support.
Autozone (AZO)
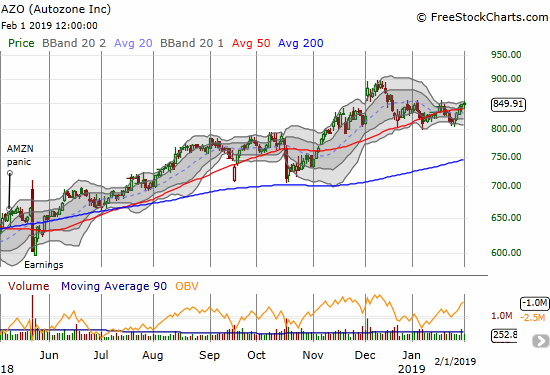
AZO did not benefit from January’s big rally, but the stock also proved very resilient in the sell-offs. The Amazon Panic from last summer is a distant memory, and the stock is just off its all-time high.
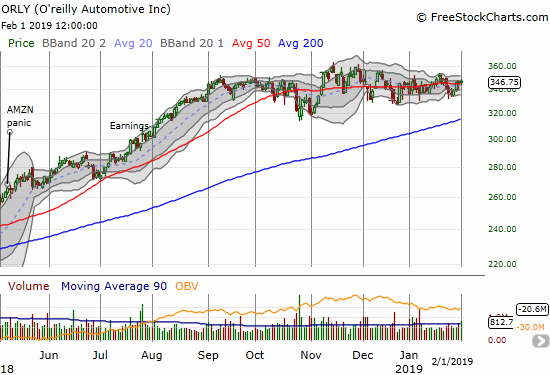
O’reilly Automotive (ORLY)
ORLY also failed to benefit from January’s rally. The stock essentially slept through all the market turmoil of the past several months. I am looking to buy into the next breakout from this firming consolidation pattern.
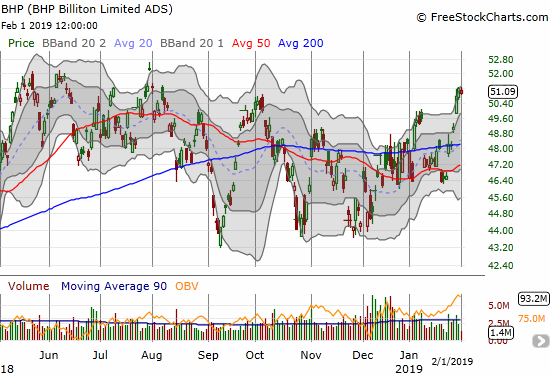
BHP Billiton Limited (BHP)
A weakening U.S. dollar (DXY) and a capitulating Federal Reserve provided fresh boosts to commodity plays. I have another pairs trade long BHP and short Rio Tinto (RIO). I am holding off from taking profits on BHP to see whether THIS time, BHP can break above its extended trading range. I will have a quick trigger in the coming week if it looks like the trading range will hold once again.
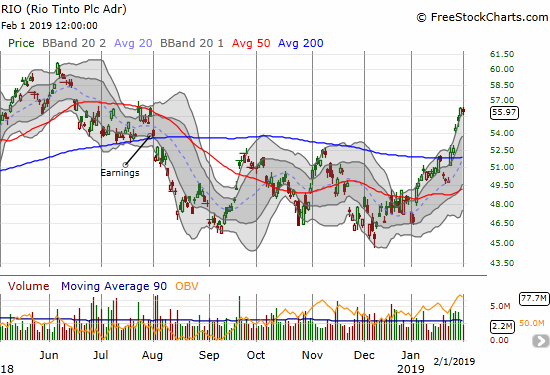
Rio Tinto (RIO)
RIO has benefited just like BHP. The stock also has a lot more headroom than BHP. I will flip my next pairs trade to go long RIO and short BHP after I take profits from the long BHP trade.
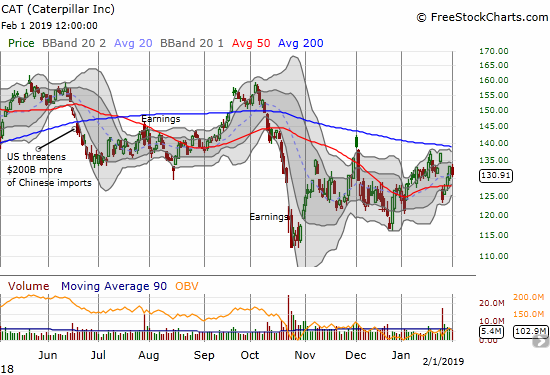
Caterpillar (CAT)
CAT was a core stock in my January post-earnings sell-off thesis. Even after it was clear that an oversold rally was firmly in place, I stuck to my guns on CAT. I used the stock as a hedge and next played earnings from the bearish side. I chose a different structure with a calendar put spread at $130 and outright puts at $127. The calendar spread reflected my deference to the bullish mood of the market. The outright puts reflected my base case for a large post-earnings drawdown. Surprisingly, I was able to profit from BOTH positions. CAT gapped down hard and even closed below its 50DMA and allowed me to take substantial profits on my outright puts. CAT’s immediate rebound to and past $130 allowed me to take profits on the calendar put spread.
CAT has yet to fill its post-earnings gap down, but it seems the benign trading environment will help push it to a test of 200DMA resistance. I will go back to buying CAT puts at that point. If the overbought period ends before that test, CAT will be one of the first stocks on my list to short (with puts).
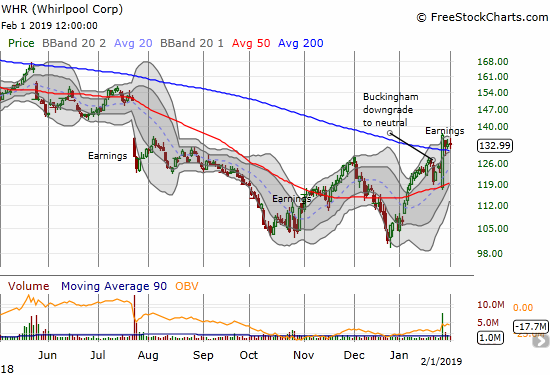
Whirlpool (WHR)
After the success with CAT, I honed in on other industrial/manufacturing stocks with high dependencies on the health of the global economy. I bought a put spread on WHR and sold a put short below the put spread. For a brief moment at the post-earnings open, I celebrated. I realized far too late that buyers were chomping at the bit to load up on the dip. Even after the stock finished reversing the gap, I did not consider a scenario of a gain on the day much less a 9.7% post-earnings gain! The next day, an analyst downgrade knocked the stock back down, and I promptly bought shares at the 200DMA. I flipped those shares for a profit the next day.
I am currently reading through the transcript from the earnings call. I now realize that the earnings were not nearly as bad as headlines suggested; there is even reason for optimism. Now that I understand better the real backdrop, I am looking to buy shares whether that’s on a new post-earnings high and/or a test of 50DMA support. For now, I am holding a single call option. Needless to say, I brought a quick end to my pre-earnings plays on the “global weakness” theme. For now, it seems the market is in the mood to buy the bad news in anticipation of more accommodative central banks.
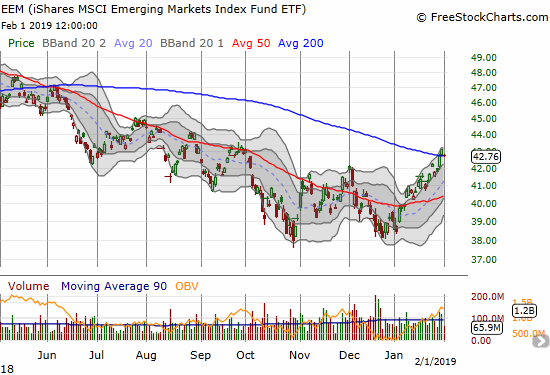
iShares MSCI Emerging Markets ETF (EEM)
EEM summarizes the market’s growing comfort buying into the global economic slowdown. EEM broke through 200DMA resistance for the first time since a brief spell last June. I loaded up on call options on Friday’s immediate test of 200DMA as support. I expect EEM to suffer mightily if the overbought period ends but to extend its run alongside the U.S. market if overbought trading conditions persist. If another steep sell-off unfolds, I will be watching for 50DMA support and then support from the October/December double-bottom.
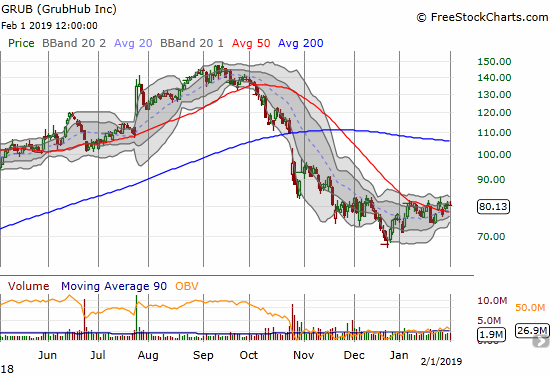
GrubHub (GRUB)
GRUB bounced off the December lows like the rest of the market, but it remains well off its all-time high set in September. The stock spent much of January consolidating. I am very interested in the post-earnings reaction on February 7th. GRUB is a very expensive stock in an increasingly competitive food-delivery industry: trailing P/E 53.5, forward P/E 41.7, price/sales 7.9, price/book 5.1. The potential explosiveness comes from a year-over-year earnings growth rate of 75% in the previous quarter and short-interest 14.6% of float.
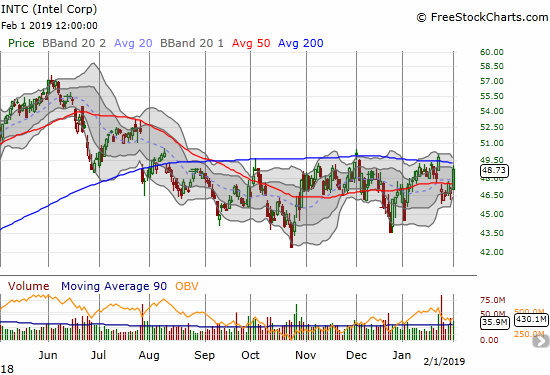
Intel (INTC)
So far, so good on my last between earnings trade on INTC call options. The company announced a new CEO and the stock market responded favorably (belatedly it seems). I decided to wait on taking profits to see whether INTC could make a run at breaking 200DMA resistance. There is tremendous upside from there and just one line of potentially stiff resistance around $52.50, the July pre-earnings peak. I will take profits at the first sign of softness and prepare for the next round.
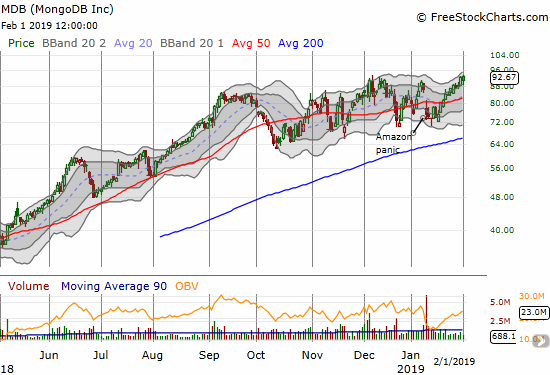
MongoDB (MDB)
MDB is a case of right direction, wrong trade structure. As I expected, MDB left its moment of Amazon Panic behind. However, the speed of the move caught me by surprise and left me flat-footed with a calendar call spread anchored at the $75 strike. I let the short side execute and since then have rolled through call options against the shares short. I will presumably come out net positive after covering the short on the next pullback.
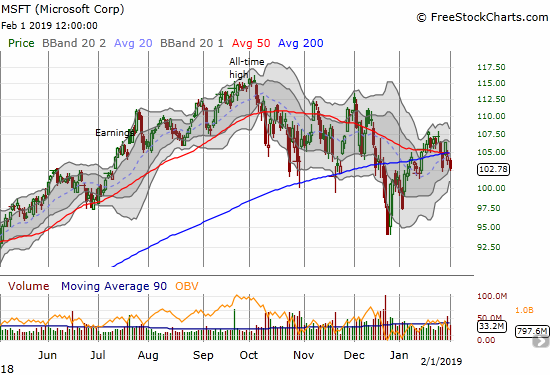
Microsoft (MSFT)
Post-earnings, MSFT gapped down and closed below converged support at its 50 and 200DMAs. The mild selling continued on Friday. Overall, MSFT looks like it is setting up for a deeper drawdown, perhaps as far as the January low.
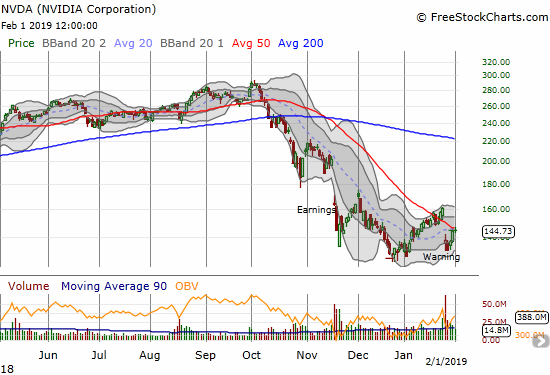
Nvidia (NVDA)
While NVDA has already warned, its upcoming earnings after market February 14th should be highly anticipated given the turn-around in the likes of AAPL. The stock has taken a severe beating and traders will start wondering whether all the negativity is already “priced in.” NVDA made an early move with a jump back to 50DMA resistance to close the week.
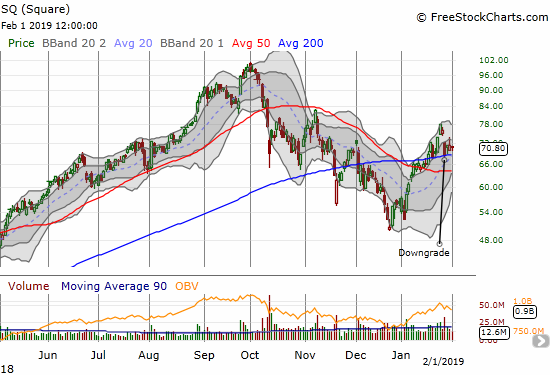
Square (SQ)
I got the pullback I wanted to get back into SQ. An analyst downgrade shoved SQ off its perch and back to 200DMA support. So far that support is holding.
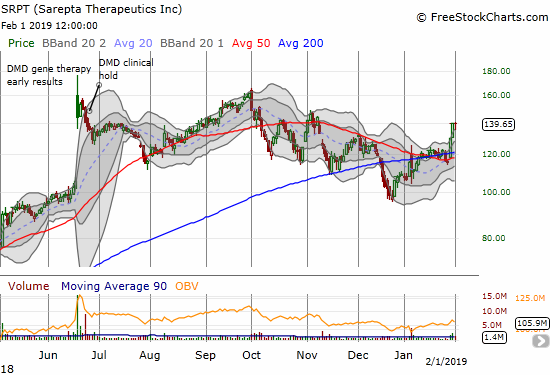
Sarepta (SRPT)
SRPT is a wild stock. It gyrates wildly and widely on headlines of drug trials and the like. Sometimes the stock sets up great options trades. The stock got my attention last week after an analyst upgrade and $200 price target sent the stock soaring through its 200DMA pivot and off 50DMA support. The buying continued the next day. I am looking to buy a small amount of shares to sit on for the long-term.
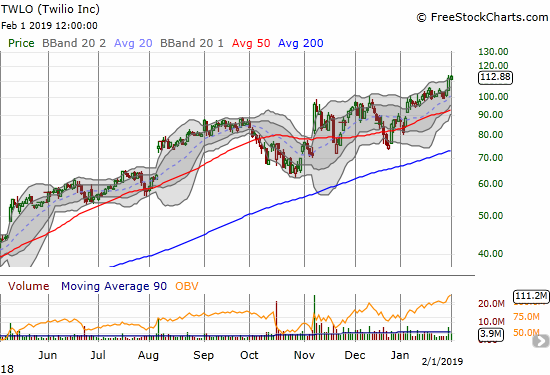
Twilio (TWLO)
TWLO broke out to new all-time highs. The path from $100 to here was so subtle and slow I neglected to put a fresh position in place ahead of this latest bullish move.
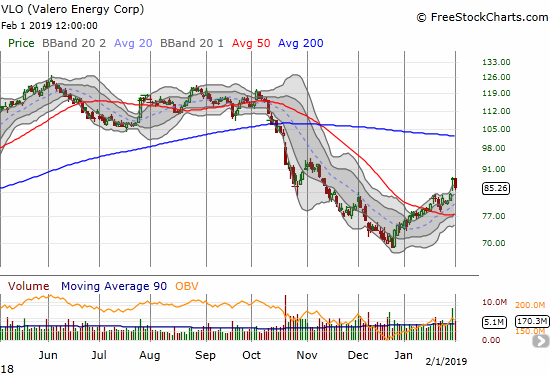
Valero (VLO)
VLO earnings delivered for me with a fresh breakout for the refiner. Support at the 50DMA looks well intact now. Sellers returned on Friday but hopefully the entire gap up will not reverse.
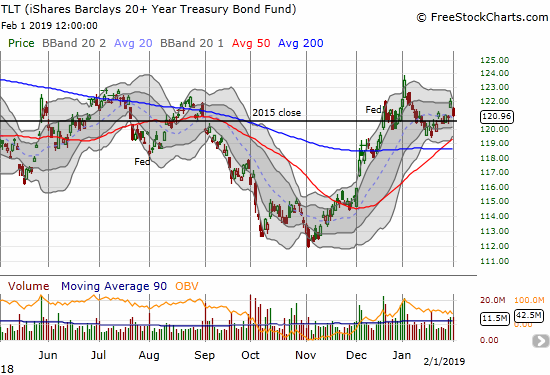
iShares 20+ Year Treasury Bond ETF (TLT)
TLT did not respond immediately to the Fed’s capitulation but gapped higher the next day. TLT almost filled the gap in the wake of the report on January jobs. I suspect TLT will just churn directionless for weeks on end as the forces of a dovish Fed and alternating headlines on slowing global growth and a strong/resilient U.S. economy unfold.
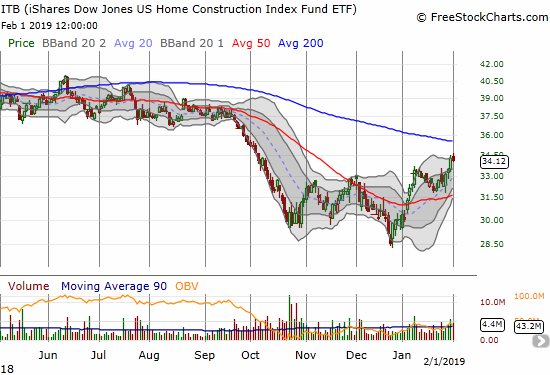
The iShares US Home Construction ETF (ITB)
The interest rate environment will likely be the main driver for the housing market in the near-term. With the Fed out of the way, traders and investors are now free to bet on a recovery in the shares of home builders and some stabilization in the housing data. Accordingly, the rally in ITB resumed last week. I am glad I did not shut down the seasonal trade altogether and even doubled down on ITB call options!
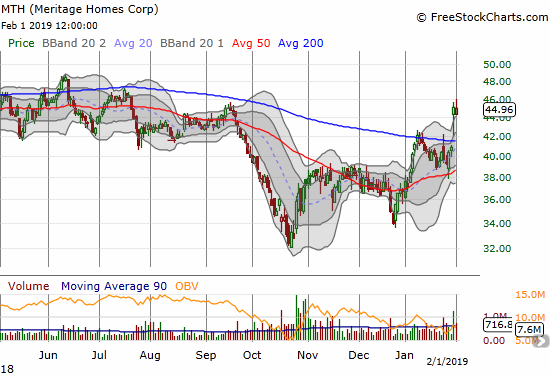
Meritage Homes (MTH)
MTH is one of several home builders benefiting from the quick change in sentiment for the housing market. The stock soared 10.1% on Thursday post-earnings. MTH is now a clear buy on the dips all the way to 200DMA support.
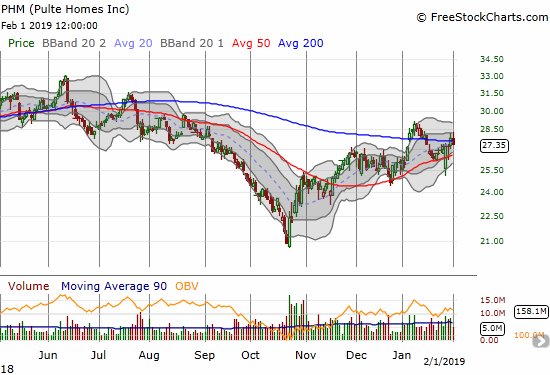
Pulte Homes (PHM)
PHM reported ahead of the Fed. Buyers still stepped in and immediately saved the stock from a post-earnings gap down below 50DMA support. Sellers returned on Wednesday for another try in the hours ahead of the Fed. This time I jumped at the chance to load up on call options. The rebound was so sharp after the Fed, I went ahead and took profits near the close of trading. PHM closed the week pivoting around 200DMA resistance.
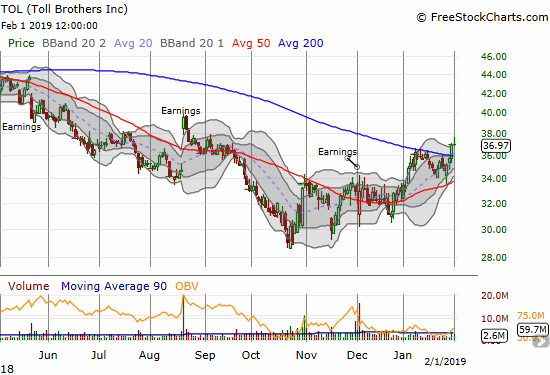
Toll Brothers (TOL)
TOL did not need earnings to break out above 200DMA resistance. I am a bit surprised at this bullish move since higher-end homes have suffered the most in the current housing market slowdown according to the aggregate data. TOL is a buy here, but I am very cautiously anticipating earnings on February 26th.
— – —
FOLLOW Dr. Duru’s commentary on financial markets via email, StockTwits, Twitter, and even Instagram!
“Above the 40” uses the percentage of stocks trading above their respective 40-day moving averages (DMAs) to assess the technical health of the stock market and to identify extremes in market sentiment that are likely to reverse. Abbreviated as AT40, Above the 40 is an alternative label for “T2108” which was created by Worden. Learn more about T2108 on my T2108 Resource Page. AT200, or T2107, measures the percentage of stocks trading above their respective 200DMAs.
Active AT40 (T2108) periods: Day #20 over 20%, Day #18 over 30%, Day #17 over 40%, Day #16 over 50%, Day #12 over 60%, Day #6 over 70%, Day #3 over 80% (overperiod)
Daily AT40 (T2108)
")
Black line: AT40 (T2108) (% measured on the right)
Red line: Overbought threshold (70%); Blue line: Oversold threshold (20%)
Weekly AT40 (T2108)

*All charts created using freestockcharts.com unless otherwise stated
The T2108 charts above are my LATEST updates independent of the date of this given AT40 post. For my latest AT40 post click here.
Related links:
The AT40 (T2108) Resource Page
You can follow real-time T2108 commentary on twitter using the #T2108 or #AT40 hashtags. T2108-related trades and other trades are occasionally posted on twitter using the #120trade hashtag.
Be careful out there!
Full disclosure: long UVXY calls, long ITB calls, long BHP calls, long RIO puts, long INTC calls, short MDB and long MDB call, long SQ calls, long WHR call
*Charting notes: FreeStockCharts.com stock prices are not adjusted for dividends. TradingView.com charts for currencies use Tokyo time as the start of the forex trading day. FreeStockCharts.com currency charts are based on Eastern U.S. time to define the trading day.