
AT40 = 11.9% of stocks are trading above their respective 40-day moving averages (DMAs) (oversold day #12)
AT200 = 12.4% of stocks are trading above their respective 200DMAs
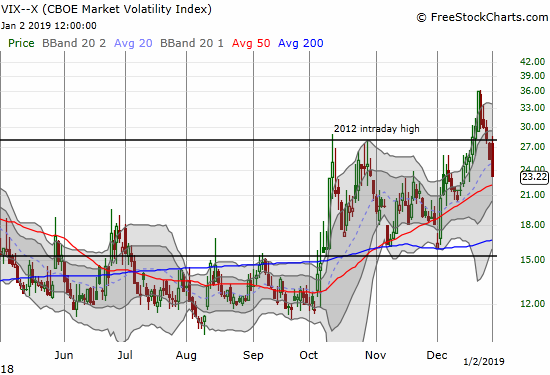
VIX = 23.2
Short-term Trading Call: bullish (with caveats all over again)
Commentary
$AUDJPY $AUDUSD $GBPJPY flash crashed. Could this ALL be #forex fallout from $AAPL revenue warning!?! pic.twitter.com/WZS10wj7D9
— Dr. Duru (@DrDuru) January 2, 2019
After some much appreciated relative calm, financial markets went right back to wild gyrations. The year 2019 started with poor economic news from China, a gap down in U.S. stocks, a spirited and bullish rally from the bottom, a serious revenue warning from Apple (AAPL), and then a flash crash in currency markets with the Japanese yen (FXY) surging and the Australian dollar (FXA) plunging.
The latest warning from China started back on December 30th when the country reported its worst Purchasing Managers’ Index (PMI) in almost three years. At 49.4, the PMI is back in contraction territory. Today, the Caixin Media and IHS Markit PMI confirmed the fall in the PMI by falling from 50.2 to 49.7. The Caixin was last this low May, 2017. In a risk-off move, the Australian dollar sold off and the yen strengthened. At the time of writing, a little over three hours after the U.S. markets closed for trading and less than an hour to go for Asian trading to begin, both currencies went into flash crash mode. The charts below are close-ups for capturing the (current) extent of the extremes. At the extreme intraday low both AUD/JPY and AUD/USD traded at prices last seen coming out of the throes of the financial crisis!
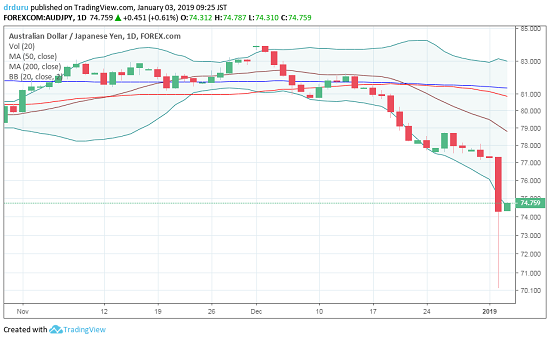
Source: TradingView.com
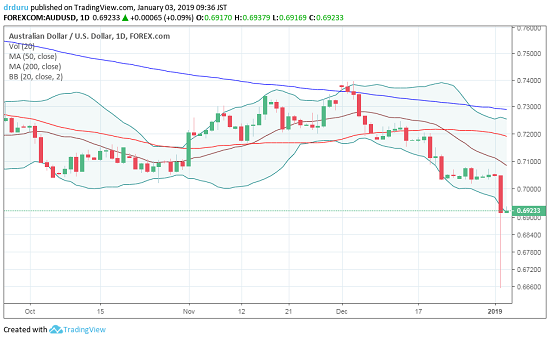
Source: TradingView.com
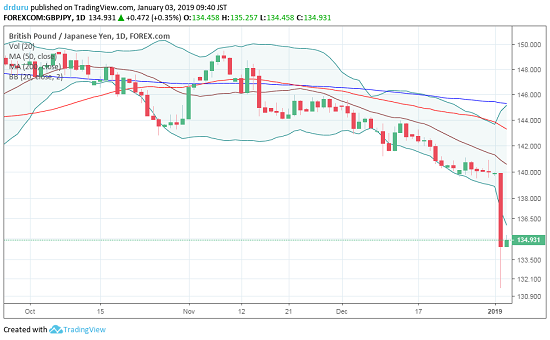
Source: TradingView.com
I still looking wistfully back on the bullish economic picture for Australia. The barrage in forex has riddled me with serious doubts. Per rule, I never sell in a panic (and the sharp rebound from the flash crash is a great reminder of why and how selling in a panic is a bad idea), but I am definitely looking to unload my long AUD/JPY position in the near future. I was VERY fortunate that just ahead of the flash crash, I shorted AUD/USD as it broke the 0.70 level. My downside price target though was 0.691, so I did not fully benefit from the big swoosh.
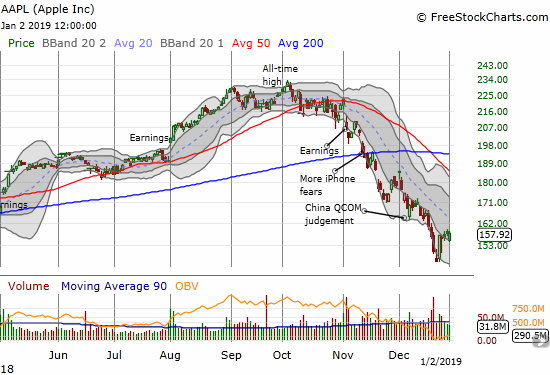
The drama in forex followed directly on the heels of a revenue warning from Apple (AAPL) which further underlined the deteriorating economic conditions in China. I cannot even remember the last time AAPL issued a revenue or earnings warning. This one was serious enough to warrant a release a full FOUR weeks ahead of earnings and an extended letter directly from Tim Cook to Apple investors. Some key quotes (emphasis mine):
“When we discussed our Q1 guidance with you about 60 days ago, we knew the first quarter would be impacted by both macroeconomic and Apple-specific factors. Based on our best estimates of how these would play out, we predicted that we would report slight revenue growth year-over-year for the quarter…
…we expected economic weakness in some emerging markets. This turned out to have a significantly greater impact than we had projected.
In addition, these and other factors resulted in fewer iPhone upgrades than we had anticipated.
These last two points have led us to reduce our revenue guidance…
While we anticipated some challenges in key emerging markets, we did not foresee the magnitude of the economic deceleration, particularly in Greater China. In fact, most of our revenue shortfall to our guidance, and over 100 percent of our year-over-year worldwide revenue decline, occurred in Greater China across iPhone, Mac and iPad.
China’s economy began to slow in the second half of 2018…We believe the economic environment in China has been further impacted by rising trade tensions with the United States. As the climate of mounting uncertainty weighed on financial markets, the effects appeared to reach consumers as well, with traffic to our retail stores and our channel partners in China declining as the quarter progressed. And market data has shown that the contraction in Greater China’s smartphone market has been particularly sharp.”
It seems the revenue/earnings warnings season has started as I feared it would in January but much earlier than I was guessing. I think AAPL’s warning is just the beginning. I have duly noted that China’s latest economic issues took AAPL by surprise. I am sure other companies with business in China are being taken by “surprise” as well. Next we will all be “surprised” by the ways in which China’s problems cascade out to the global economy, including the U.S.
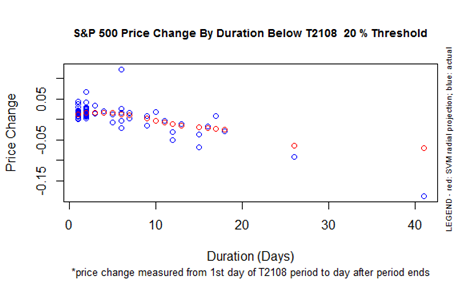
I absolutely hate feeling short-term bearish while the stock market is still in deep oversold territory. Yet, the trading action, and now the economic and financial data, point to an extended stay in bear market territory. The oversold period is on its 11th day. AT40 (T2108), the percentage of stocks trading above their respective 40-day moving averages (DMAs), struggled to get back to and stay in double digits the past two trading days. AT40 closed today at 11.9%. AT200 (T2107), the percentage of stocks trading above their respective 200-day moving averages (200DMAs), closed at 12.4%. It looks like “scenario three” is now unfolding with a historically long oversold period. Per the chart below, the oversold period has crossed an important threshold: from here, the longer this oversold period drags on the worse the S&P 500 will perform by the time the oversold period ends. The S&P 500 is now down 3.5% since it closed in oversold territory on December 14th.
My short-term trading call stays at bullish in anticipation of an eventual end of the oversold period. However the entry point for new positions becomes more critical. I also have ever more subdued upside expectations for short-term trades. Going forward, I will only buy on “large” spikes in the volatility index, the VIX, and/or plunges well below lower Bollinger Bands (BBs). Such moves are extremes within an extreme oversold period – a “second derivative” buying opportunity. Perhaps to the upside, government action from China and/or the U.S. will trigger a buying opportunity (most likely from monetary policy and NOT trade policies).
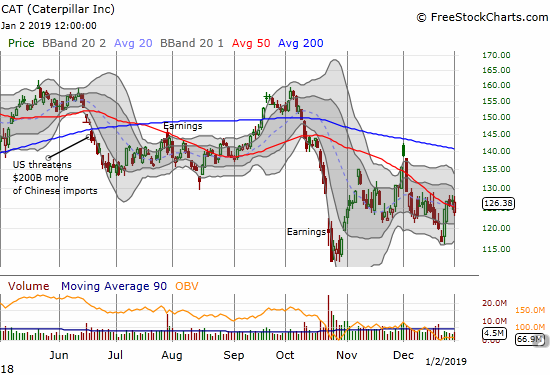
In the meantime, I will be more active again with hedges. For example, I loaded up on fresh put options on Caterpillar (CAT) after it managed to reverse its loss for the day. CAT is a year from the big earnings warning that helped swipe the stock off its 2018 highs. I fully expect another bad news January for CAT given the macro-economic environment, and AAPL’s confirmation of weakness in China. (CAT chart listed under the section on Chart Reviews).
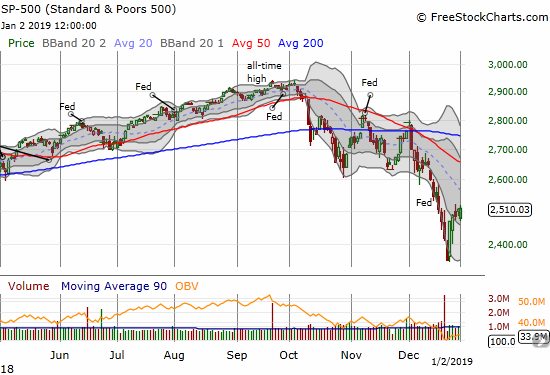
One of the reasons I hedged with CAT is that the S&P 500 was so sluggish on the day. I added to my SPY call options on the morning gap down, but the intraday rally barely made a dent to the upside. The behavior was suspicious. Now, it looks like the recent intraday highs will stand as firm resistance for a while.
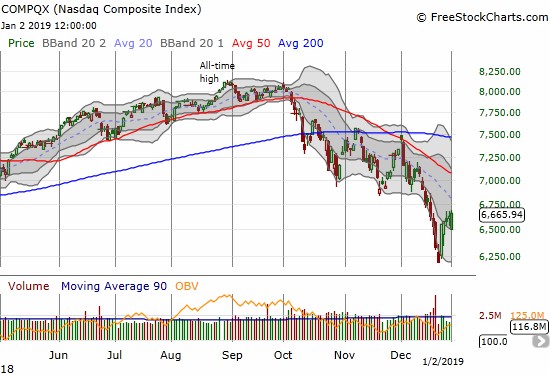
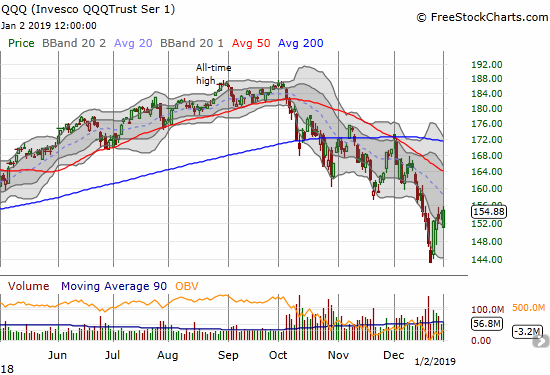
Like the the S&P 500, the NASDAQ and the Invesco QQQ Trust (QQQ) battled back from significant down gaps. The tech-laden indices both notched gains of 0.4%. They also stopped short at recent intraday highs.
The net impact on the volatility index, the VIX, was a drop of 8.7%. Before the after hours drama, I looked at this chart and concluded that it confirmed a top in volatility for this cycle. It looked very bullish.
CNBC’s Fast Money’s technician Carter Worth went to the board to remind the audience that the current sell-off is still a relative blip compared to the past two major trend breaks of recent times. It was an ominous lesson; a lesson reminiscent of the worst extremes I explored using the 200DMA Signal. Worth also covered gold; it looks like it will soon have a major breakout to the upside.
Futures indicating a lower open Thursday. Chart Master Carter Worth reveals the key levels to watch on the S&P 500. pic.twitter.com/ZIda3bGq0s
— CNBC’s Fast Money (@CNBCFastMoney) January 2, 2019
CHART REVIEWS
Caterpillar (CAT)
I am watching CAT more closely than ever. The stock has ominously failed around the same levels for the last three trading days. Even though the closes have been above the 50DMA, I have added puts as hedges to my bullish short-term trading call.
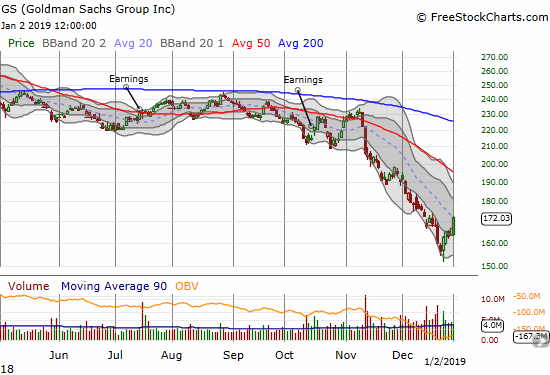
Goldman Sachs (GS)
GS had a surprisingly strong day. If this were the only stock I saw, I would have assumed the major stock indices had another one of those out-sized gains. The sell-off in GS is so steep that this test of downtrending 20DMA resistance is the first such test since GS broke down below this trend line in the first half of November. It looks like a confirmation of a bottom, so I am very interested to see what happens in the coming days.
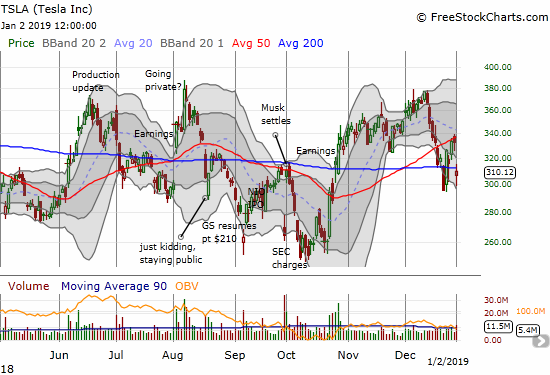
Tesla (TSLA)
TSLA delivered its own bad news. The entire release actually read like great news like “Q4 deliveries grew to 90,700 vehicles, which was 8% more than our prior all time-high in Q3.” Yet, it appears the deliveries missed “expectations.” TSLA also announced price cuts to accommodate the loss of government subsidies. I am honestly surprised the stock fell at all given the loss of subsidies is old news, and the market seemed to buy into past delivery misses.
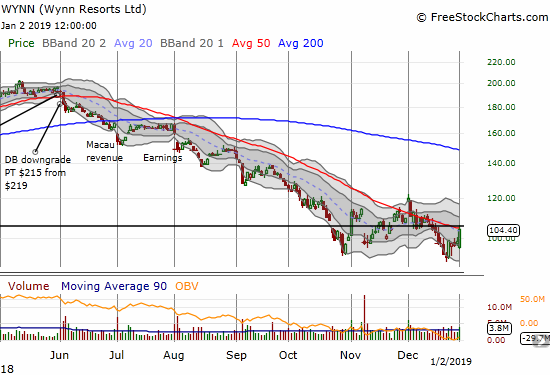
Wynn Resorts (WYNN)
WYNN was another stock which filled me with optimism for the day. Even though the stock could not close above its downtrending 50DMA, the price action looked good. The follow-through I wanted to see is not likely coming now.
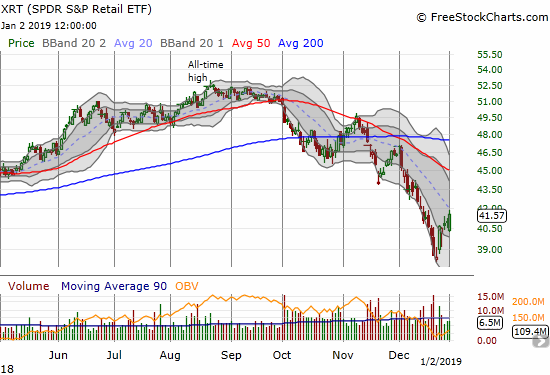
SPDR S&P Retail ETF (XRT)
XRT was yet another place where I saw signs of optimism. The rebound was so strong that XRT formed a bullish engulfing pattern. Before the after hours drama, I was looking for a breakout above 20DMA resistance. Now, I am looking to short a retailer or two; Best Buy (BBY) seems like a clear target…
— – —
FOLLOW Dr. Duru’s commentary on financial markets via email, StockTwits, Twitter, and even Instagram!
“Above the 40” uses the percentage of stocks trading above their respective 40-day moving averages (DMAs) to assess the technical health of the stock market and to identify extremes in market sentiment that are likely to reverse. Abbreviated as AT40, Above the 40 is an alternative label for “T2108” which was created by Worden. Learn more about T2108 on my T2108 Resource Page. AT200, or T2107, measures the percentage of stocks trading above their respective 200DMAs.
Active AT40 (T2108) periods: Day #12 under 20% (12th oversold day), Day #17 under 30%, Day #19 under 40%, Day #69 under 50%, Day #85 under 60%, Day #140 under 70% {corrected 1/6/19}
Daily AT40 (T2108)
")
Black line: AT40 (T2108) (% measured on the right)
Red line: Overbought threshold (70%); Blue line: Oversold threshold (20%)
Weekly AT40 (T2108)

*All charts created using freestockcharts.com unless otherwise stated
The T2108 charts above are my LATEST updates independent of the date of this given AT40 post. For my latest AT40 post click here.
Related links:
The AT40 (T2108) Resource Page
You can follow real-time T2108 commentary on twitter using the #T2108 or #AT40 hashtags. T2108-related trades and other trades are occasionally posted on twitter using the #120trade hashtag.
Be careful out there!
Full disclosure: long SSO, long SPY calls, long AAPL shares and calls, long CAT puts, long GS puts, long WYNN calls, long UVXY put, long GLD, long AUD/JPY, short GBP/JPY
*Charting notes: FreeStockCharts.com stock prices are not adjusted for dividends. TradingView.com charts for currencies use Tokyo time as the start of the forex trading day. FreeStockCharts.com currency charts are based on Eastern U.S. time to define the trading day.