
AT40 = 84.7% of stocks are trading above their respective 40-day moving averages (DMAs) (9th overbought day)
AT200 = 37.1% of stocks are trading above their respective 200DMAs (3-month high)
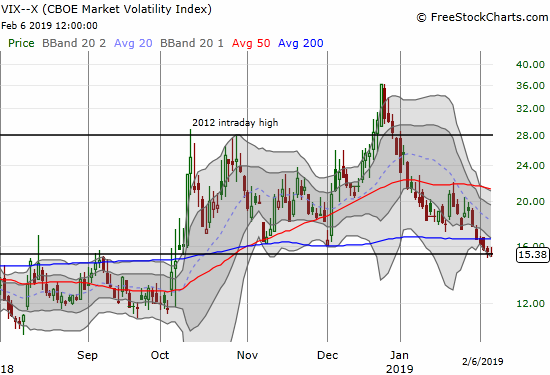
VIX = 15.4
Short-term Trading Call: neutral
Commentary
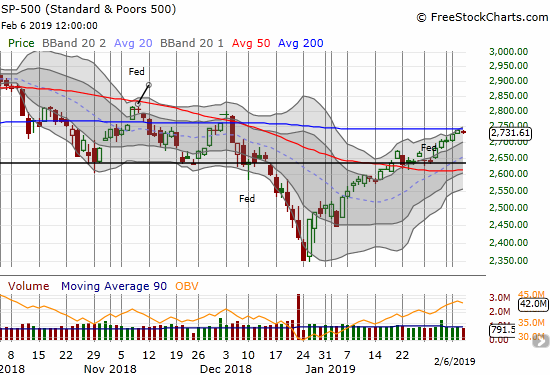
In my last Above the 40 post, I described the contours of this overbought market in the context of the historic oversold period that preceded it. I noted that resistance from the 200-day moving averages (DMAs) loomed as a major test of what is now an extended overbought period lasting 9 trading days. The S&P 500 (SPY) crept right up 200DMA resistance and stopped cold on Tuesday. Today, the index lingered, tantalizingly, just below resistance.
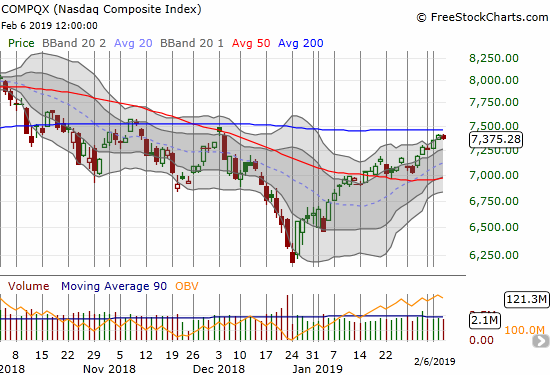
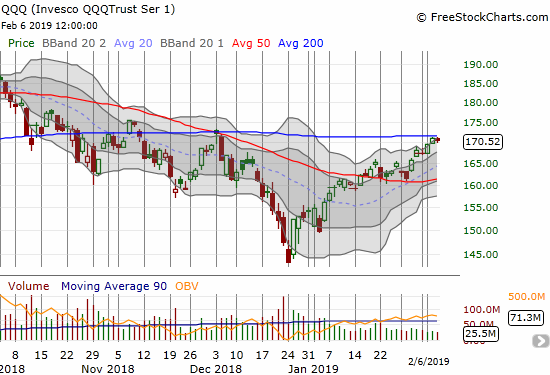
The NASDAQ has yet to test 200DMA resistance while the Invesco QQQ Trust (QQQ) is lingering just below its 200DMA resistance. The small difference in performance has a lot to do with the big-cap tech stocks that are suddenly back in vogue with a vengeance.
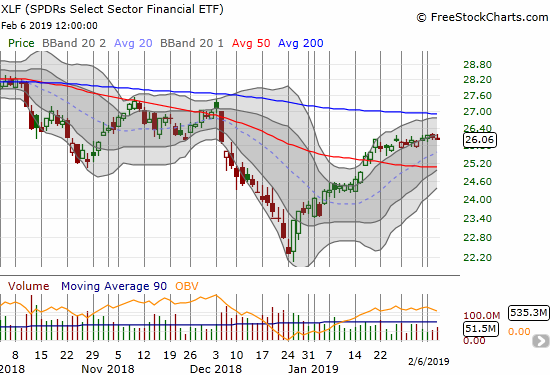
While the above indices have not technically lost momentum given they are still following along their upper Bollinger Bands (BBs), financials HAVE lost momentum. The Financial Select Sector SPDR ETF (XLF) now looks like it will test 50DMA support before it tests 200DMA resistance.
As the stock market grinds along, the volatility index, the VIX, continues lower. The days of big up and down moves and panicked selling already seem like a distant memory. The VIX now clings to its 15.35 pivot.
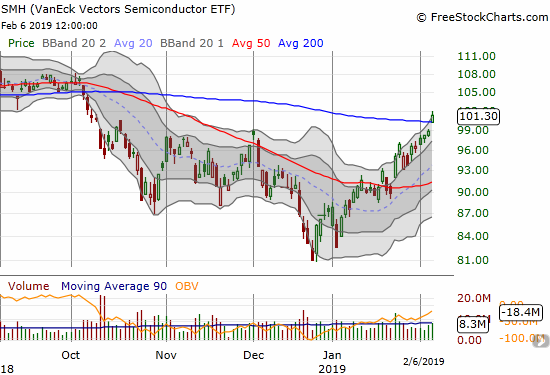
Just like 50DMAs were “obvious” support levels in late January, 200DMAs are providing “obvious” resistance. In fact, I call this juncture “convenient” because it coincides so neatly with an extended overbought period. As a reminder, the average overbought period lasts for 8.1 days with the median at 4 trading days. I am very tempted to flip my trading call from neutral to cautiously bearish to try to get ahead of what should be some kind of pullback. Moreover, the S&P 500 is up 2.5% so far in this overbought period which is well ahead of pace. Historically, the overbought period needs to last at least 20 days or so to deliver a 2.5% gain at its end. However, I must defer to the buyers and resist the temptation to get ahead of the confirmed bearish signal of the overbought period coming to an end. If semiconductors are any sign, the market’s general bullishness is far from over. The Semiconductor Hldrs ETF (SMH) gained 2.5% on a bullish 200DMA breakout. SMH now looks it could complete a reversal of all its losses from the October breakdown.
In the meantime, I decided to take on one new short (see below), reload on put options on Caterpillar (CAT), and get ready to buy more ProShares Ultra VIX Short-Term (UVXY) call options after the last tranche likely expires worthless this Friday. The last two positions are partial hedges against my remaining short-term long positions.
CHART REVIEWS
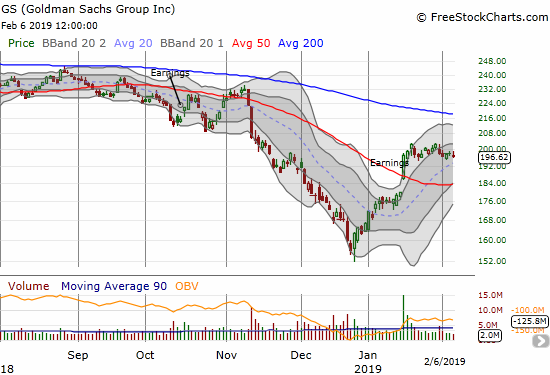
Goldman Sachs (GS)
While XLF trades listless, GS actually experienced a small dip over the past week. After the stock went down 1% today, I decided to short a few shares. I did not buy put options because of the strong possibility that the stock just continues to linger before making its next move. I will stop out on a fresh post-earnings high.
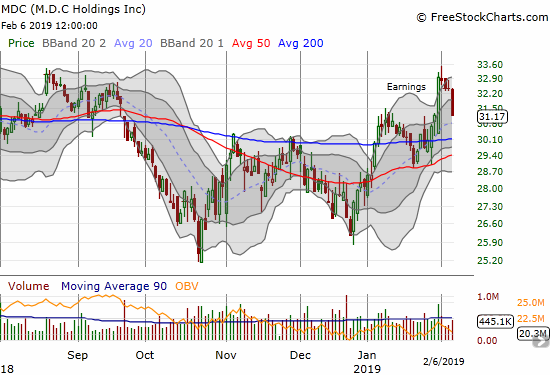
M.D.C. Holdings (MDC)
I continue to warily watch the trading action in home builders. MDC experienced a strong earnings move last week. The stock gained 5.6% after first gapping down. The fun came to an end on today’s 3.9% loss that rolled back all MDC’s post-earnings gains.
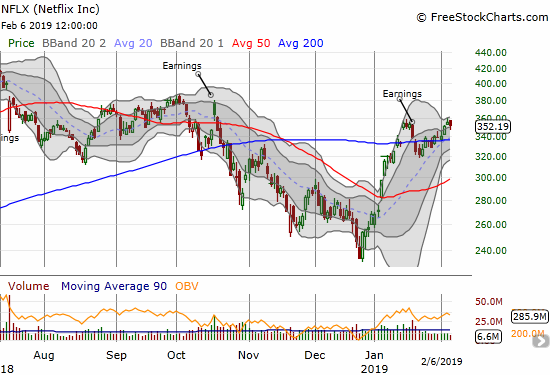
Netflix (NFLX)
This week NFLX finished reversing its post-earnings loss. I thought the post-earnings 200DMA breakdown would lead to a test of 50DMA support. I have left NFLX alone since it broke out again, but I return to puts on the next 200DMA breakdown.
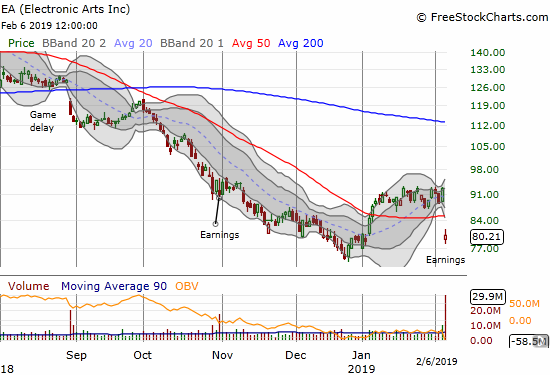
Electronic Arts (EA)
Last year I tried a pre-earnings trade in EA that ended poorly as the stock slid sharply into earnings. This time around I just watched. EA lost 13.3% post-earnings in a move that almost erased all the stock’s gains from the December 2-year low (which perfectly tested key support from December, 2016). I am watching the stock to see whether it can bounce off or near that level again. I like the stock as a play to rally at least back to 50DMA resistance if it manages to make a new post-earnings high. A break below December support will be very bearish for the stock.
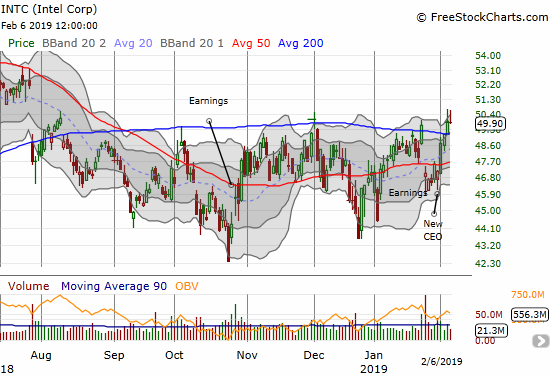
Intel (INTC)
I did well in deciding to hold my INTC calls into this week. The stock tested 200DMA resistance on Monday, and I held for one more day. I sold into Tuesday’s breakout. While the calls did not expire until March with a $48 strike, I figured the top of the current trading range is a good spot to secure profits during an overbought period for the stock market. I am a buyer on a dip back to 50DMA support.
— – —
FOLLOW Dr. Duru’s commentary on financial markets via email, StockTwits, Twitter, and even Instagram!
“Above the 40” uses the percentage of stocks trading above their respective 40-day moving averages (DMAs) to assess the technical health of the stock market and to identify extremes in market sentiment that are likely to reverse. Abbreviated as AT40, Above the 40 is an alternative label for “T2108” which was created by Worden. Learn more about T2108 on my T2108 Resource Page. AT200, or T2107, measures the percentage of stocks trading above their respective 200DMAs.
Active AT40 (T2108) periods: Day #23 over 20%, Day #21 over 30%, Day #20 over 40%, Day #19 over 50%, Day #15 over 60%, Day #9 over 70%, Day #6 over 80% (overperiod)
Daily AT40 (T2108)
")
Black line: AT40 (T2108) (% measured on the right)
Red line: Overbought threshold (70%); Blue line: Oversold threshold (20%)
Weekly AT40 (T2108)

*All charts created using freestockcharts.com unless otherwise stated
The T2108 charts above are my LATEST updates independent of the date of this given AT40 post. For my latest AT40 post click here.
Related links:
The AT40 (T2108) Resource Page
You can follow real-time T2108 commentary on twitter using the #T2108 or #AT40 hashtags. T2108-related trades and other trades are occasionally posted on twitter using the #120trade hashtag.
Be careful out there!
Full disclosure: long UVXY calls, short GS
*Charting notes: FreeStockCharts.com stock prices are not adjusted for dividends. TradingView.com charts for currencies use Tokyo time as the start of the forex trading day. FreeStockCharts.com currency charts are based on Eastern U.S. time to define the trading day.