
AT40 = 76.4% of stocks are trading above their respective 40-day moving averages (DMAs) (1st overbought day)
AT200 = 28.7% of stocks are trading above their respective 200DMAs (near 2-month high)
VIX = 17.4
Short-term Trading Call: neutral
Commentary
It was just a week ago when the stock market surged to overbought levels in a bullish move. AT40 (T2108), the percentage of stocks trading above their respective 40DMAs, closed at 76.3% above the 70% threshold for overbought. That overbought period lasted just a day as a test of support at 50-day moving averages (DMAs) proved irresistible to traders. Supports held, buyers ground prices higher, and the week ended overbought almost exactly where the market closed the prior week. AT40 jumped from 69.9% to 76.4%. AT200 (T2107), the percentage of stocks trading above their respective 200DMAs, provided a signal of progress for the stock market by closing at a (marginal) 7-week high.
Still, while 50DMA support held for the major indices, buyers still have a lot to prove ahead of an action-packed week of important earnings reports and another Federal Reserve announcement on monetary policy (January 30th). Overhead resistance still looms large.
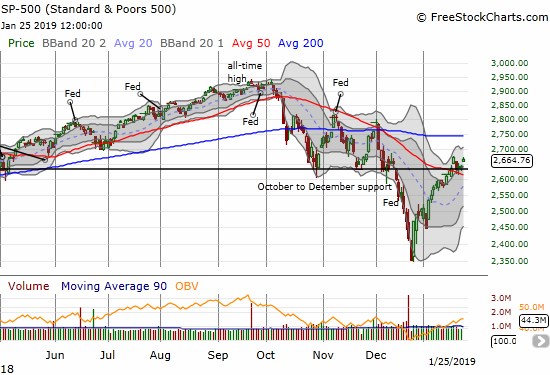
The S&P 500 (SPY) bounced from the October to December support and confirmed 50DMA support with a 0.9% gain. The index faded a bit from the high made the previous week. Moreover, 200DMA resistance looms large around the 2750 level.
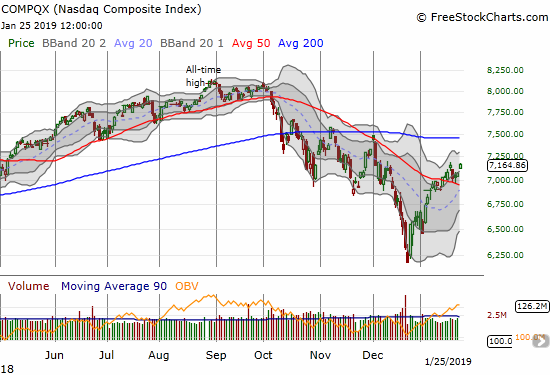
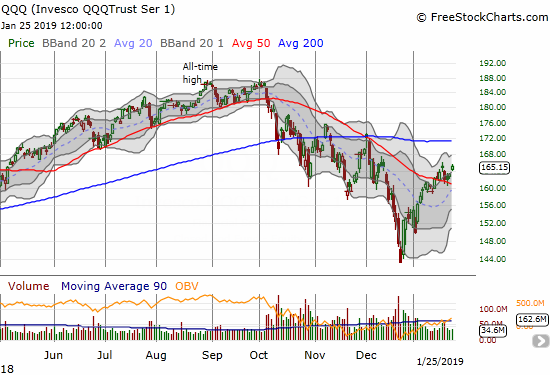
The NASDAQ and the Invesco QQQ Trust (QQQ) also confirmed 50DMA support with the NASDAQ making very marginal progress above the previous week’s closing high.
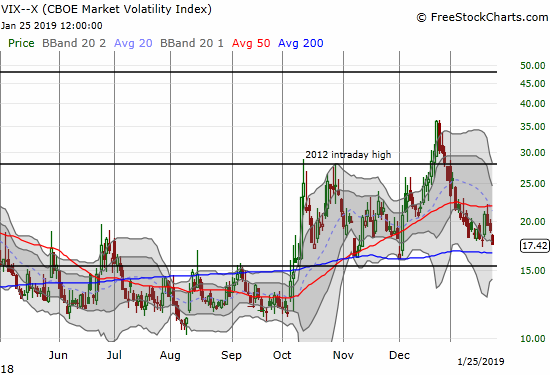
The week started with a surge in volatility. That momentum stopped cold as the volatility index, the VIX, dripped steadily lower. With volatility near support, I will go long volatility as a first hedge on playing the market for a presumed extended stay in overbought territory.
In my last Above the 40 post I called the technical setups on the indices “obvious.” I am still not ready to draw firm conclusions because of the immediate resistance the S&P 500 still needs to break. Even a new multi-week high faces a run-up capped by 200DMA resistance. When the stock market last surged into overbought territory, my short-term trading call was cautiously bullish. I gave a maximum run of three weeks (15 trading days) for an overbought trading period. My trading call is now neutral and stays at neutral, but I give another maximum run of three weeks to challenge overhead 200DMA resistance for the major indices. I will likely flip bearish the next time AT40 closes below the 70% threshold for overbought even if 50DMA supports are not yet broken at that time.
CHART REVIEWS
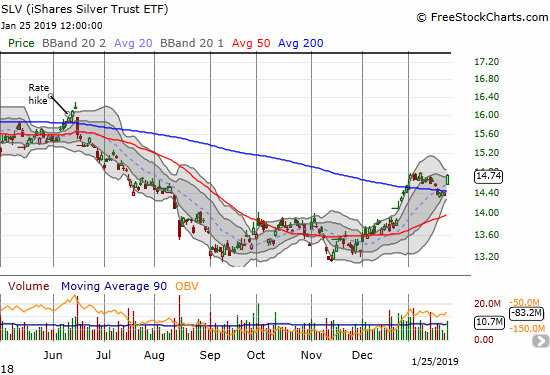
iShares Silver Trust (SLV)
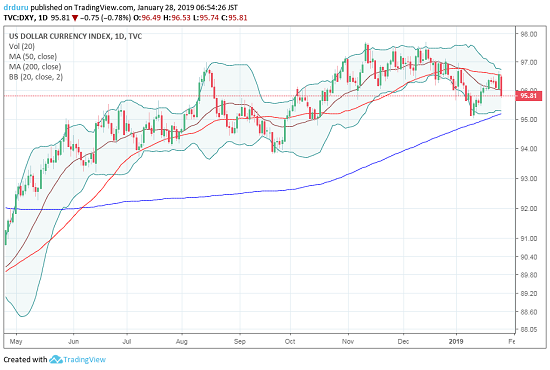
Thanks to headlines that the Federal Reserve is ready to consider ending its bond sales (quantitative tightening), the U.S. dollar took a deep dive. The Fed’s capitulation appears back on-track even if it is moving in slow-motion. Many dollar-sensitive trades reacted accordingly. The iShares Silver Trust (SLV) stopped hanging around its 200DMA and gapped higher for a 2.7% gain. SLV returned to its previous range of tight consolidation and is now on the verge of an upside resolution to a Bollinger Band (BB) squeeze. I will buy call options ahead of the Fed meeting in anticipation of continued momentum.
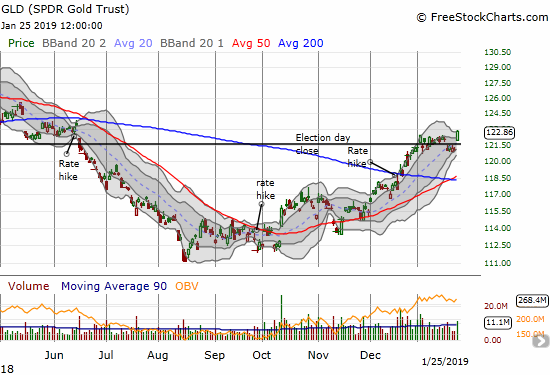
SPDR Gold Trust (GLD)
GLD did SLV one better with a breakout to a new 7-month high. Like SLV, I will be looking to buy call options to enhance my core position in shares.
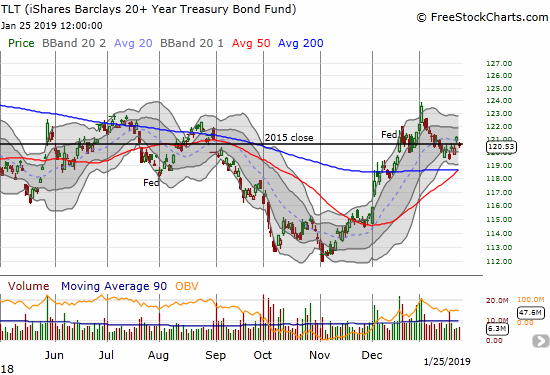
iShares 20+ Year Treasury Bond ETF (TLT)
Surprisingly, TLT followed the dollar lower. I am waiting for the results of the Fed meeting to decide how to play TLT again. Assuming the Fed will signal its official capitulation, I am preparing to go long TLT.
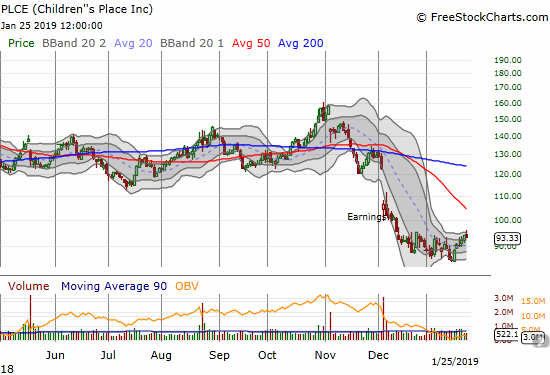
Children’s Place (PLCE)
In this post, I thought I was going to celebrate the long-awaited breakout for PLCE, but traders managed to push the stock back to a small loss on Friday. The short side of my calendar call spread expired a week ago, so now I am fully long in anticipation of a challenge of declining 50DMA resistance.
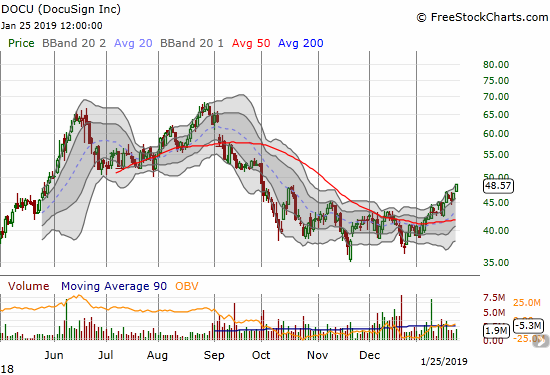
DocuSign (DOCU)
DOCU went IPO last year and broke into a sprint. One double-top later, and it declined into a 2+ month long consolidation period that was remarkably resilient to the market’s big correction. Now, DOCU is on a fresh sprint that has confirmed a 50DMA breakout. This stock is a buy on the dips, even starting with a small “no regrets” purchase right here in case the run-up simply continues.
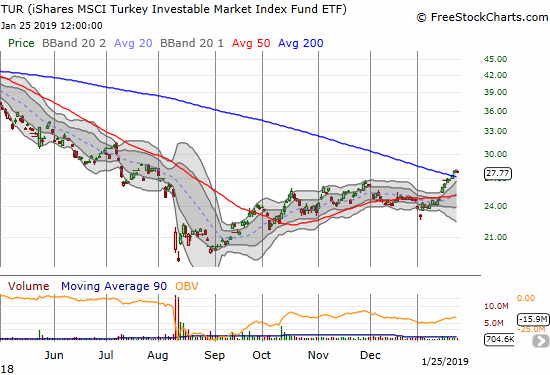
iShares MSCI Turkey ETF (TUR)
I took a pause to check out Turkish stocks and was startled to see the steady months-long recovery of TUR. TUR broke out above its 200DMA resistance last week. With the big gap down from August long ago filled, TUR is in a very bullish position here. I will buy into the next move higher from current levels.
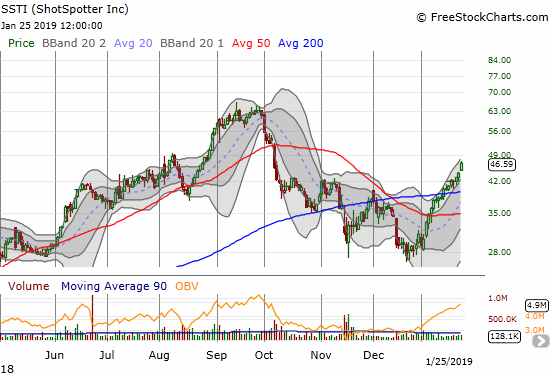
ShotSpotter (SSTI)
It was once very easy to be long SSTI. The October breakdown in the stock market took SSTI down hard despite continued good news from earnings. I added to my position into the selling until the 200DMA breakdown. SSTI is on the move again with its all-time high in sight once again.
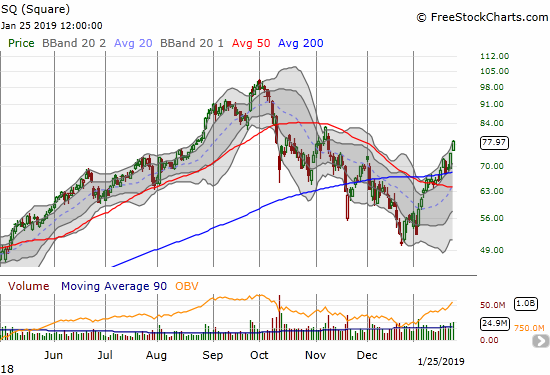
Square (SQ)
SQ was one of my longer-term holdings that I reluctantly let go after a 200DMA breakdown. SQ is an extremely expensive stock, so I did not want to fight against the large downside risks represented by a 200DMA breakdown. SQ is right back in bullish form with a definitive 200DMA breakout and confirmation. I like SQ as a short-term trade with buys on dips.
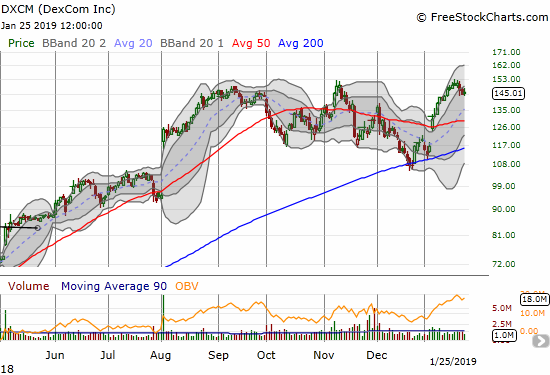
Dexcom (DXCM)
DXCM managed to make a new all-time high earlier this month. I am watching the stock like a hawk for an opportunity to buy on a successful test of 50DMA support. I should have gone long again on the 200DMA breakout earlier this month.
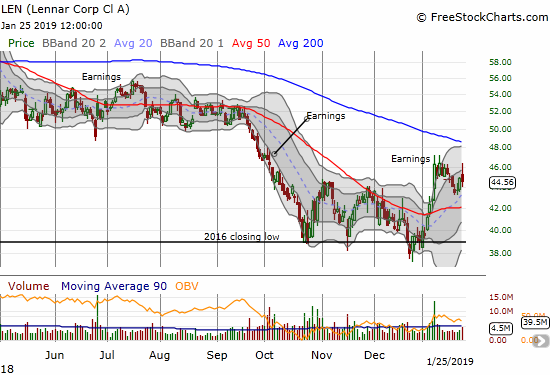
Lennar (LEN)
Home builders are falling behind the stock market and represent a question mark on the rally. LEN surged to challenge the month’s high only to fade to a loss. The stock looks stuck with rapidly declining 200DMA resistance looming to put a definitive cap at the January high.
Walmart (WMT)
WMT failed to participate in Friday’s rally and instead pulled back by 1.4%. The move looks like an end to upward momentum just as the stock needed one final push to beat out key resistance from the prior high.

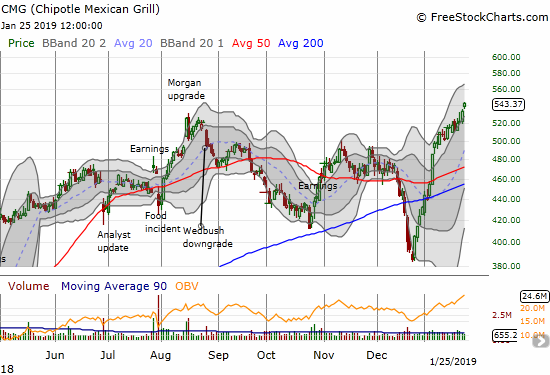
Chipotle Mexican Grill (CMG)
CMG continues to surprise me. The stock made a fresh breakout on Friday to a 25-month high. The stock is up 41.0% from its December low, and I have yet to participate in any of the upside!
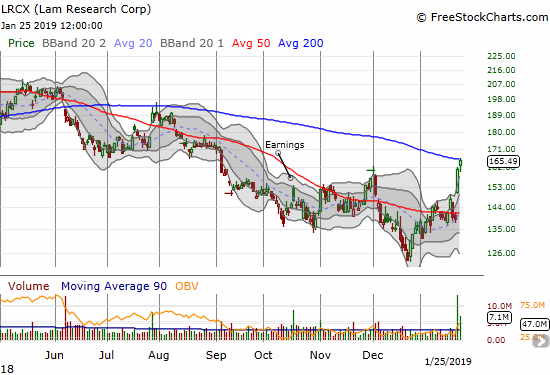
Lam Research (LRCX)
LRCX reignited the semiconductor space with positively received earnings. The stock soared 16.4% on Thursday and continued right into 200DMA resistance on Friday. The stock is extremely stretched above its upper Bollinger Band, so I fully expect some kind of pullback or resting period here. A 200DMA breakout will be very bullish for the stock given the earnings momentum and the apparent end to an extended slide.
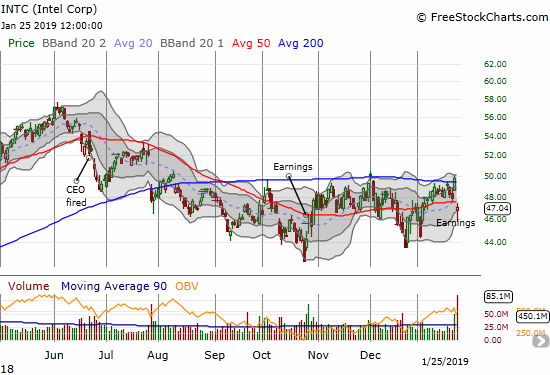
Intel (INTC)
INTC failed to sustain the earnings momentum from LRCX. A pre-earnings 200DMA breakout turned into a post earnings 50DMA breakdown. With the latest news of the Fed’s capitulation process, I decided to jump right into my between earnings play for INTC with a handful of March $47.50 call options. I feel fortunate that buyers took the stock off its intraday low, but I expect an extended fight with 50DMA resistance ahead of the Fed.
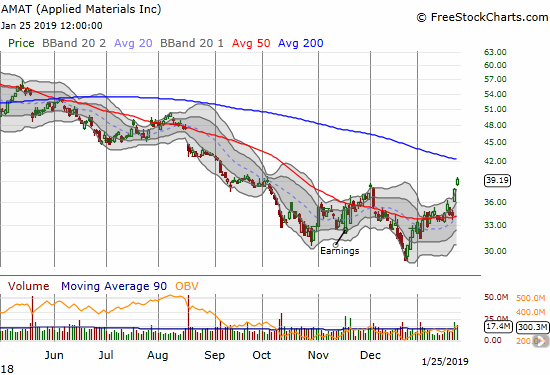
Applied Materials (AMAT)
The overall verdict for semidconductors seems positive as stocks like AMAT benefited from strong sympathy buying on the heels of LRCX’s results. Buyers pushed the stock even further above its upper Bollinger Band on Friday. I of course now wish I bought shares instead of calls when I made a play for AMAT after its post-earnings 50DMA breakout in November. AMAT looks like a bottom and a buy on the dips until at least 200DMA resistance.
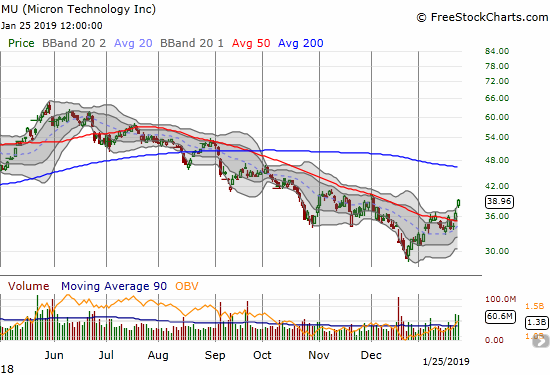
Micron (MU)
MU completely ignored the INTC earnings news and surged its way to a confirmation of a 50DMA breakout. I daresay the stock is now good for its own run for 200DMA resistance.
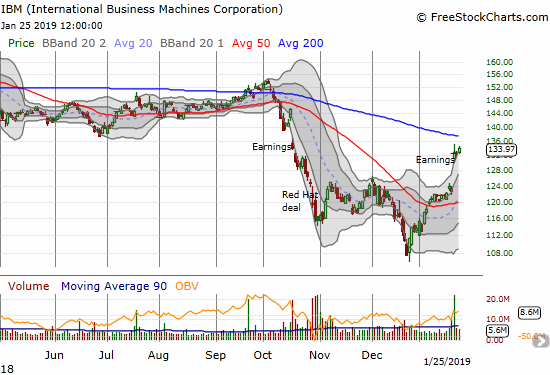
International Business Machines (IBM)
IBM finally experienced some post-earnings love with sustained gains. I am not interested in buying IBM, but I will consider its ability to break out above 200DMA resistance to be a key contributor to bullish tidings for the stock market. A rejection from resistance could set in motion a fill of the post-earnings gap up.
— – —
FOLLOW Dr. Duru’s commentary on financial markets via email, StockTwits, Twitter, and even Instagram!
“Above the 40” uses the percentage of stocks trading above their respective 40-day moving averages (DMAs) to assess the technical health of the stock market and to identify extremes in market sentiment that are likely to reverse. Abbreviated as AT40, Above the 40 is an alternative label for “T2108” which was created by Worden. Learn more about T2108 on my T2108 Resource Page. AT200, or T2107, measures the percentage of stocks trading above their respective 200DMAs.
Active AT40 (T2108) periods: Day #15 over 20%, Day #13 over 30%, Day #12 over 40%, Day #11 over 50%, Day #7 over 60%, Day #1 over 70% (1st day overbought, ending 3 days under 70%)
Daily AT40 (T2108)
")
Black line: AT40 (T2108) (% measured on the right)
Red line: Overbought threshold (70%); Blue line: Oversold threshold (20%)
Weekly AT40 (T2108)

*All charts created using freestockcharts.com unless otherwise stated
The T2108 charts above are my LATEST updates independent of the date of this given AT40 post. For my latest AT40 post click here.
Related links:
The AT40 (T2108) Resource Page
You can follow real-time T2108 commentary on twitter using the #T2108 or #AT40 hashtags. T2108-related trades and other trades are occasionally posted on twitter using the #120trade hashtag.
Be careful out there!
Full disclosure: long SLV, long GLD, long PLCE calls, long INTC calls, long SSTI,
*Charting notes: FreeStockCharts.com stock prices are not adjusted for dividends. TradingView.com charts for currencies use Tokyo time as the start of the forex trading day. FreeStockCharts.com currency charts are based on Eastern U.S. time to define the trading day.