
AT40 = 68.3% of stocks are trading above their respective 40-day moving averages (DMAs)
AT200 = 56.3% of stocks are trading above their respective 200DMAs (a 4-month high)
VIX = 11.6
Short-term Trading Call: neutral
Commentary
It is tough avoiding a flip on my short-term trading call to bullish, but I am sticking by my rules. Last week, uncomfortable divergences kept me planted on neutral. In my last Above the 40 post, I complained about the narrow nature of the rally. Well, TODAY (June 6th), while the rally finally broadened out a bit, AT40 (T2108), the percentage of stocks trading above their respective 40-day moving averages (DMAs), still failed to punch through the overbought threshold of 70%.
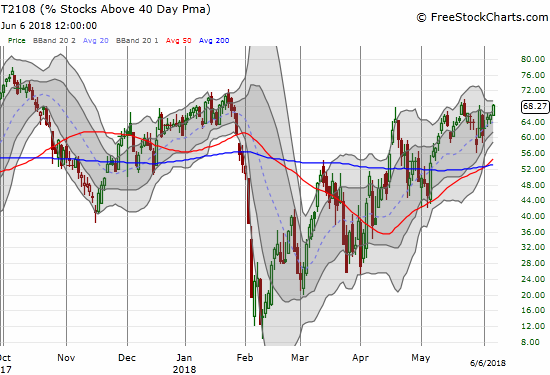
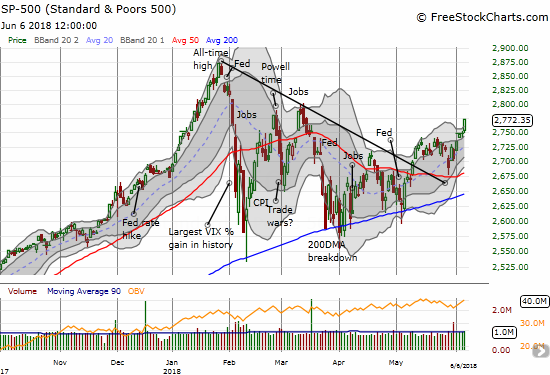
Once/if AT40 gets overbought, I will flip bullish in anticipation of an (extended) overbought rally. As the index charts below show, it looks late to get short-term bullish. Fortunately, the signal to retreat from bullishness will also come from AT40. Once my favorite indicator confirms a fall out of overbought territory, a market pullback becomes very likely. Just such a scenario accompanied the February sell-off.
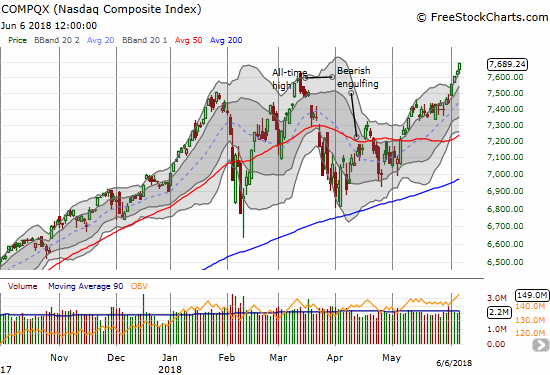
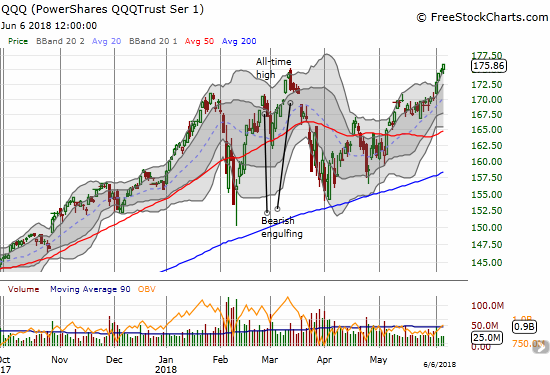
The S&P 500 (SPY) gained 0.9% to close above its upper-Bollinger Band (BB). The NASDAQ gained 0.7% with its third straight all-time high and fourth straight close above its upper-BB. The PowerShares QQQ ETF (QQQ) gained 0.6% in a carbon-copy move with the broader NASDAQ index.
The volatility index, the VIX, has almost reached its own milestone. Trading at 11 or below qualifies as “extremely low” volatility. In posts over the past year I have explained how and why trading at such low levels is bullish for the stock market. The VIX closed at 11.6, down 6.1% and a 4 1/2 month low.
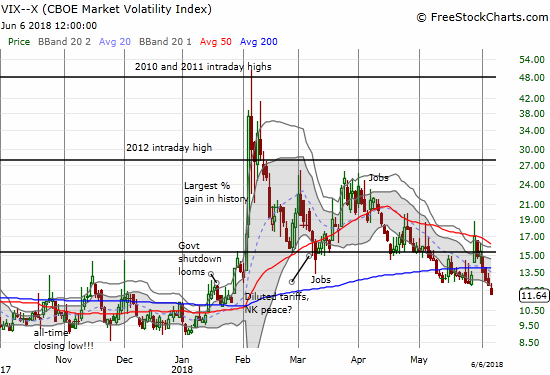
I took this opportunity to buy a third (and final) tranche of UVXY call options as a stock market hedge. Next week’s Fed meeting SHOULD stir up some volatility.
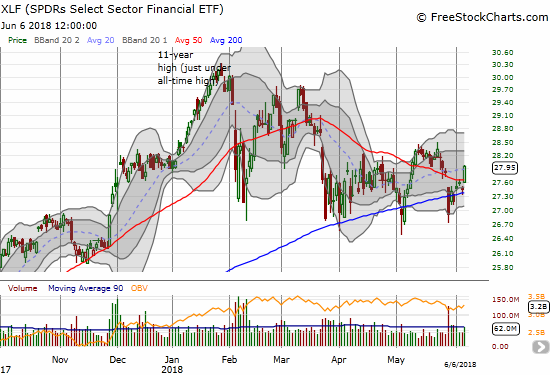
Evidence of the broadening rally was especially evident in financials. The Financial Select Sector SPDR ETF (XLF) soared 1.9% in a move that shook off a lot of funk. XLF broke through its 50DMA and seemingly confirmed 200DMA support.
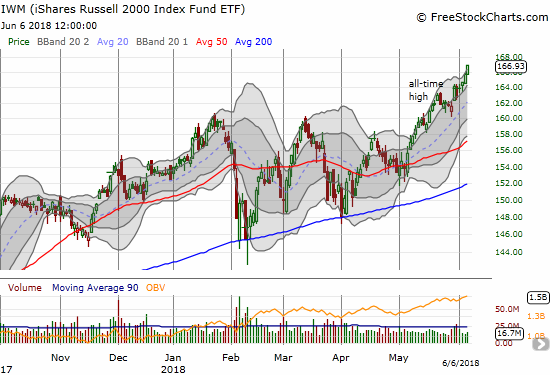
Shame on me for doubting the small-caps for a hot minute. The iShares Russell 2000 ETF (IWM) gained 0.7% and notched another all-time high. IWM has now increased in value 20 of the last 26 days in a display of nearly uninterrupted relative strength.
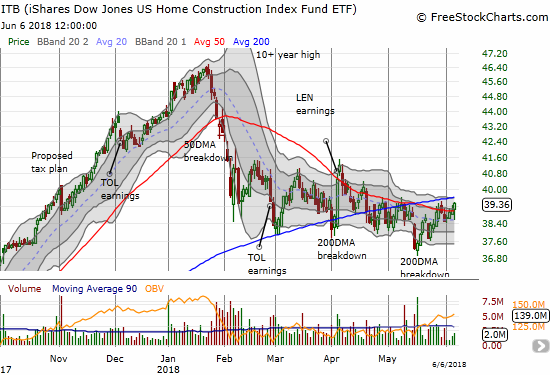
Even iShares US Home Construction ETF (ITB) participated with a 0.9% gain on the day. ITB is pivoting around its 50DMA with an important test of 200DMA resistance imminent.
With signs of strength broadly distributed, flipping to a short-term bullish trading call will generate a dive straight into the headwinds of “overbought” and “overextended” indices. Fortunately, with AT200 (T2107) at a new 4-month high and just above 50%, there are a lot of stocks that have plenty of room for catch-up even with market leaders over-extended. Some of the charts below show some of these opportunities for a tide that rises all boats.
CHART REVIEWS
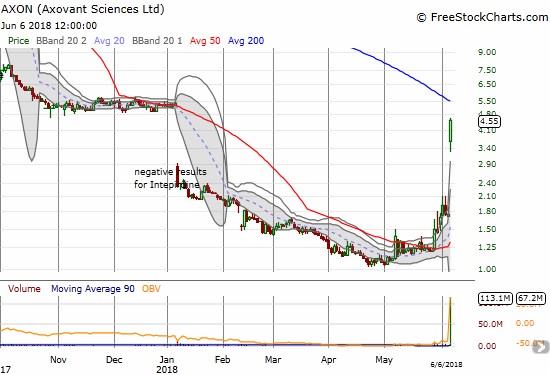
Axovant Sciences (AXON)
I made the case for AXON last week. The trade turned out even more fortuitous than I could have imagined. The company announced major news today, sending the stock up an amazing 160.0%!
-
“
- Exclusive worldwide license to lentiviral vector gene therapy constitutes the first transaction of Axovant’s 2018 pipeline expansion.
- Fraser Wright, Co-Founder and former Chief Technology Officer of Spark Therapeutics, to join Axovant as CTO for gene therapy programs.
- Axovant will receive $25 million equity financing from Roivant Sciences to support clinical development of AXO-Lenti-PD and additional business development.
”
I sold the stock at around an 88% gain on the day as it pulled back from the open. I certainly could not tell that buyers would soon step back in for a fresh run-up. This is the kind of stock that represents high upside potential in a truly bullish market that also features speculative tendencies. I will be looking for new entry points in the stock, but I do not expect them to come quickly or easily. Regardless, this latest company news seems to confirm my earlier thesis that the company has successfully hit a reset button on its way to an extended recovery.
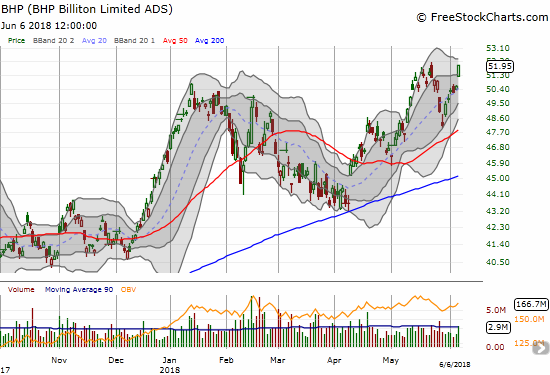
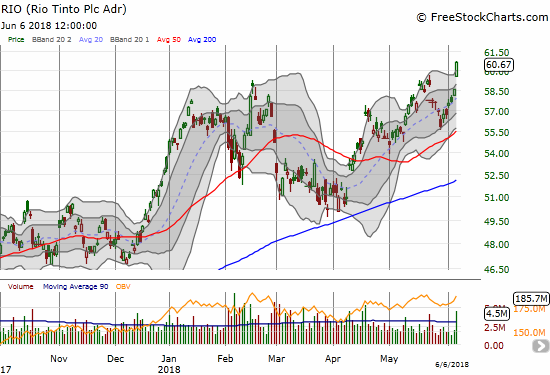
BHP Billiton (BHP) and Rio Tinto (RIO)
The only reason I hold no regret over holding my BHP puts during the last pullback is that I chose to double down on RIO call options instead of taking BHP profits. That decision paid off well today as RIO soared 3.7% to a new 6+ year high. I decided to hold onto the call options at least one more day to see whether RIO can deliver more follow-through to this impressive breakout. With expiration coming up next week, I need to make a move soon to take profits on this latest pairs trade.
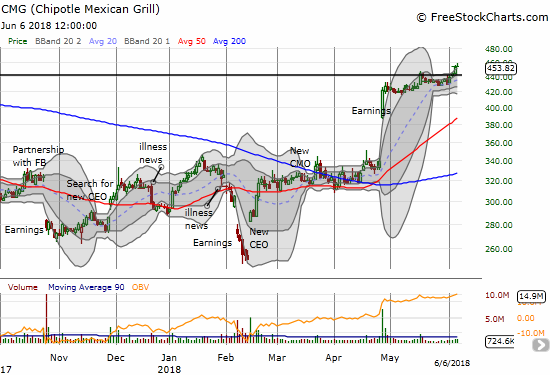
Chipotle Mexican Grill (CMG)
I have practically posted to death on CMG. I am posting this time just to point out that CMG is in the breakout mode I have been anticipating for some time. Even more importantly, the stock received fresh backing from CNBC Mad Money’s Jim Cramer. I had already taken profits on the breakout ahead of his segment, so I was admittedly a bit dismayed that. I set in motion a new trade using a calendar call spread. Going forward I will continue to play this stock on the bullish side while trying out different call option configurations.
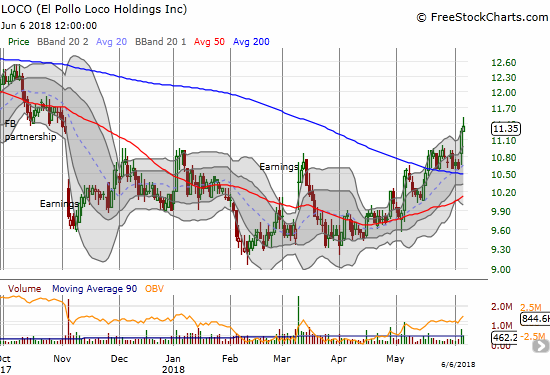
El Pollo Loco Holdings (LOCO)
Jim Cramer’s segment on casual dining stocks also included LOCO. In this case, he did me a solid as I have been accumulating patiently since the post-earnings breakout in March. The Cramer-inspired move for Loco pushed the stock to a fresh break out and confirmed the 200DMA break out from May.
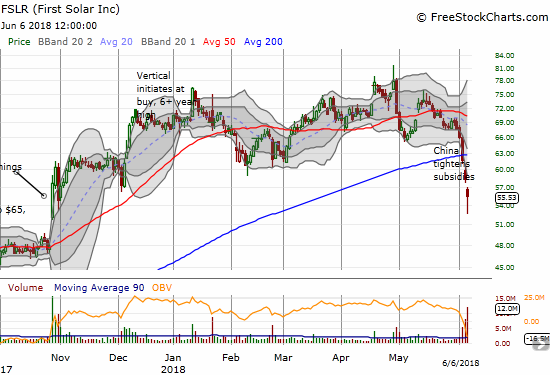
First Solar (FSLR)
In late April, I gushed over a big break out move in FSLR. When the stock started tumbling late last week, I thought I received a golden opportunity to buy the dip. Instead, the stock continued selling off and crashed through 200DMA support. Analysts have downgraded FSLR and other solar stocks in the wake of Chinese restrictions on the solar panel market. I decided not to add any more tranches after my first busted trade until I see signs of buyer interest. I am a bit encouraged to see how buyers lifted FSLR well off its bottom today as it trades in an over-extended mode to the downside.
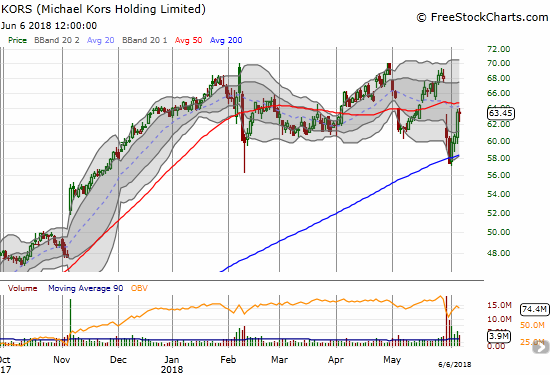
Michael Kors Holding (KORS)
KORS is another stock that represents good upside opportunity in a bullish market. Notice below how it neatly bounced off 200DMA support even after gapping down post earnings. I consider the stock a buy here even with 50DMA resistance looming overhead.
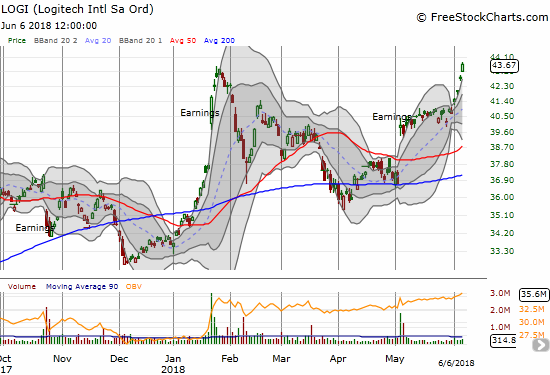
Logitech (LOGI)
I decided to sell my position in LOGI here. The stock has made a great run but is now over-extended above its upper-BB. This move is happening just as the stock is making a new all-time high. Some type of pullback to cool the stock off seems extremely likely. So it made sense from a risk/reward perspective to take profits. I will be looking for new fresh buying opportunities in future dips.
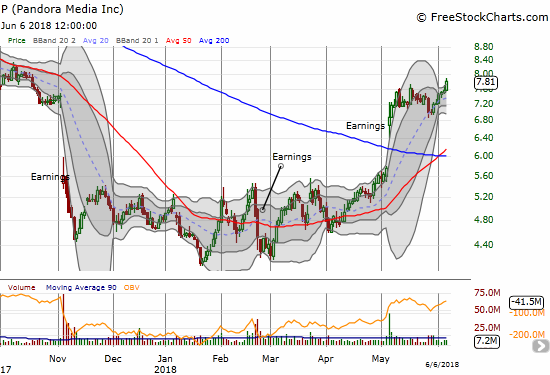
Pandora (P)
Pandora is on the move again. The latest breakout confirms my bullish tidings from the post-earnings gap up and 200DMA breakout from last month. I failed to position myself during the last consolidation period. I will be looking to correct this mistake sometime soon I hope.
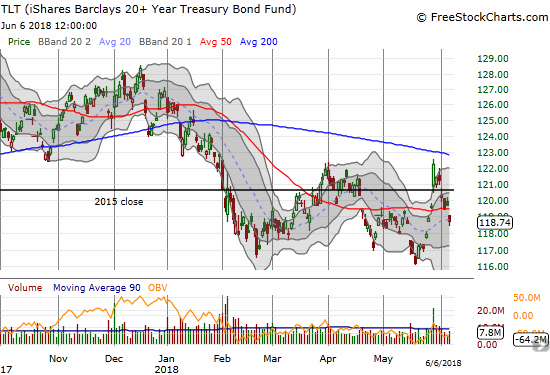
iShares 20+ Year Treasury Bond ETF (TLT)
My stubborn fading of TLT continues to pay off. I now think TLT could decline all the way into the Fed meeting. If so, I expect a relief rally almost no matter what the Fed does with interest rates. I will take profits on my put options ahead of the meeting.
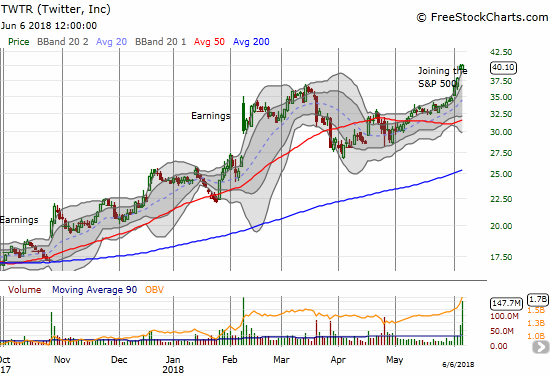
Twitter (TWTR)
Now I think I understand why TWTR rallied for so many weeks. Perhaps some traders got the drop or guessed correctly that Twitter would soon receive an invite from the S&P 500. The stock gapped up nicely on the news. Now the question is whether the stock can maintain the momentum now that the news is out. I finally put it in a new position using a calendar call spread as an initial way to play this move. I will be looking to adjust my positioning quickly and responsively.
Twitter confirmed its status as a Trump Trade by more than doubling since Donald Trump’s election as the President of the U.S.A. Trump’s persistent use of Twitter as a speaking platform has entrenched the platform in the public sphere.
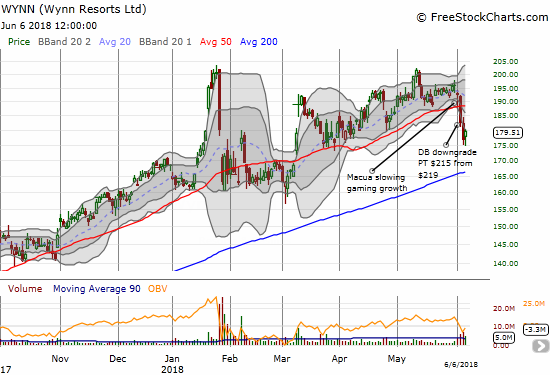
Wynn Resorts (WYNN)
WYNN is a great test case of a bullish market. The stock started selling off on bad gaming news from Macau. An analyst downgrade that maintained a higher price target than current trading levels helped drag the stock down a lot more. Now buyers are showing interest. If the market is in truly a bullish mood, this should be the bottom of the selling and serve as the refreshing station for WYNN to go higher. I took on a bullish position for the first time in too long a time with a call spread.
In other trades: took profits on AZO call spread.
— – —
FOLLOW Dr. Duru’s commentary on financial markets via email, StockTwits, Twitter, and even Instagram!
“Above the 40” uses the percentage of stocks trading above their respective 40-day moving averages (DMAs) to assess the technical health of the stock market and to identify extremes in market sentiment that are likely to reverse. Abbreviated as AT40, Above the 40 is an alternative label for “T2108” which was created by Worden. Learn more about T2108 on my T2108 Resource Page. AT200, or T2107, measures the percentage of stocks trading above their respective 200DMAs.
Active AT40 (T2108) periods: Day #76 over 20%, Day #45 over 30%, Day #40 over 40%, Day #22 over 50%, Day #5 over 60% (overperiod), Day #90 under 70%
Daily AT40 (T2108)
")
Black line: AT40 (T2108) (% measured on the right)
Red line: Overbought threshold (70%); Blue line: Oversold threshold (20%)
Weekly AT40 (T2108)

*All charts created using freestockcharts.com unless otherwise stated
The charts above are my LATEST updates independent of the date of this given AT40 post. For my latest AT40 post click here.
Related links:
The AT40 (T2108) Resource Page
You can follow real-time T2108 commentary on twitter using the #T2108 or #AT40 hashtags. T2108-related trades and other trades are occasionally posted on twitter using the #120trade hashtag.
Be careful out there!
Full disclosure: long UVXY calls, long BHP puts, long CMG calendar call spread, long FSLR calls, long LOCO, long RIO calls, long TLT puts, long WYNN call spread
*Charting notes: FreeStockCharts.com stock prices are not adjusted for dividends. TradingView.com charts for currencies use Tokyo time as the start of the forex trading day. FreeStockCharts.com currency charts are based on Eastern U.S. time to define the trading day.