
AT40 = 35.5% of stocks are trading above their respective 40-day moving averages (DMAs)
AT200 = 34.8% of stocks are trading above their respective 200DMAs
VIX = 17.4
Short-term Trading Call: bullish
Commentary
Hold up. Pump the brakes. The bounce from oversold conditions just got more difficult as sellers forced buyers to come to a screeching halt.
via GIPHY
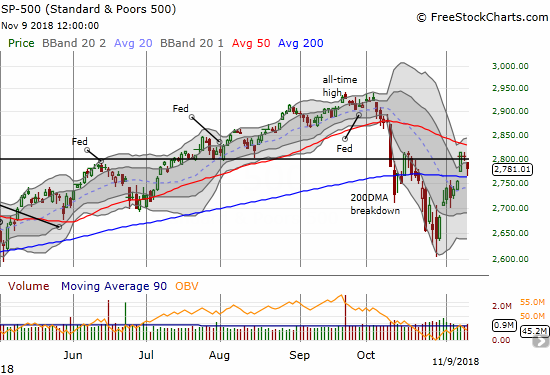
The S&P 500 (SPY) fell 0.9% in what looks like a “close enough” failure at downtrending 50-day moving average (DMA) resistance. In a bit of good news, the index also bounced picture-perfect style off its 200DMA support. I will call it a stalemate.
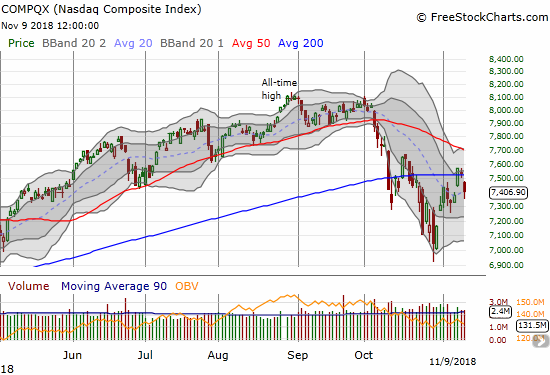
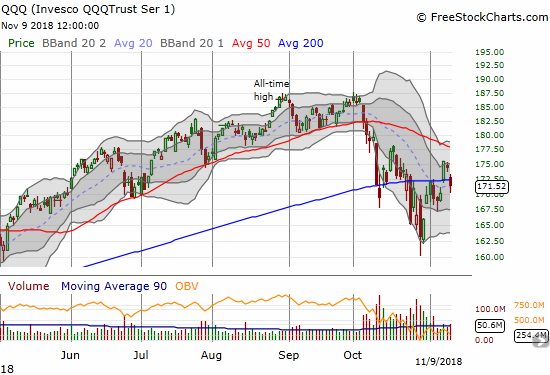
The tech-laden NASDAQ and the Invesco QQQ Trust (QQQ) were not as fortunate as the S&P 500. Both lost 200DMA support with the NASDAQ gapping down for a 1.7% loss and QQQ slicing through support for its own 1.7% loss. Adding insult to injury, at their intraday lows, both indices reversed their post-election gains.
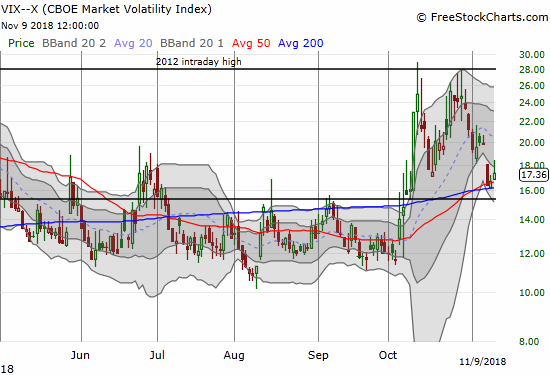
The selling was not enough to rattle the volatility index, the VIX. The VIX only gained 3.8% and even fell sharply from its high of the day. The VIX still looks ready to continue its post oversold implosion. Accordingly, I bought a fresh tranche of put options on ProShares Ultra VIX Short-Term Futures (UVXY) with a 2-week expiration.
The currency markets showed some signs of stress in-line with a risk-off day. The Australian dollar (FXA) weakened and the Japanese yen (FXY). As a result, AUD/JPY suffered a notable pullback. I will not get concerned until/unless 200DMA support gives way. I used the pullback to build a slightly larger long position on AUD/JPY.
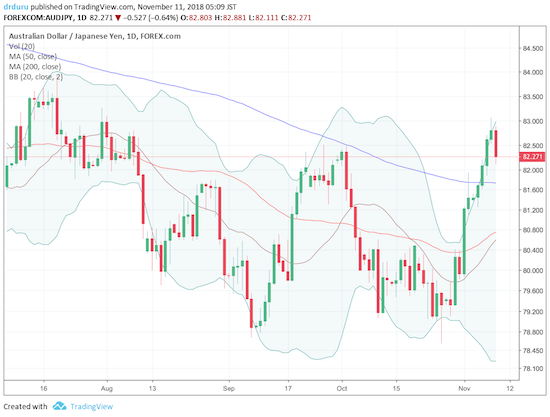
Source: Trading View
A reversal like Friday’s makes bulls doubt their rationale for excitement just two days ago and gives bears reason for fresh skepticism. AT40 (T2108), the percentage of stocks trading above their respective 40DMAs, tells me to be cautious, but not to downgrade my short-term trading call of bullish. AT40 dropped back to 35.5% and is still in the early stages of a rebound from oversold conditions. AT200 (T2107), the percentage of stocks trading above their respective 40DMAs, only dropped to 34.8% from Wednesday’s peak of 37.4%. I am more inclined to think that the market will churn and digest gains from the rebound. I will reconsider the bearish case if the S&P 500 closes below its 200DMA support.
I stuck to my post oversold strategy of buying the dips and bought SPY call options. I plan to sell these into the next bounce. However, my core position in iShares Russell 2000 ETF (IWM) call options experienced a big setback. With just a week to go before expiration, Friday’s 1.8% pullback was enough to wipe out most of the profits in those call options. I will now need to sell into the next bounce rather than wait for what I still think is an imminent retest of 50DMA resistance.
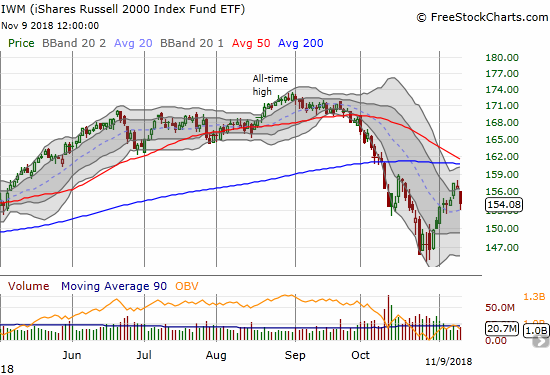
CHART REVIEWS
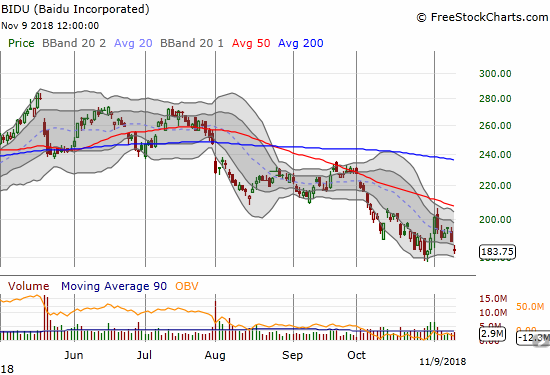
Baidu (BIDU)
BIDU finally looked ready for a sustained bounce, and I decided to hold onto a call instead of taking quick profits. My expectations were dashed on Thursday’s reversal. Friday’s gap down and 2.6% loss wiped out any residual expectations I had. Still, stubbornly, I went back in for a call expiring next week even with a bottom looking ever more tenuous. On a new low, I will have to consider flipping my sentiment on BIDU and Chinese (internet) stocks in general.
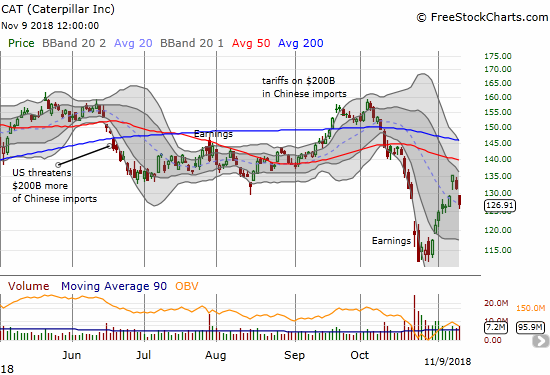
Caterpillar (CAT)
On Thursday, I decided to push my bullishness by actually opening up a limit order on a calendar call spread on CAT. I changed my mind in less than a hour and moved to go back to treating CAT as a hedge and bought a put. After the Fed’s pronouncement on monetary policy, industrial and related stocks notably weakened. I decided to take quick profits on the put. Soon after that, my order for the calendar call spread executed. I decided to leave the trade in place. When CAT gapped down on Friday, I loaded up on put options. The stock kept selling off and with a 3%+ loss on hand, the profits were enough for me to flip the position. If CAT violates Friday’s intraday low, the stock will plunge itself solidly back into bearish territory, and I will trade accordingly with an expectation for a retest of recent lows.
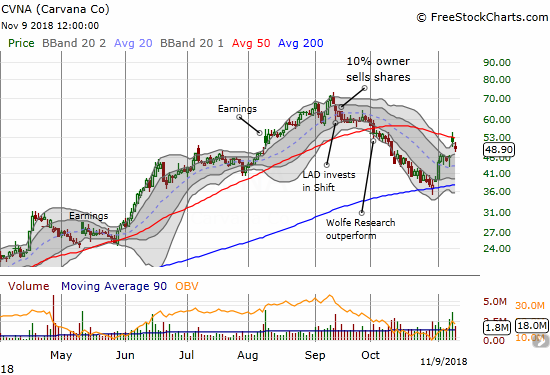
Carvana (CVNA)
On October 2nd, SPDR S&P Retail ETF (XRT) plunged below its 50DMA. The loss was dramatic enough for me to call a top in these retail stocks. Looking back, I can see this major technical breakdown was an early sign of the troubles that waited around the corner for the rest of the stock market in October!
Anyway, at the time, CVNA was (surprisingly) the top holding in XRT, so I took a closer look (somehow, CVNA dropped completely from the top 10 in the last month). Combined with its technicals, I called the stock a short. Largely thanks to the selling that took the market through two oversold periods, CVNA went on to lose a whopping 35.7% before bottoming; so many high-priced, high-flying stocks lost similar chunks of value in October. I only held puts for a portion of the slide. More importantly, CVNA bottomed perfectly at its 200DMA, and earnings last week gapped the stock over its 50DMA resistance. Given the stock trades so well with the technicals, I will look to trade more aggressively its next definitive move. Right now, it looks like sellers want to fill the post-earnings gap up.
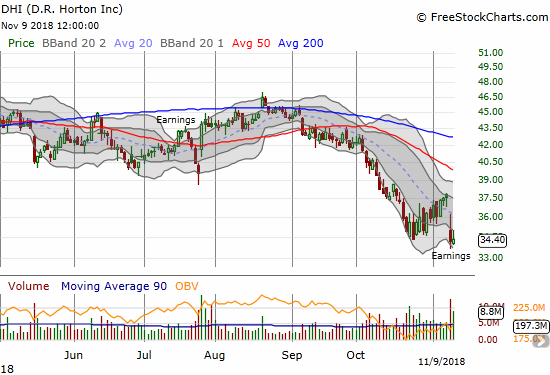
D.R. Horton (DHI)
The respite for the stocks of home builders officially ended with the big post-earnings loss in DHI. The stock closed at a new 16-month low. The seasonally strong period for this sector is already in peril with commentary like this from DHI’s earnings report (emphasis mine):
“Sales prices for both new and existing homes have increased across most of our markets over the past several years, which coupled with rising interest rates has impacted affordability and resulted in some moderation of demand for homes, particularly at higher price points. However, we continue to see good demand and a limited supply of homes at affordable prices across our markets, and economic fundamentals and financing availability remain solid. We are pleased with our current product offerings and positioning to meet demand in the current market, and we will adjust to future changes in market conditions as necessary.”
The much belated acknowledgement of “moderating” demand was couched in generally positive news and commentary, but it was all the market needed to hear. Finally, a home builder is admitting that higher interest rates and higher prices are directly and definitively hurting demand. The underlying implication from DHI is that investors should expect a moderation in prices to follow soon.
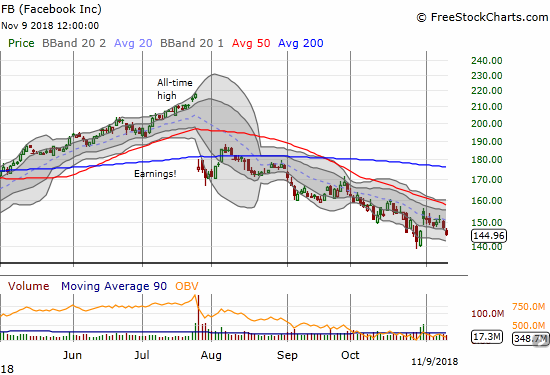
Facebook (FB)
The immediate results of my pre-earnings trade in Facebook were quite favorable. Even the drift lower that closed the post-earnings gap up favored my positioning in calendar call spreads. Friday’s follow-on selling with a 2.0% loss finally turned the tables. I am looking at dwindling profits and the increasing prospect that FB will maintain the downtrend in place with its declining 20DMA. I was positioning for a slow recovery to 50DMa resistance and perhaps beyond by mid-January.
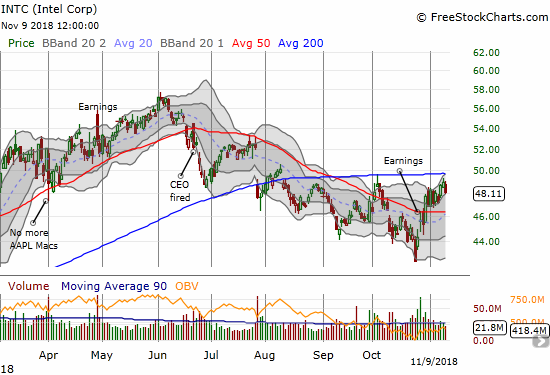
Intel (INTC)
INTC reached my first price target, and I took profits in my call options as a part of my INTC between earnings play. I am still holding the calendar call spread. My limit order on Friday for a fresh tranche of calls did not trigger. I am hoping to load up in the coming week.
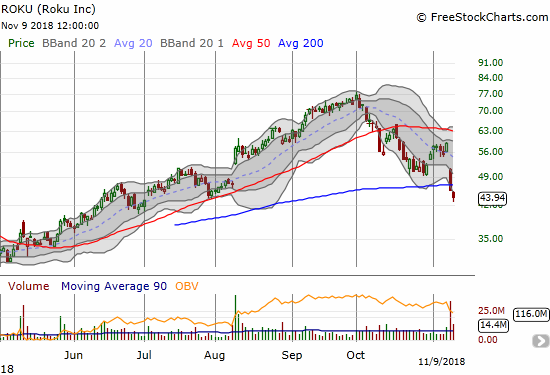
Roku (ROKU)
ROKU is a case where the calendar spread largely fails. Before earnings, I loaded up on a calendar put spread with a $50 strike that I found too cheap to pass up. I was/am bearish on ROKU, so I was willing to take a shot. The stock gapped down all the way to $51 resulting in a minimal gain on the spread and mounds of hindsight-filled regret that I did not just buy puts outright. That regret only grew at the close with a 22.3% loss in the stock, a break of 200DMA support, and a small LOSS on the calendar put spread. I found small consolation in flipping a put in the middle of the selling. Friday’s extended selling and confirmation of the 200DMA breakdown brought flashbacks of regret. I decided to accept the assignment of the short puts. I plan to immediately sell calls against the position on Monday and just ride whatever happens into Friday’s expiration. I will have a position that will have tremendous upside potential relative to the minimal potential (additional) loss.
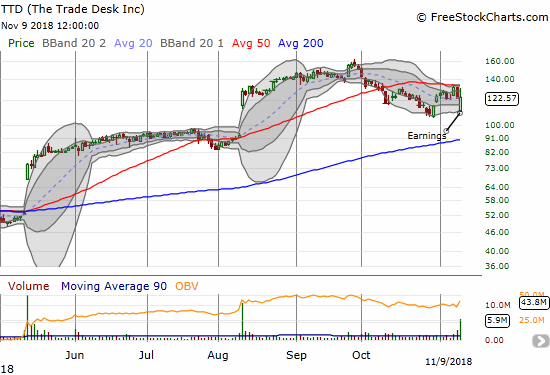
The Trade Desk (TTD)
Ahead of earnings, I was discussing TTD with some friends. I noticed that the options market was pricing in a 17% post-earnings move up or down. It is rare to see such extreme pricing, so I was trying to find out the story. All I had to do was look at the chart. The last two earnings cycles sent TTD skyrocketing higher. Suspecting that the market was mispricing the odds (similar to the Facebook pre-earnings trade), I looked for a way to sell premium into the market. I failed to find an acceptable configuration (I likely missed it).
The end result was simply astonishing. Bearish and bullish options sellers laughed all the way to the bank. TTD gapped down 9.8% with buyers immediately stepping into the breach. Incredibly, the buying did not stop until TTD notched a 7.2% gain that even reversed the previous day’s loss. The technicals took over from there with TTD getting rejected once again from 50DMA resistance. Sellers closed the stock out flat for the day.
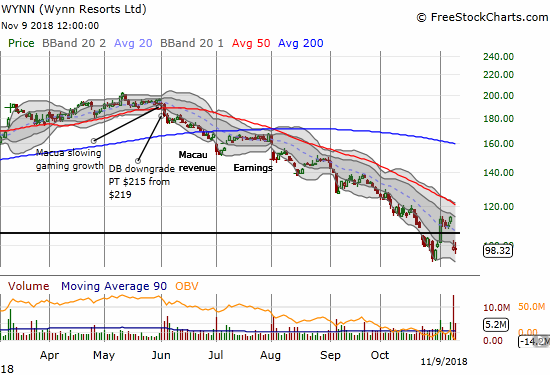
Wynn Resorts (WYNN)
The troubles continue for WYNN. The optimism after the departure of former CEO Steve Wynn is a distant memory. Earnings on Thursday quickly wiped out the stock’s latest attempt to bounce off lows. The downtrend in place from the 20DMA remains well intact. WYNN has lost a stomach-churning 46.2% since its big 50DMA breakdown on June 1, 2018. Talk about a technical signal I should have just followed with both hands and feet.
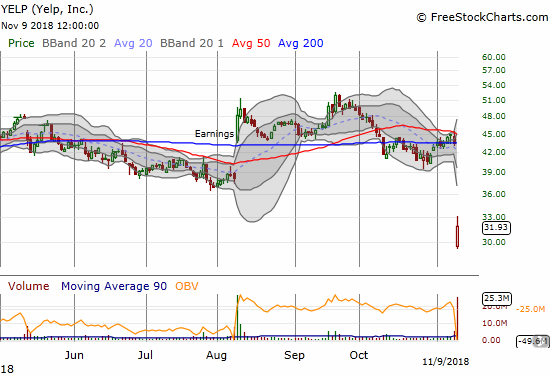
Yelp (YELP)
YELP received a post-earnings pounding. The company and stock has become a constant churner. Before earnings, YELP was trapped in an extended 3-month post-earnings trading range. Even the 26.7% post-earnings loss kept YELP within an even more extended 15-month trading range. I was primed to buy the stock given it was so over-extended below its lower-Bollinger Band (BB). I tried a different approach to this trade by setting buy stops; my idea was to only buy after buyers showed up intraday. This method only served to limit my profits as the market kept taking out my stops only to push the stock right back down. I took my small profits at the close with another lesson learned.
— – —
FOLLOW Dr. Duru’s commentary on financial markets via email, StockTwits, Twitter, and even Instagram!
“Above the 40” uses the percentage of stocks trading above their respective 40-day moving averages (DMAs) to assess the technical health of the stock market and to identify extremes in market sentiment that are likely to reverse. Abbreviated as AT40, Above the 40 is an alternative label for “T2108” which was created by Worden. Learn more about T2108 on my T2108 Resource Page. AT200, or T2107, measures the percentage of stocks trading above their respective 200DMAs.
Active AT40 (T2108) periods: Day #7 over 20%, Day #4 over 30% (overperiod), Day #1 under 40% (underperiod ending 2 days above 40%), Day #35 under 50%, Day #51 under 60%, Day #104 under 70%
Daily AT40 (T2108)
")
Black line: AT40 (T2108) (% measured on the right)
Red line: Overbought threshold (70%); Blue line: Oversold threshold (20%)
Weekly AT40 (T2108)

*All charts created using freestockcharts.com unless otherwise stated
The charts above are my LATEST updates independent of the date of this given AT40 post. For my latest AT40 post click here.
Related links:
The AT40 (T2108) Resource Page
You can follow real-time T2108 commentary on twitter using the #T2108 or #AT40 hashtags. T2108-related trades and other trades are occasionally posted on twitter using the #120trade hashtag.
Be careful out there!
Full disclosure: long SSO, long AAPL calls, long IWM calls, long AUD/JPY, long BIDU calls, long CAT calendar call spread, long ROKU puts and shares, long FB calendar call spreads, long INTC calendar call spread,
*Charting notes: FreeStockCharts.com stock prices are not adjusted for dividends. TradingView.com charts for currencies use Tokyo time as the start of the forex trading day. FreeStockCharts.com currency charts are based on Eastern U.S. time to define the trading day.
What happens now with TTD? Beats earnings and raises guidance, but technicals don’t look too good. There’s that large gap up in the 80-90s from previous earnings but very strong support at 100 as this manipulated earnings fall showed. Where do you think it goes it go from here? T
Stock looks like a stalemate for now. The big surge off the intraday low has to be treated like a short-term bottom. TTD is bearish IF sellers break the prior short-term low around 106. On the bullish side, I wouldn’t buy the stock until/unless the stock closed above its 50DMA. Given the three straight failures at that line, a breakout should be treated as very significant.
That’s the technical picture. I don’t know about the fundamentals. The valuation seems *extremely* rich to me. On that basis alone, I would not buy this stock as a long-term holding.