
When Facebook (FB) lost 19.0% after reporting earnings on July 25th, the stock’s $120B loss was reportedly the largest one-day loss in absolute terms in stock market history. That trauma was of course epic in scale, but it was well aligned with the startling post-earnings run-up that followed the April 25th earnings report. In fact, the July one-day loss did not even finish erasing the entire run-up going into July earnings. The gap up did not finish closing until September. The market started its response to April earnings with a 9.1% gain, and the buyers were off to the races after that. The stock nearly went parabolic along its upper Bollinger Band (BB) ahead of the July earnings.
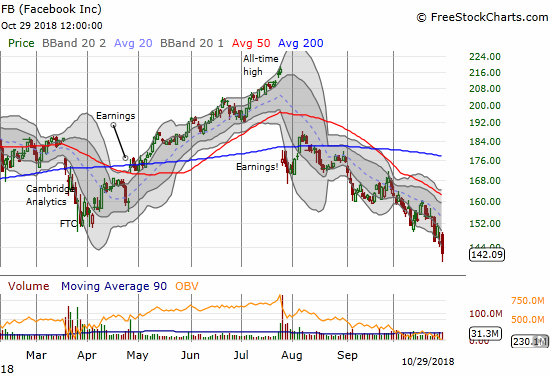
Source: FreeStockCharts.com
Combine the July trauma with the current calamity in the general stock market and the market offers up some very expensive options in Facebook ahead of its October 30th earnings call after hours. Based on Monday’s closing prices, options players expect about a 13-point move, up or down, by the end of this week. Weekly calls and puts expiring this Friday at the $142 strike each cost about $6.50. Add the two together to get the approximate expected move of $13. That move equates to a +/-9% post-earnings burst.
Based on Facebook’s earnings history, a +/-9% move is a bit on the extreme side. Out of Facebook’s 25 earnings reports, only 5 have delivered 1-day post-earnings gains above 9% and just 2 have delivered post-earnings gains below -9%. This extreme is on a distribution that is slightly skewed positive with an average gain of 2.8% and a median gain of 2.3%. Around half, 14 to be exact, of FB earnings reports have delivered 1-day gains.
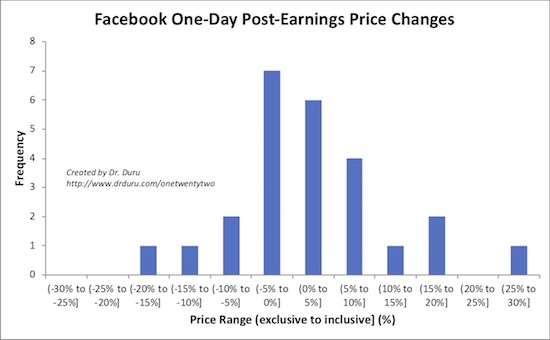
Source: Prices from Yahoo Finance. Earnings dates from briefing.com.
With options on the pricey side, a good pre-earnings play should include selling some premium back to the market. With the market sell-off at historic extremes on a relative basis and Facebook already down 15.8% for the month of October, I am inclined to bet on a positive post-earnings response. Given these conclusions, I took interest in CNBC’s OptionsAction show last Friday which proposed a calendar call spread as a pre-earnings play.
Facebook is having its worst year ever, but could it be due for a bounce? @Michael_Khouw and @RiskReversal weigh in. $FB pic.twitter.com/SV7Wc7TaYu
— Options Action (@OptionsAction) October 26, 2018
Facebook was higher at the time and now the calendar call spread looks even more attractive. I like selling the November $155 call for about $3.10 and buying the January call at $5.80. That still matches the $2.70 price from OptionsAction but gives a better $155 upside target which happens to coincide with a downtrending 20-day moving average (DMA). Even on the way down, FB has periodically rallied to this point. I particularly like this setup because I expect the November/December period to be relatively benign, giving a good chance for the position to net profits even if the market’s initial post-earnings response is negative.
On the downside, I do not see any good technical support for FB until its pre-earnings top from two years ago around $133.50. After that point, support shows up around $114 at the post-earnings triple bottom November to December, 2016. We know the downside risk in FB is VERY real given the post-earnings sell-offs in fellow big-cap tech/internet cousins Amazon.com (AMZN) and Google (GOOG).
Be careful out there!
Full disclosure: long AMZN calendar call spread