
AT40 = 21.4% of stocks are trading above their respective 40-day moving averages (DMAs) – ends an 11-day oversold period that followed a 4-day oversold period
AT200 = 32.0% of stocks are trading above their respective 200DMAs
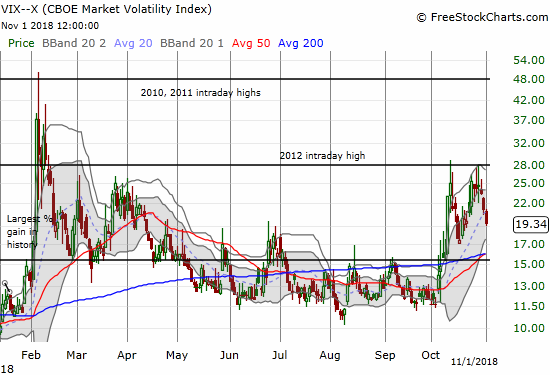
VIX = 19.3
Short-term Trading Call: bullish
Commentary
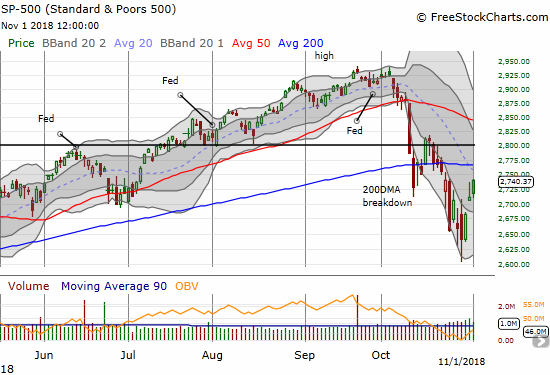
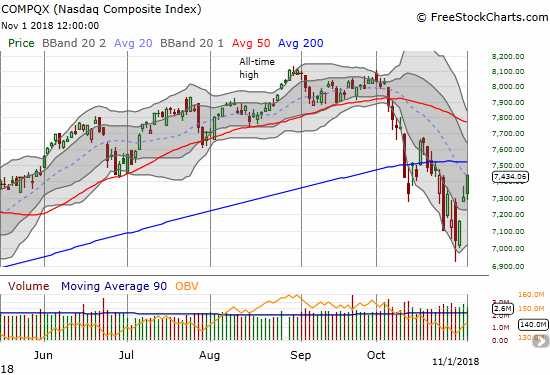
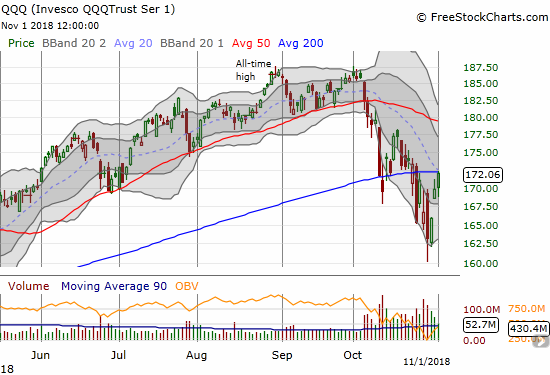
AT40 (T2108), the percentage of stocks trading above their respective 40-day moving averages (DMAs), closed at X%. The move ended a very extended 11-day oversold period that followed a one day respite from a 4-day oversold period. Today was the kind of day I wanted for a punch out of oversold conditions; it even quickly invalidated a small bearish divergence. The rally in the S&P 500 (SPY), the NASDAQ, and the Invesco QQQ Trust (QQQ) were all strong enough to close at their intraday highs and surpass the previous day’s intraday highs. The volatility index, the VIX, even cooperated by falling below 20 and presumably starts the end of wild swings in the market.
I thought my footnote on the action would be the wildcard of Friday’s jobs report. However, a poorly received earnings report from Apple (AAPL) in the after hours has the potential for sending the market right back into oversold territory. Whatever happens Friday, attention should quickly turn to the midterm elections on Tuesday. No matter the results, I am anticipating a volatility implosion as the market settles into incrementally lower uncertainty. If volatility remains high, then I will have to re-evaluate my expectations for a relatively benign end to the year.
Perhaps an even more important footnote is the relative performance of AT40 versus AT200 (T2107), the percentage of stocks trading above their respective 200DMAs. AT40 ended the oversold period at a slightly higher level than it ended the prior oversold period. However, AT200 ended this oversold period significantly lower: 32.0% versus 39.6%. This disparity flags longer-term technical damage in the stock market; the rebound out of oversold conditions left behind a small group of stocks. These laggards will hurt breadth as the rally proceeds and could provide the seed for the next market topping action. As usual, I will take this process one step at a time.
This was another day to mainly focus discipline on holding my long positions and looking for more buying opportunities from the shopping list. I snuck into ProShares Ultra S&P500 (SSO) on the small pullback from the open. I am in accumulation mode for SSO shares. I added to my Walmart (WMT) call options. I launched another short Rio Tinto (RIO) versus long BHP Billiton (BHP) pairs trade this time with a bullish bias. I even purchased a call spread on Red Hat (RHT) to play the post IBM deal discount. However, I missed out on getting back into Baidu (BIDU); I blinked and the call options I targeted increased by almost 4x as the stock gained a whopping 6.0% by the close. President Trump’s claim that he would get a “great deal” with China helped ignite the fire.
CHART REVIEWS
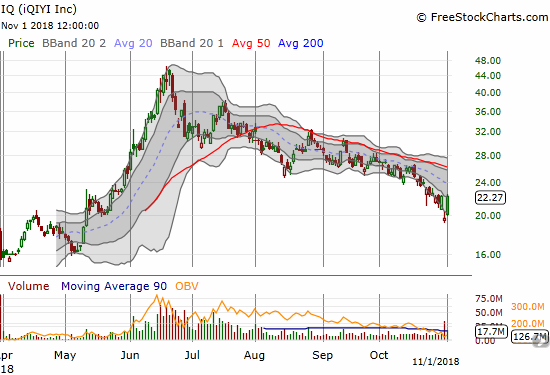
Iqiyi (IQ)
In the wake of earnings yesterday, IQ fell to a near 6-month low. The stock looked ready to set an all-time low. Then came along President Trump claiming he would make a “good deal” with China and that sent China-related stocks off to the races. IQ gained a whopping 13.4% and left behind what looks like an abandoned baby bottom. Note that the primary downtrend from the 20DMA is still well intact, and IQ needs to break out from the lower Bollinger Band downtrend.
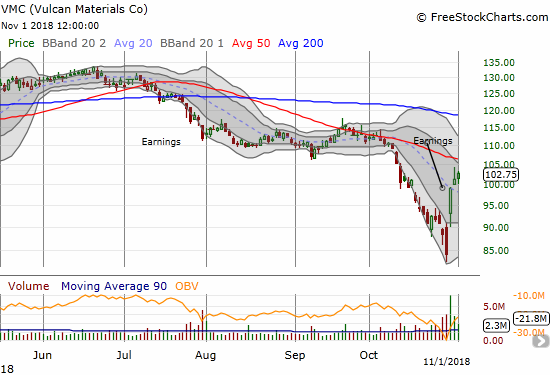
Vulcan Materials Company (VMC)
VMC is one of the kinds of stock charts I love to see coming out of an oversold period. At the depth of the sell-off and directly ahead of earnings, VMC dropped to a near 2-year low. The stock gapped up and ripped higher the next day in response to earnings. The move was like a definitive repudiation of the negativity going into earnings. VMC also received tailwinds with the general market bounce out of oversold conditions and buyers kept the momentum going. This stock is now a buy on the dip with a stop below that near 2-year low.
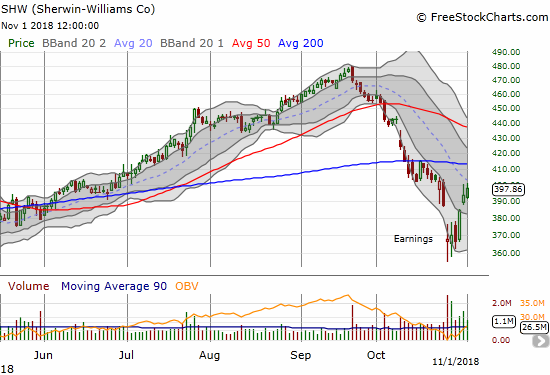
Sherwin-Williams Company (SHW)
SHW is similar to VMC but a little less dramatic and a bullish move in a different order. SHW reported earnings and dropped to its 2018 low at the depths of the market sell-off. Fast-forward to the run-up out of oversold conditions, and SHW has already erased its post-earnings loss. The stock is a buy with a stop below the post-earnings low. SHW of course still has plenty of overhead resistance to work through.
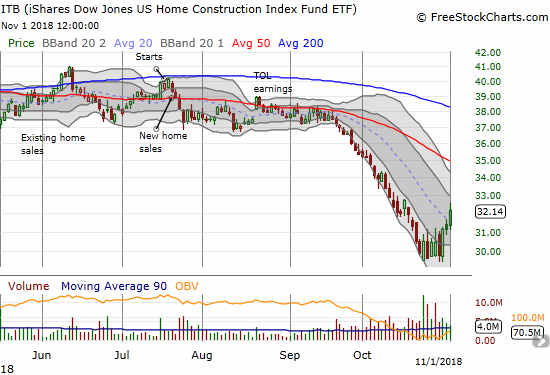
iShares US Home Construction ETF (ITB)
Housing stocks in general had a great day with home builders receiving a major bid. ITB moved out of the rotation with growth stocks and rallied alongside the market for a 3.1% gain. The rally pushed ITB above its downtrending 20DMA for the first time in a month and a half.
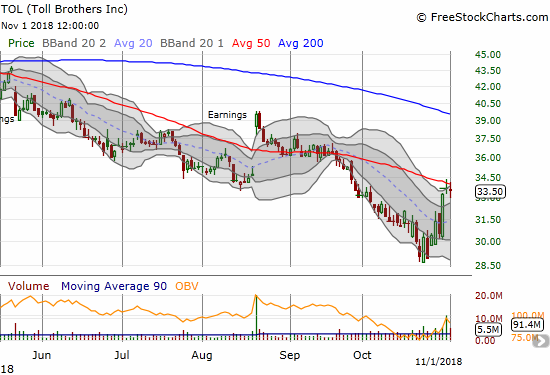
Toll Brothers (TOL)
TOL did not participate in the big home builder rally today, but the stock made its big move on October 30th. A massive 9.2% one-day gain sliced right through 20DMA resistance. Now TOL is stalled at 50DMA resistance. Earnings are still a month away so the resolution of this technical test could be a key tell for the prospects of home builders maintaining a solid start to their seasonally strong period.
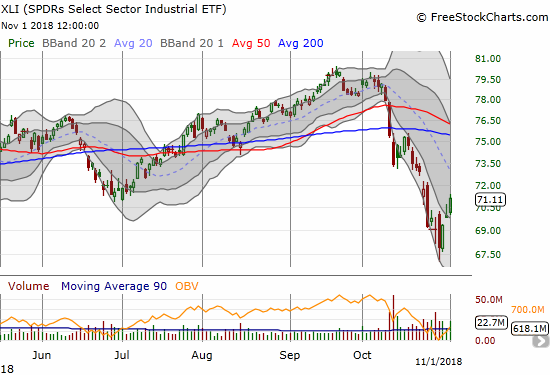
Industrial Select Sector SPDR ETF (XLI)
Last week, XLI broke down dramatically through its 2018 lows. The bounce out of oversold conditions took the index right back to those prior lows. This is an important juncture for industrial stocks. For good measure, I added to my hedge on bullishness with more Caterpillar (CAT) puts.
— – —
FOLLOW Dr. Duru’s commentary on financial markets via email, StockTwits, Twitter, and even Instagram!
“Above the 40” uses the percentage of stocks trading above their respective 40-day moving averages (DMAs) to assess the technical health of the stock market and to identify extremes in market sentiment that are likely to reverse. Abbreviated as AT40, Above the 40 is an alternative label for “T2108” which was created by Worden. Learn more about T2108 on my T2108 Resource Page. AT200, or T2107, measures the percentage of stocks trading above their respective 200DMAs.
Active AT40 (T2108) periods: Day #1 over 20% (1st day of overperiod ending an 11-day oversold period), Day #17 under 30%, Day #24 under 40%, Day #29 under 50%, Day #45 under 60%, Day #98 under 70%
Daily AT40 (T2108)
")
Black line: AT40 (T2108) (% measured on the right)
Red line: Overbought threshold (70%); Blue line: Oversold threshold (20%)
Weekly AT40 (T2108)

*All charts created using freestockcharts.com unless otherwise stated
The charts above are my LATEST updates independent of the date of this given AT40 post. For my latest AT40 post click here.
Related links:
The AT40 (T2108) Resource Page
You can follow real-time T2108 commentary on twitter using the #T2108 or #AT40 hashtags. T2108-related trades and other trades are occasionally posted on twitter using the #120trade hashtag.
Be careful out there!
Full disclosure: long UVXY puts, long ITB calls and calendar call spread, other positions mentioned above.
*Charting notes: FreeStockCharts.com stock prices are not adjusted for dividends. TradingView.com charts for currencies use Tokyo time as the start of the forex trading day. FreeStockCharts.com currency charts are based on Eastern U.S. time to define the trading day.