
AT40 = 76.3% of stocks are trading above their respective 40-day moving averages (DMAs) (1st day overbought)
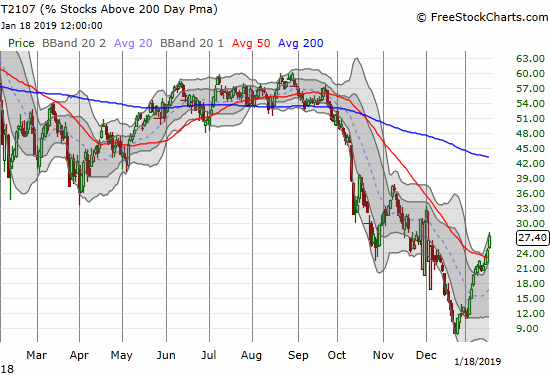
AT200 = 27.4% of stocks are trading above their respective 200DMAs (6-week high)
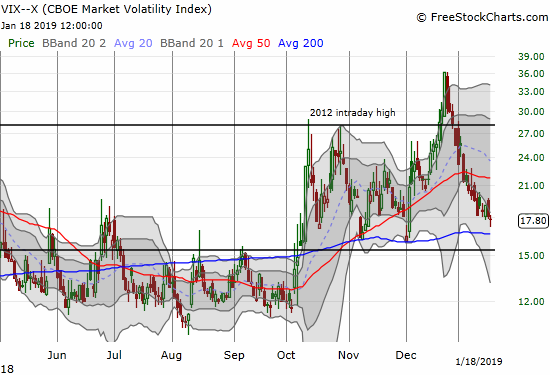
VIX = 17.8
Short-term Trading Call: cautiously bullish
Commentary
I noted in my last post that the signs of exhaustion in the major indices gave way to more and more breakouts. That momentum reached its logical conclusion much faster than I expected with a resounding surge into overbought territory. AT40 (T2108), the percentage of stocks trading above their 40-day moving averages (DMAs), went from a picture-perfect tap at the 70.0% threshold for overbought on Thursday to a surge to 76.3%. Time and time again, buyers have stepped up to the challenge of recovering from last month’s historic plunge into oversold territory.
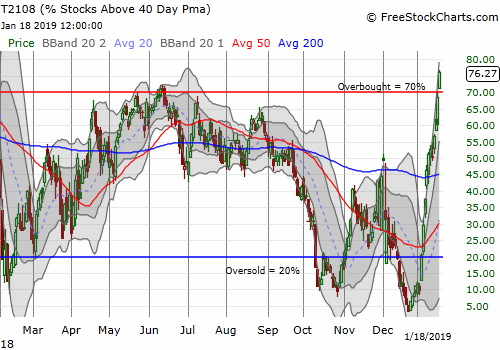
AT200 (T2107), the percentage of stocks trading above their respective 200DMAs, is still low but looking healthier and healthier.
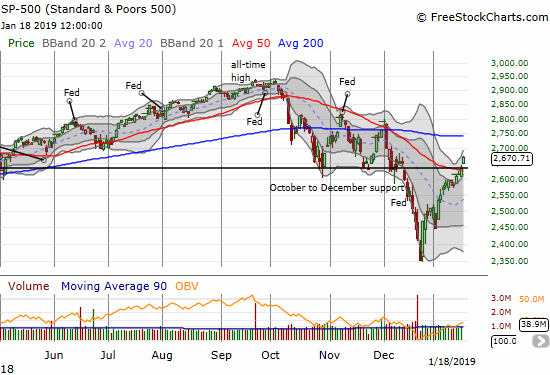
On Wednesday, the S&P 500 looked like it could come up short in following the 50DMA breakouts of the tech-laden indices. All doubts were resoundingly swept away on Friday’s rally. Resistance at the 200DMA is now in play.
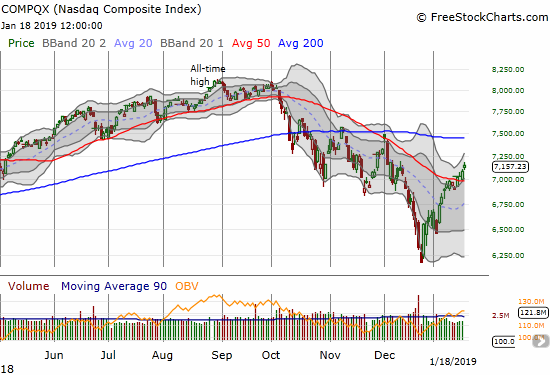
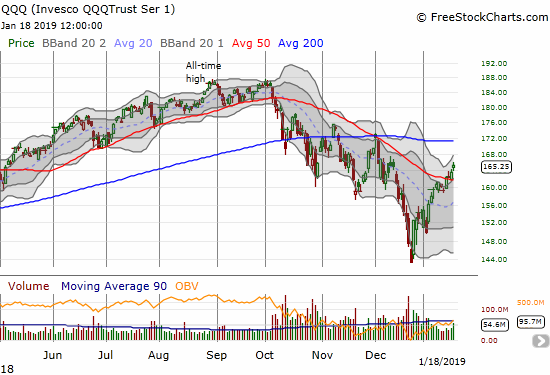
The NASDAQ and the Invesco QQQ Trust (QQQ) continued their bullish moves higher.
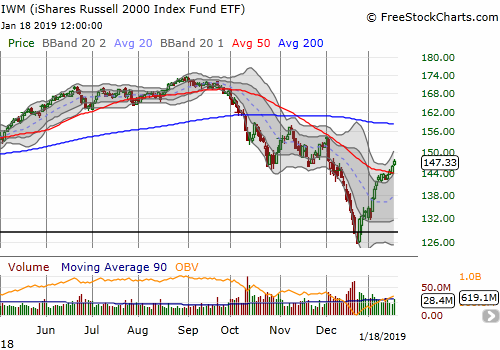
The iShares Russell 2000 ETF (IWM) also confirmed its 50DMA breakout.
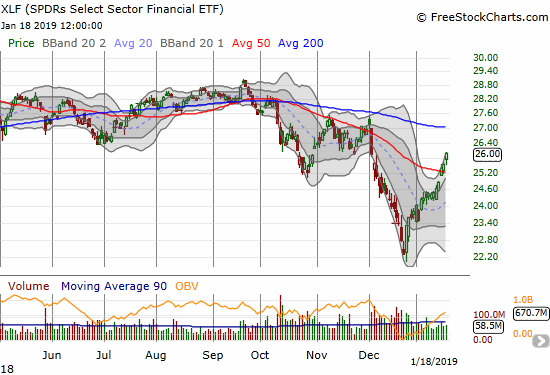
Financials continue to impress me the most. The Financial Select Sector SPDR ETF (XLF) out-performed again, this time with a 1.7% gain which of course made me wish I could have summoned the fortitude to hold onto my fistful of call options all the way through expiration!
Despite the good cheer on Wednesday, the volatility index, the VIX, managed to rally. This time, the good cheer managed to push the VIX to a new low for the year. Still, the momentum for the volatility implosion is clearly waning, so I remain wary of a sudden and abrupt spike higher. My long volatility bets expired with a whimper on Friday. I will wait to restart those hedges (see more below): the ideal re-entry is around or just above the 15.35 pivot.
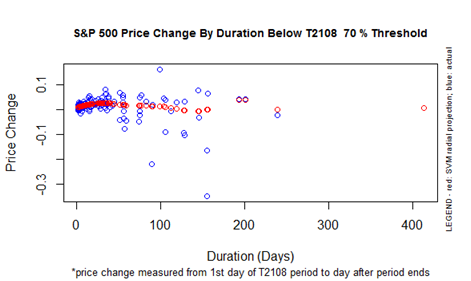
The oversold periods that preceded these major breakouts and confirmations were severe enough to create an historic hiatus for the return to overbought conditions. AT40 traded below the 70% threshold for 151 trading days; only a handful of periods since 1986 have been as long or longer than this 70% “underperiod.” The S&P 500 ended its last overbought period on June 13, 2018. Its price performance from there until the beginning of the current overbought period was -3.7%. The chart below provides some context on these numbers. Note the extremely wide variance in performance in past 70% underperiods for durations around 150 days. Also note the resulting projections of performance were very close to flatline for most durations. (This chart was last updated in 2015. My last full update on my AT40 analyses was in 2016. I am finally underway with the latest update).
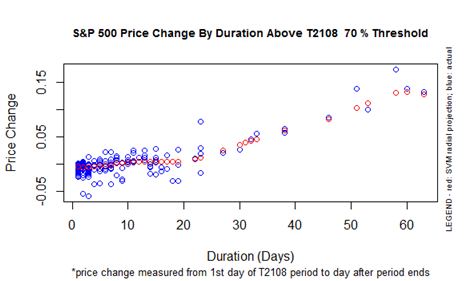
My short-term trading call stays at cautiously bullish although the 50DMA breakouts on the indices are decisively bullish. When I started AT40 trading, I automatically treated overbought conditions as bearish. I learned quickly from extended overbought periods that the actual bearish event is either a drop out of overbought conditions or a repeated failure to break into overbought conditions. In the current case, the very low level of AT200 holds out the prospect for an extended overbought period. As this rally feeds on itself and buyers continue rushing back in the market (sometimes panicking back into the market), individual stocks can keep running to 200DMA resistance levels. At its current pace, AT200 could take another 3 weeks or so to reverse most of its loss from the October breakdown. So my most optimistic projection is for a 3-week (15 trading days) long overbought period. Per the chart below, 15 trading days is on the outer edges of historic norms. After 20 trading days, the S&P 500’s projected performance takes off in a near straight line.
My short-term trades are pretty meager now given my constant profit-taking. My hedges have almost all dried up as well. Going forward, I will focus on buying dips and selling volatility until I get the signal to flip bearish. I expect the thickets of earnings season to deliver a lot of buy-the-dip/sell-the-volatility opportunities. When I get bearish, I will likely assume the script for the Post-Trump Reversal is back in play.
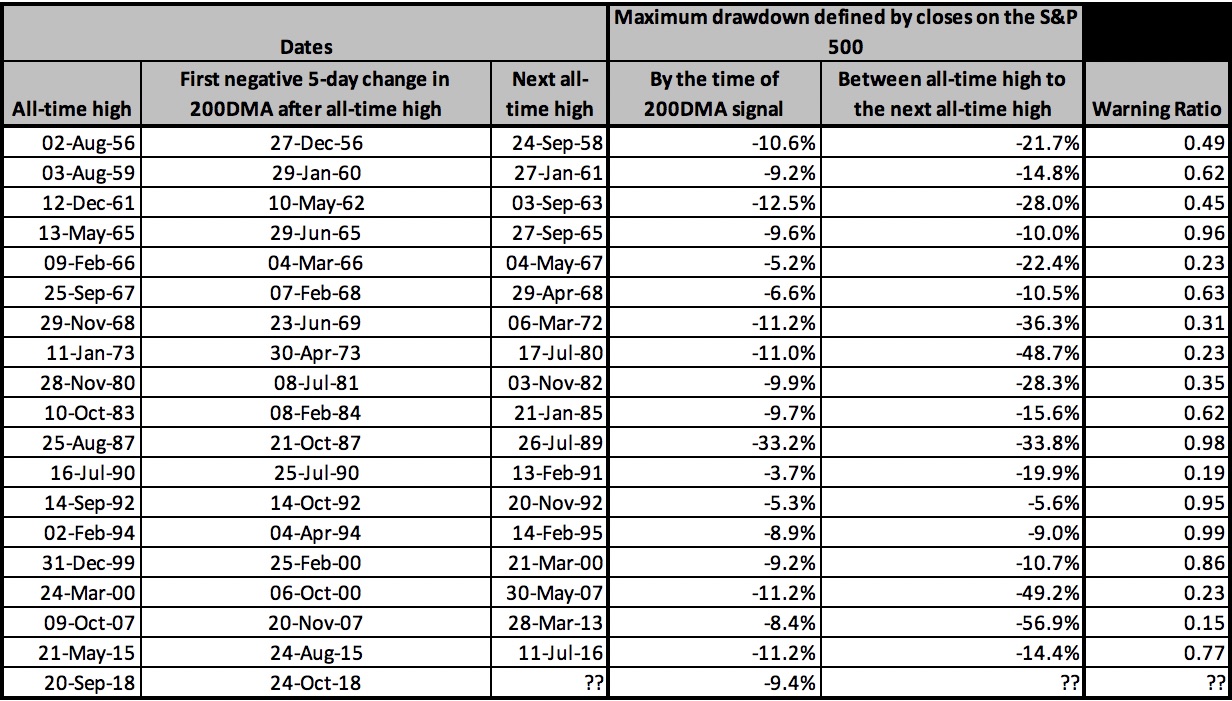
Speaking of bearish, I happened to coin the phrase “Post-Trump Reversal” exactly at the very bottom of the last oversold period. In that same post, I reviewed the 200DMA Signal. If December 24th turns out to be THE bottom before the next all-time high, then the “warning ratio” will be 47% given the S&P 500 was at a 19.8% loss at the time. Of the 19 times the 200DMA Signal triggered since 1951, the last correction would rank as the 9th worst in terms of the additional selling after the 200DMA experienced its first 5-day decline. In other words, there is no historic reason to believe that this sell-off must get worse than last month’s gut-wrenching low….getting worse would mean pushing closer to historic extremes and closer to historic buying opportunities.
I find it helpful to remember that the day before the market made its climactic bottom, U.S. Treasury Secretary Steve Mnuchin pulled together a “Plunge Protection Team” (PPT) of various bankers. Together, they “verified” that the financial system had ample liquidity. While their soothing words clearly failed to calm markets the next day, perhaps that last puking of stocks forced the PPT into direct action. Whatever they did…it clearly worked amazingly well! As a reminder the day after Christmas the S&P 500 gained 5.0%.
Fundamental news is of course running in the background of all these remarkable technicals. The latest potentially positive catalyst is a fresh report of conciliatory talk from China over trade tensions. Until talk and rumor become action, I put little weight on these headlines. Interestingly, the rallies on positive news headlines could set the market up for a major sell the news event when/if trade tensions finally end with some kind of deal. Ironically, a trade resolution should clear the path for the Federal Reserve to resume/continue its tightening of monetary policy. According to the CME FedWatch tool, the market is not expecting another rate hike through at least January of next year, so talk of rate hikes in this environment should weigh heavily on the market. In the meantime, long-term bond yields are on the march higher. The iShares 20+ Year Treasury Bond ETF (TLT) lost 0.5% and closed a post-Fed gap up from December.
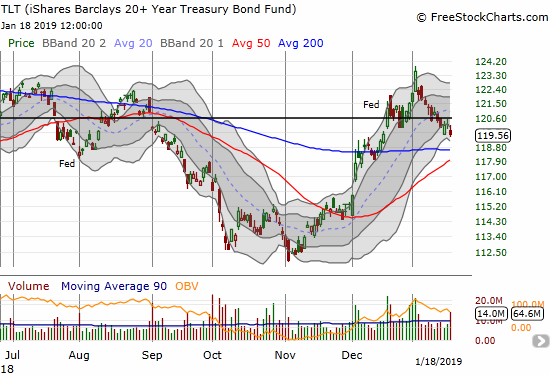
CHART REVIEWS
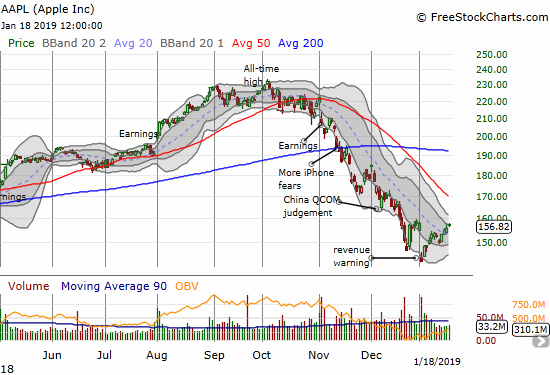
Apple (AAPL)
AAPL is a good representative of the market’s stubborn march even though the stock is severely under-performing the general market. AAPL started the year with a jarring revenue warning that seemed to validate my concerns for the coming earnings season. AAPL made its low for the year on that day. Last week, AAPL finished closing that gap. The stock almost looks ready to challenge its downtrending 50DMA resistance for the first time since October.
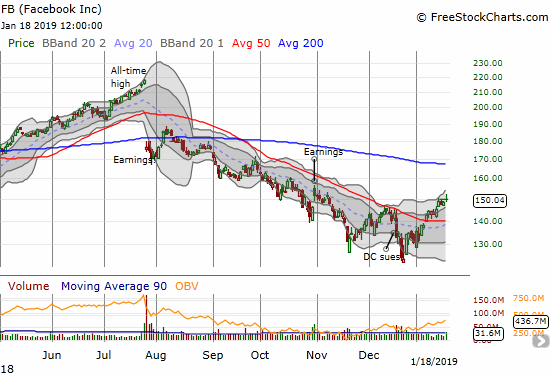
Facebook (FB)
FB is also on a stubborn recovery mission. It was one of the early stocks to break out above its 50DMA resistance this year. The move was enough to deliver some salvage value from my October pre-earnings trade. I rolled those funds into a calendar call trade, the short side expired worthless on Friday. FB next reports earnings after hours on January 30th. I am tempted to play those earnings long, but I think the cleaner opportunity will be post-earnings.
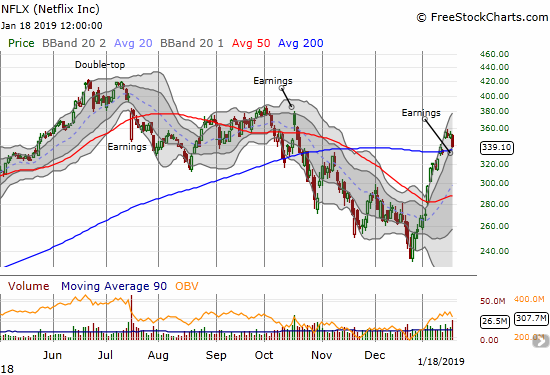
Netflix (NFLX)
NFLX became a good example of a stock with a greater post-earnings opportunity when compared to the expense of buying options ahead of earnings. The stock “only” lost 4.0% after opening barely down 1%. That moved wiped out a lot of loft premium on pre-earnings options plays. With the 200DMA promising to hold as support for the day, I sold short a $340 put expiring the same day and was able to extract $2.50 of premium from the play. Selling that same put ahead of earnings would have earned a lot more profit but with an unacceptable amount of risk (for me, especially since I remain bearish on NFLX at these lofty valuations and from last summer’s double-top).
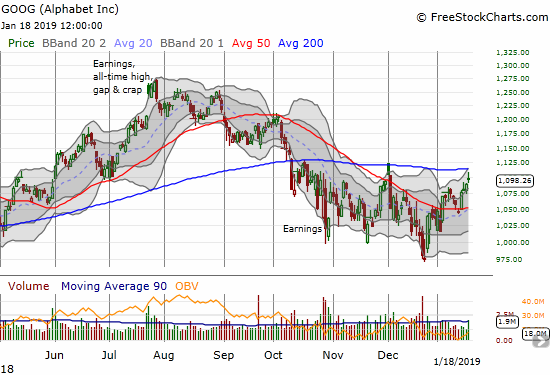
Alphabet (GOOG)
GOOG broke through its 50DMA barrier early in the month. The move was not too remarkable because the stock is effectively stuck in a 3-month trading range. Moreover, GOOG broke out to start December trading only to suffer an immediate rejection from 200DMA resistance. Another 200DMA test is here.
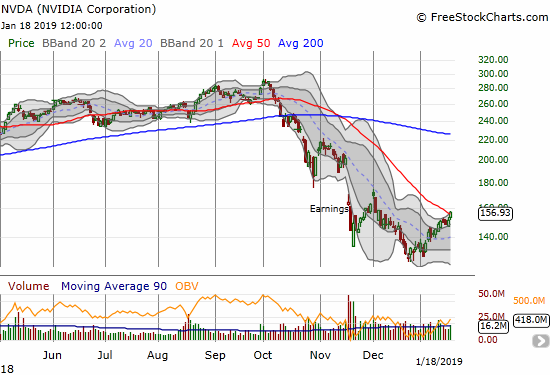
Nvidia (NVDA)
NVDA is up 23.6% from its 19-month low. NVDA suffered so mightily since the October breakdown that this strong rebound only just barely managed to push the stock over declining 50DMA resistance on Friday. Assuming upside to 200DMA resistance, I like NVDA as a top pick for buying in an extended overbought period. Earnings are not until February 7th or so.
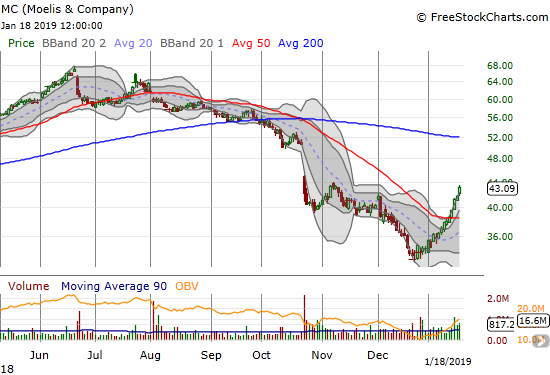
Moelis & Company (MC)
MC is a financial services company that looks like it is benefiting from the run-up in financials. MC is up a whopping 34% from a 2-year high…and it is still off 35.6% from its all-time high set in June. Goldman Sachs (GS) started the stock at a buy on November 6th. The stock is finally back to its close on that day. The stock is hot, up in a near straight line, and following along its upper Bollinger Band (BB), so it is a very high risk buy here. However, buying the dips down to a test of 50DMA support makes sense to me. Earnings are not until February 6th after market.
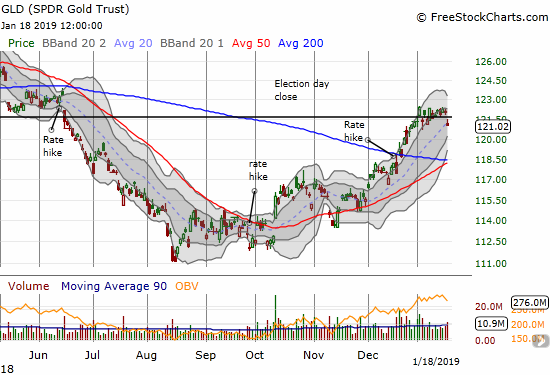
The SPDR Gold Shares (GLD)
The stock market is refreshed from earlier signs of exhaustion, but GLD’s exhaustion seems confirmed. The ETF gapped down on Friday in a move that has the look of confirming resistance from its close on election day 2016. I will be looking to make another short-term trade on a test of converged 50 and 200DMA support. I particularly like the way the 50DMA is trending upward now.
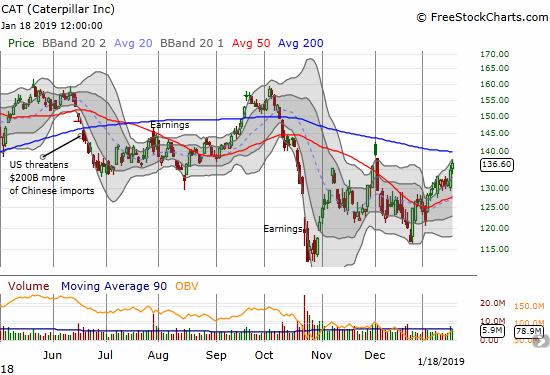
Caterpillar (CAT)
My last hedges using CAT put options expired worthless as the stock surged to what looks like a fresh test of 200DMA resistance. Earnings are coming before the market on January 28th. I plan to make a pre-earnings exception for this cycle and make sure I am net short the stock ahead of that time (I am still bearish on earnings). For the coming week, I will not refresh my hedge unless the stock gets rejected from 200DMA resistance.
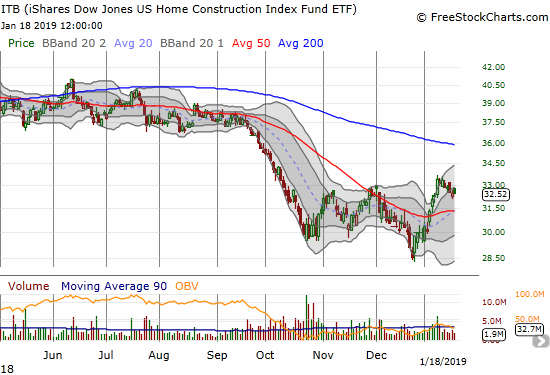
The iShares US Home Construction ETF (ITB)
ITB did not enjoy the market’s rally last week. The under-performance is one of the few negatives I see in the trading action. ITB is up 13.9% from the climactic December 24th low and is now just barely out-performing the S&P 500 with its 13.6% gain from that same low. Given the seasonal trade on home builders is a bet on out-performance, I consider this narrowing of the spread to be a likely early sign that the trade is coming to an (early) end.
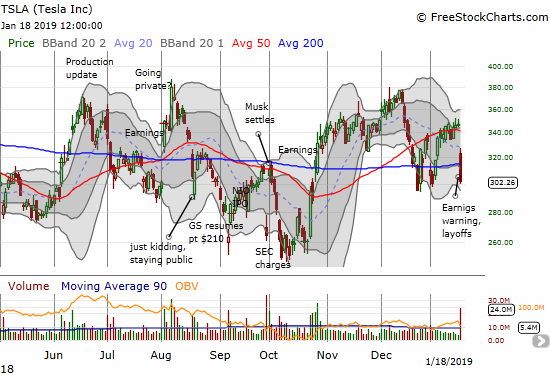
Tesla (TSLA)
TSLA dropped 13.0% on bad financial news. The stock is still just stuck in the middle of an on-going trading range that now dates back about 2 years. The gap down caught me betting on a challenge of the $380 level using a calendar call spread. I quickly opened up a put spread on the gap down assuming that 200DMA support would not hold under the weight of the poor news. That put spread turned out to be too conservative of a short-term bet.
Elon Musk’s letter to employees had two key quotes that both augur for more bad news in the future. First, TSLA will continue to struggle making money and thus likely need to raise more capital after all in the near future.
In Q3 last year, we were able to make a 4% profit. While small by most standards, I would still consider this our first meaningful profit in the 15 years since we created Tesla. However, that was in part the result of preferentially selling higher priced Model 3 variants in North America. In Q4, preliminary, unaudited results indicate that we again made a GAAP profit, but less than Q3. This quarter, as with Q3, shipment of higher priced Model 3 variants (this time to Europe and Asia) will hopefully allow us, with great difficulty, effort and some luck, to target a tiny profit.
Musk suggested his remaining employees will need to sacrifice even more blood, sweat, and tears just to help the company survive. I worry about the sustainability of such workplace pressures, especially if Musk is expecting his employees to dedicate anything close to the amount of time (nearly 100%!) he does to TSLA.
There are many companies that can offer a better work-life balance, because they are larger and more mature or in industries that are not so voraciously competitive. Attempting to build affordable clean energy products at scale necessarily requires extreme effort and relentless creativity, but succeeding in our mission is essential to ensure that the future is good, so we must do everything we can to advance the cause.
As a result of the above, we unfortunately have no choice but to reduce full-time employee headcount by approximately 7% (we grew by 30% last year, which is more than we can support) and retain only the most critical temps and contractors. Tesla will need to make these cuts while increasing the Model 3 production rate and making many manufacturing engineering improvements in the coming months.
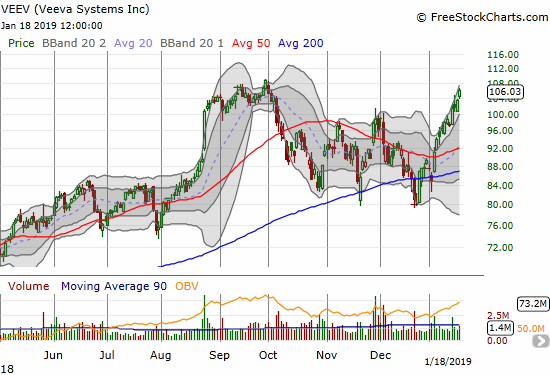
Veeva Systems (VEEV)
VEEV is an example of a growing group of stocks that are in outright bullish positions. The stock remained relatively resilient the past few months. I was too early in betting on the stock with a calendar call spread, but the current sprint was strong enough to deliver decent salvage value in the expiring long side of the play. I just wish I had been attentive enough to return to VEEV for the bounce(s) from 200DMA support and/or the 50DMA breakout.
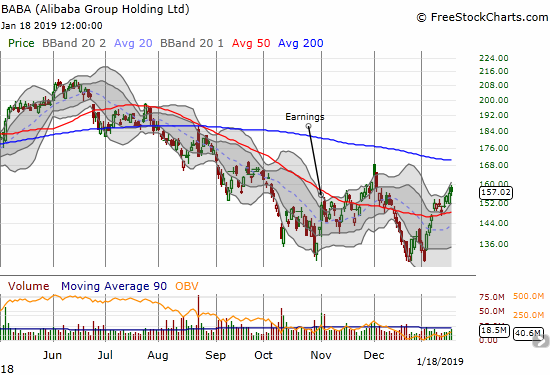
Alibaba Group (BABA)
BABA is holding on to a 50DMA breakout and looks like a trade to 200DMA resistance. Earnings are coming January 30th pre-market.
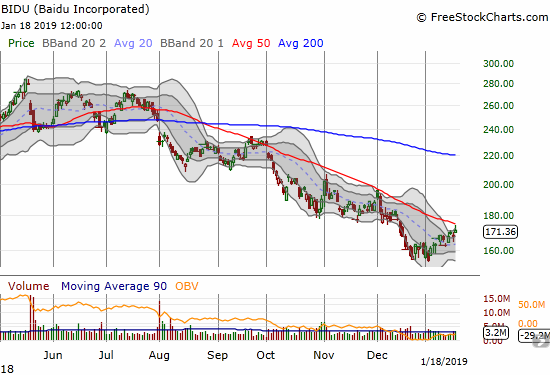
Baidu (BIDU)
BIDU almost lost half its value from its all-time high, so the current 11.0% bounce from the January 3rd low looks relatively weak. Resistance from the 50DMA has held over three tests during this downtrend. Friday’s fade from 50DMA resistance is a bad sign, BUT a confirmed breakout would be exceptionally bullish for BIDU. Earnings do not arrive until February 14th or so.
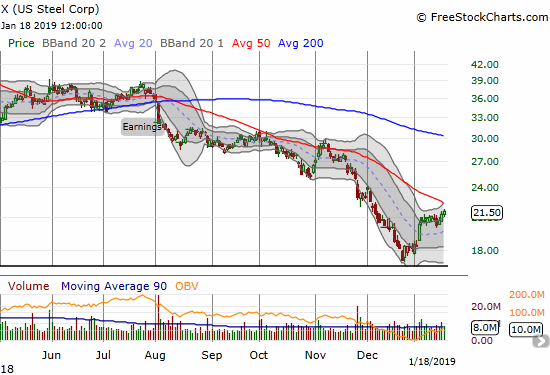
U.S. Steel (X)
U.S. Steel is up 24.4% from its December low which came close to testing the 2009 intraday low. X lost a whopping 63.0% from its 2018 high and stands out as a stark example of the failure of trade policies to generate its range of intended effects. X should soon test 50DMA resistance, but I have little confidence it can sustain that breakout. This stock would be near the top of my list to short if my short-term trading signal flips bearish.
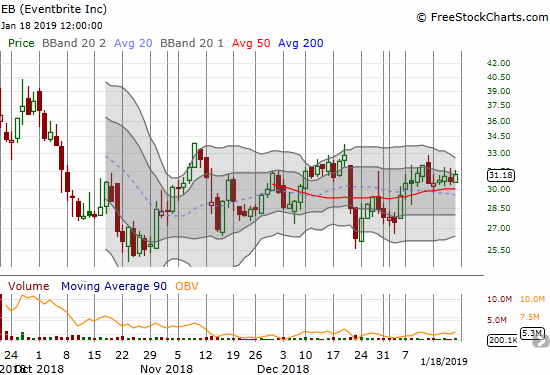
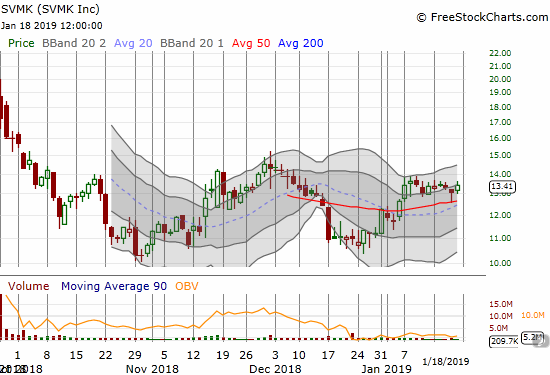
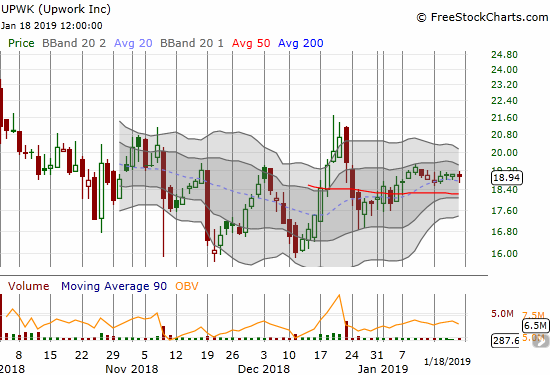
Eventbrite (EB), Survey Monkey (SVMK), Upwork (UPWRK)
There are three recent IPOs I periodically check which all happen to have similar trading patterns: tight trading ranges persisting since the October stock market breakdown. These ranges make the stocks relatively resilient, and I am waiting and watching to see whether these consolidation periods become coiled springs out of low-volume trading conditions.
— – —
FOLLOW Dr. Duru’s commentary on financial markets via email, StockTwits, Twitter, and even Instagram!
“Above the 40” uses the percentage of stocks trading above their respective 40-day moving averages (DMAs) to assess the technical health of the stock market and to identify extremes in market sentiment that are likely to reverse. Abbreviated as AT40, Above the 40 is an alternative label for “T2108” which was created by Worden. Learn more about T2108 on my T2108 Resource Page. AT200, or T2107, measures the percentage of stocks trading above their respective 200DMAs.
Active AT40 (T2108) periods: Day #11 over 20%, Day #9 over 30%, Day #8 over 40%, Day #7 over 50%, Day #3 over 60%, Day #1 over 70% (1st day overbought, ending 151 days below 70%)
Daily AT40 (T2108)
")
Black line: AT40 (T2108) (% measured on the right)
Red line: Overbought threshold (70%); Blue line: Oversold threshold (20%)
Weekly AT40 (T2108)

*All charts created using freestockcharts.com unless otherwise stated
The T2108 charts above are my LATEST updates independent of the date of this given AT40 post. For my latest AT40 post click here.
Related links:
The AT40 (T2108) Resource Page
You can follow real-time T2108 commentary on twitter using the #T2108 or #AT40 hashtags. T2108-related trades and other trades are occasionally posted on twitter using the #120trade hashtag.
Be careful out there!
Full disclosure: net long AAPL, long FB calls, long GLD, long ITB calls, long TSLA call and put spread,
*Charting notes: FreeStockCharts.com stock prices are not adjusted for dividends. TradingView.com charts for currencies use Tokyo time as the start of the forex trading day. FreeStockCharts.com currency charts are based on Eastern U.S. time to define the trading day.
It would helpful to see what the effect on stocks/ETN/ETF on the start of the wall or lack of one, put & call opportunities
The Wall stalemate has not had a noticeable impact on stocks unless the argument is stocks could be even higher. The shutdown came just ahead of the big Christmas Eve meltdown in the stock market, so perhaps part of that sell-off had to do with fears about the government shutdown. But as we know now, that day was a major bottom.