
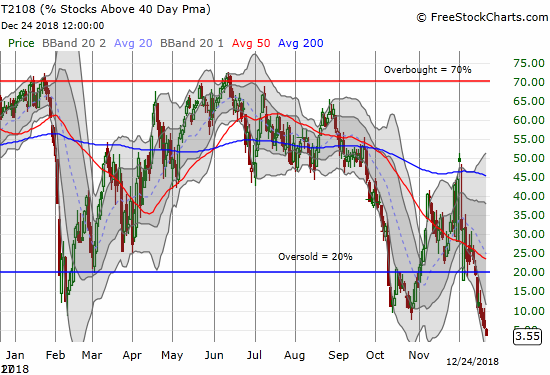
AT40 = 3.6% of stocks are trading above their respective 40-day moving averages (DMAs) (oversold day #7, 10-year low!)
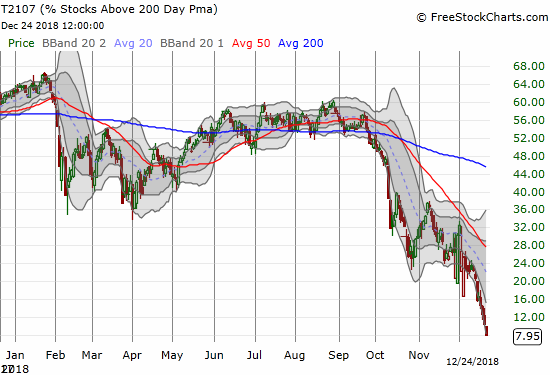
AT200 = 8.0% of stocks are trading above their respective 200DMAs (9 1/2- year low!)
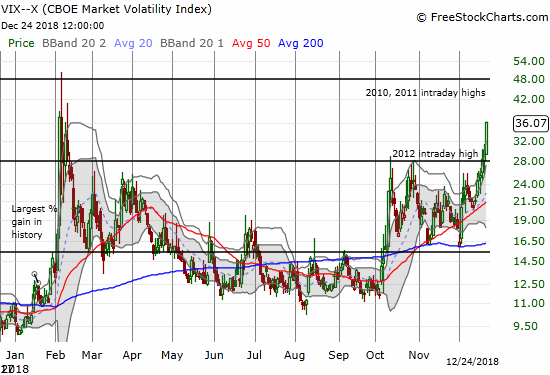
VIX = 36.1 (1-day gain of 20.0%, 10 1/2- month high)
Short-term Trading Call: bullish (oh so many caveats below!)
Commentary
Although it’s been said many times, many ways….the plunge continues….no Santa Claus rally for us.
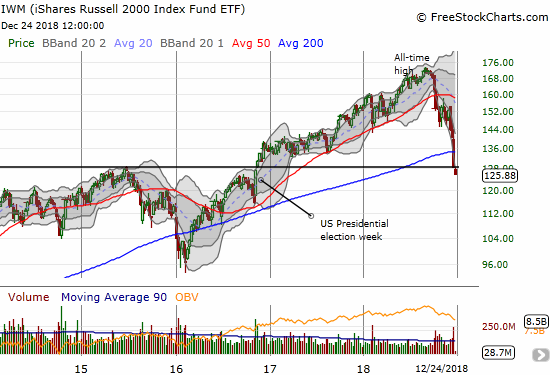
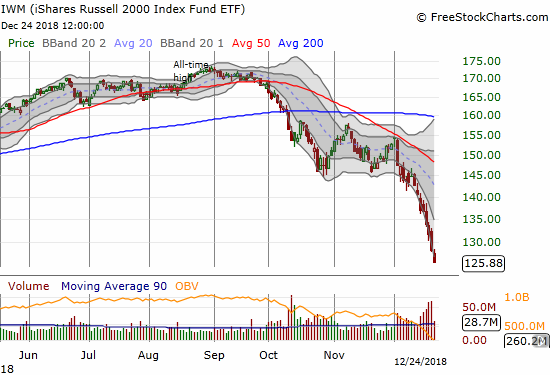
In a day and month full of historic extremes, it is hard to pick any particular focus of calamity. Still, the epic reversal in small caps, iShares Russell 2000 ETF (IWM), stands out in stark relief. On Christmas Eve, just as we should be expecting gifts from Treasury Secretary Steven “Santa Claus” Mnuchin’s modern incarnation of the Plunge Protection Team, IWM officially reversed ALL of its 2016 breakout. The weekly chart below shows how little time it took to wipe out what was almost two years of breathtaking upside.
The market sell-off is so extreme that my favorite technical indicator, AT40 (T2108), the percentage of stocks trading above their respective 40-day moving averages (DMAs), has had little else to say beyond the first day of this jarring oversold period. AT40 closed the day before Christmas at 3.6%; almost no stock in the entire stock market currently trades above its 40DMA. AT40 last traded this low in October, 2008 as the financial crisis was picking up steam. Before that chaotic period, I have to go back to the crash of 1987 to see AT40 plumb such epic depths. In the short-term, the stock market is completely washed out of any optimism.
There are almost no stocks left trading above their respective 200DMAs either. AT200 (T2107) closed at 7.8%, a 9 1/2 year low. Since the October sell-off, AT200 has consistently flagged deepening technical damage in the stock market; now AT200 just confirms and reconfirms the stock market is deep in bear market territory. This is a market where breakdowns and lengthening downtrends dominate the storyline.
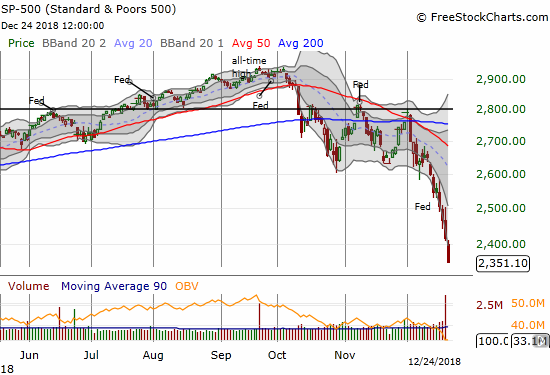
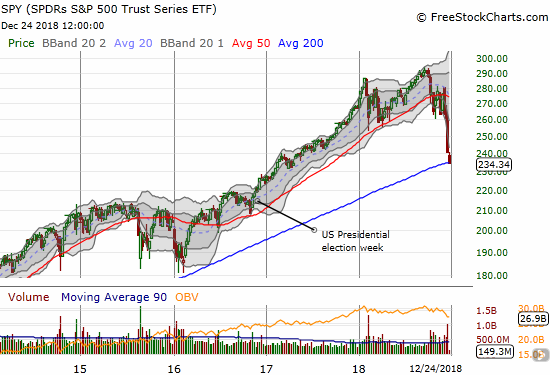
All the major indices sold off sharply going into Christmas. The shortened pre-holiday trading provided no relief. Not only was this the worst loss ever for the last trading day before Christmas, but also the S&P 500 had never before lost more than 1% on this day. The S&P 500 (SPY) dropped and did not stop until it lost 2.7%. The index is now down an incredible 15.8% month-to-date for December (the worst December since 1951 was a 9.4% loss in 1980) and down 12.1% for the year. For perspective, the index has suffered only two losing years since 2008’s gut-wrenching 38.5% loss. Those losing years were fractional losses in 2011 and 2015. We have truly been spoiled by the Federal Reserve’s easy money policies.
Ironically enough, after the stock market quickly wiped out its post-election (2018) euphoria last month, I wrote the following:
I am quite dismayed to note that the S&P 500 has sold off in the immediate wake of all but two of the Fed’s meetings this year….guess what I will be doing in preparation for December’s meeting!?
I did not position myself bearishly because by the time of the Fed meeting, the stock market was already deep in the throes of its third oversold day. Deeply oversold conditions offer poor risk/reward short trades. Yet, the S&P 500 has amazingly managed to lose another 6.2% in the three trading days since the Fed’s decision on monetary policy. This is a second derivative market if there ever was one!
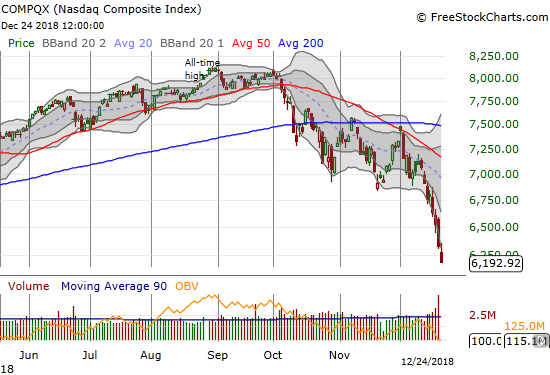
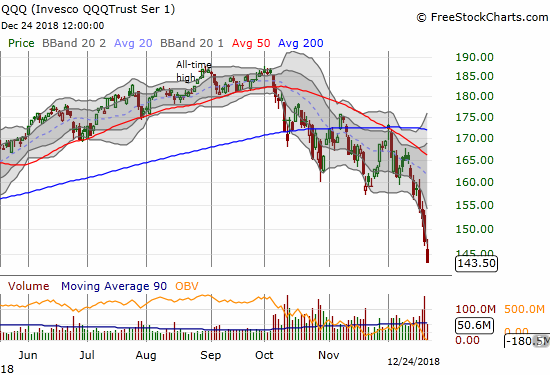
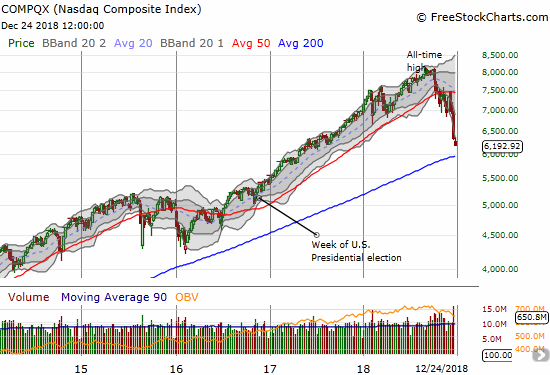
The NASDAQ and the Invesco QQQ Trust (QQQ) sold off for 2.2% and 2.8% losses and new 17 and 15-month lows respectively.
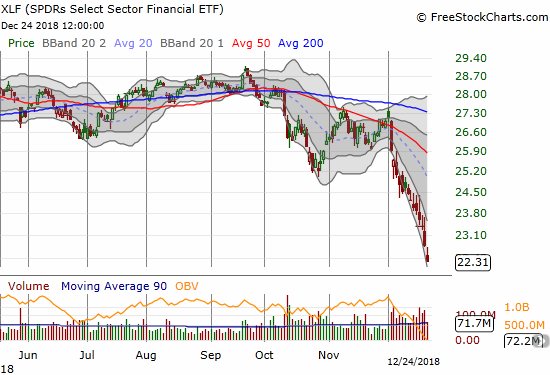
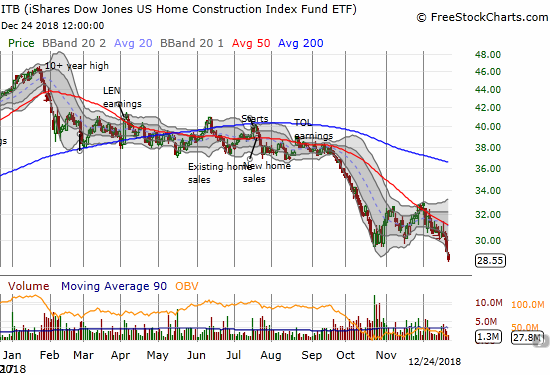
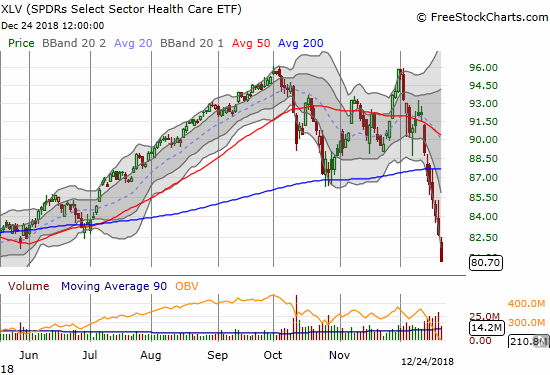
The sickening plunges are repeated over and over almost no matter where we look. The iShares Russell 2000 ETF (IWM) lost 1.9% for a 25-month low. The Financial Select Sector SPDR ETF (XLF) lost 2.1% for its own 25-month low (Goldman Sachs (GS) last week completed a post-election (2016) reversal and is leading the way for the entire XLF to do the same). The iShares US Home Construction ETF (ITB), which tried to warn us for much of the year of the coming calamity, lost another 2.0% and closed near a complete reversal of 2017’s gains. Even Health Care Select Sector SPDR ETF (XLV) got hit with a 2.4% loss as its roof of “safety” came tumbling down.
In my last Above the 40, I described the volatility index, the VIX, as a “bright” spot for the oversold period because it finally showed a relatively greater level of fear. That fear really got going on Monday. The VIX surged 19.8% in a long overdue challenge of the closing high of 2018. With the 2012 intraday high behind it, the VIX can now aim for even higher heights of extremes.
All this epic carnage and the historic depths beg the obvious question: is this a time to buy? Well, it SHOULD be an obvious time to back up the truck. My short-term trading call has stayed bullish ever since the first day of the oversold period. I was waiting for the VIX to spike before getting aggressive on the buy side. On Friday, I finally added to my shares of ProShares Ultra S&P500 (SSO). I did a little more buying in the middle of Monday’s even larger VIX spike. For example, I saw some key stocks burst into positive territory, and I responded by buying a few put options on ProShares Ultra VIX Short-Term Futures (UVXY).
Still, I have yet to get truly aggressive because I cannot fully shake the demotivating burdens of a bear market: no support, only fleeting signs of buying interest. Moreover, I have a working thesis in the back of my mind that pattern matches with the 2008-2009 period where the Fall sell-off was the setup for the even larger Winter sell-off. I want to believe the major January to March or so sell-off I am anticipating is getting condensed into December.
From the longer-term perspective, I never did unload any more of my longer-term positions after the first purge about two weeks ago. With almost all my hedges closed out, I get to watch this treacherous trading action in horror along with the majority of market watchers. Hardier long-term investors can start allocating a small fraction of cash here, like 20%, and then allocate in chunks of 10% for every additional 10% sell-off (I am borrowing from a strategy someone shared with me on StockTwits). This strategy should cover the worst of the worst sell-off scenarios.
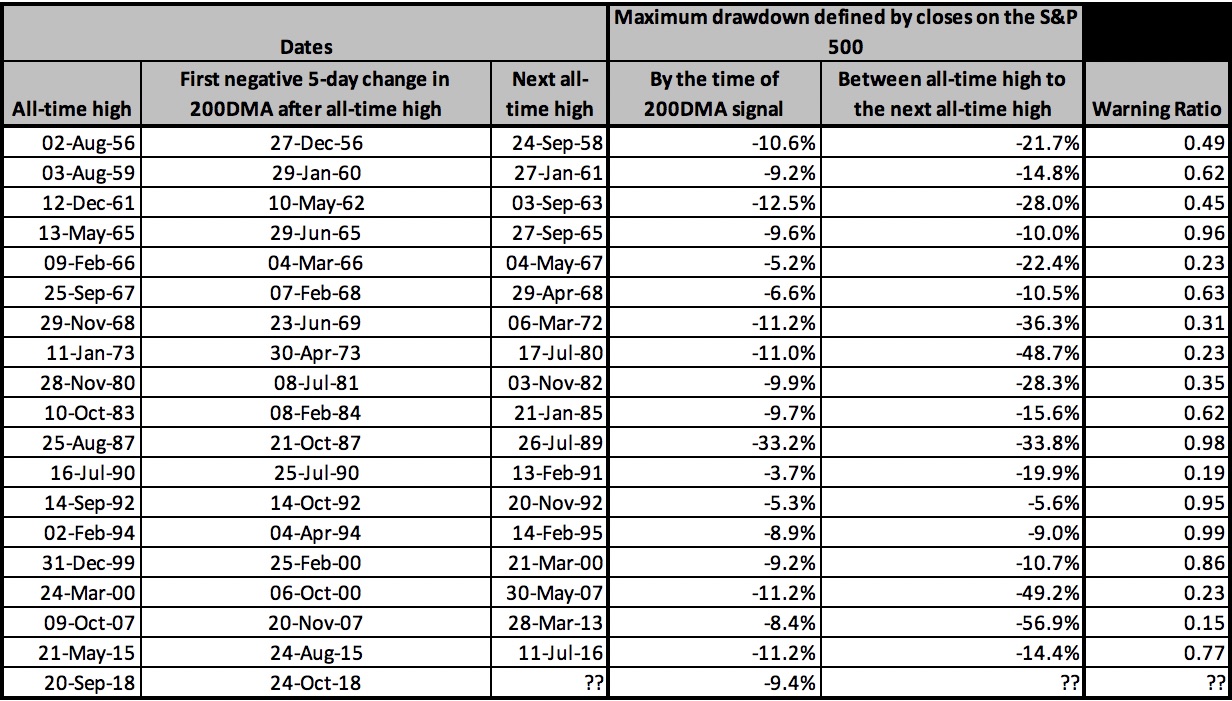
However, in a second derivative market, the possibility horizon is very broad. Using the history of “the 200DMA Signal,” the theoretical worst case scenario is the 0.15 “warning ratio” from 2007 to March, 2013: an eventual 63% sell-off from 2018’s all-time high. Yes, I just gulped hard after typing that. The current warning ratio is 0.47 as the S&P 500 is currently 19.8% off its all-time high. This is the 10th worst of the 19 200DMA Signals since 1951.
The Post-Trump Reversal
This sell-off is so epic and so deep, it deserves a name that can immediately and easily identify it. I am now calling it the “Post-Trump Reversal.” The phrase “post-election” is too ambiguous. “Post-2016-election” or “post-election-2016” is too clumsy and does not fixate on a prime characteristic of this particular market. This reversal has wiped away a large portion of the stock market’s gains since the election of Donald Trump as President of the United States on November 8, 2016. In some cases, all gains and then some are gone. Just as ITB warned us almost all year of a coming calamity, Goldman Sachs, XLF, and IWM are all up next as big warnings of what could be in store for the rest of the stock market relative to the election of Trump. I am taking these warnings seriously: the market has to prove a LOT otherwise from here!
As traders and investors, we should focus on making money over making political points. I try to follow this guidance in this blog as much as possible, but sometimes, like now, the politics become unavoidable. In this case, President Trump has inserted himself into the center of the trials, tribulations, and celebrations of the stock market. He personally forged the market into his own gauge of popularity and performance. Trump’s market commentary in total is quite revealing about the fragility of financial conditions, and it provides important context. As full disclosure, I am not registered with any political party (I am a former Democrat), but I voted against Trump and for Hillary Clinton for President in 2016. I hope I have sufficiently kept my politics from distracting from my most important points below.
In mid-October, the stock market was in the early stages of its complete breakdown. I read and heard the exuberant platitudes coming from the administration over the economy and worried that the government was reaching a point of maximum hubris.
…Larry Kudlow, the leader of President Trump’s National Economic Council, is beating a steady drum of unapologetic and triumphant confidence. In a CNBC interview, Kudlow issued a sound bite that *I* am confident will one day in the not-so-distant future sound cringeworthy to those of us who follow economics. Kudlow declared: “We are in a hot economic boom. There’s no end in sight.”
…as an investor and particularly as a trader, I cannot help but think about the contrary implications of important government officials claiming that the economic good times will continue as far as the eye can see. Such claims defy experience and the laws of economic/business cycles. Such claims help form a foundation of hubris which can lead to policy errors. My unavoidable wariness feels even more poignant when in parallel I stare at charts showing a stock market violently and sharply falling off its all-time highs.
From “Confidence and A Conditional Reprieve Amid Oversold Lows” by Dr. Duru, October 13, 2018.
I only wish I had heeded my own wariness and just determined to go bearish and stay bearish! What unfolded in the following 2+ months pretty much confirmed my concerns. The final confirmation will come in the form of worsening economic numbers in 2019 that I am sure the administration (and the Fed?) will at first dismiss as “air pockets” or “temporary headwinds.” Note well that the economy need not go into a recession for the stock market to continue deflating given the stellar run-up was predicated on the kinds of lofty optimism expressed by Kudlow. Even now, consumer confidence is still hovering around 20-year highs. There is a lot of room to the downside to go to just more “normal” levels of confidence.
The hubris and the subsequent repudiation of that hubris is summed up well in the following tweet and commentary from CNBC’s Carl Quintanilla.
At the time President Trump celebrated the great news from Financial markets and wildly rising 401k’s, the S&P 500 had finally punched in a new all-time high after an extended recovery from the February swoon. The index had just another three weeks to go before reaching its ultimate top.

President Trump repeatedly and sharply blames the Federal Reserve for everything bad about the stock market since then. Yet, there is a legitimate argument on the side of Chair Jerome Powell. Here is Guy Adami from CNBC explaining the super easy money that Powell is now scrambling to draw down:
Ironically, President Trump is fully aware of the dangers of easy money. As a candidate, Trump warned Americans not to trust Wall Street with their money because the stock market was propped up on excessively low rates. From CNBC on August 9, 2016:
Count Donald Trump among the ranks of those who don’t think too much of the stock market as a sound place to put money.
A day after making a widely watched public address on his economic plan, the Republican presidential nominee advised against betting on Wall Street.
“Donald Trump on the stock market: ‘It’s all a big bubble’” by CNBC, August 9, 2016
The big problem, as Trump sees it: The low interest rate environment fostered by the Federal Reserve that has coincided with a 227 percent market gain since the financial crisis lows.
“If rates go up, you’re going to see something that’s not pretty,” the billionaire businessman told Fox News during a Tuesday morning phone interview. “It’s all a big bubble.”
Apparently, one man’s bubble is another man’s healthy rally. The stock market is still 7.8% higher than that bubble proclamation with rates a lot higher. I understand Trump’s underlying claim: the economy of the previous years was weak and only survived on easy money low rates. The stock market was of course a direct beneficiary of that easy money. Trump offers up the economy of 2017-2018 as a fundamentally healthy one that does not need low rates but can still suffer from suffocatingly high rates. His administration took a healthy economy and super-charged it with a lot of stimulus. The higher rates are a direct response to this strong economy. As the Fed is doing, the President technically should keep people’s focus on the positive reasons for the higher rates.
Trump’s unconventional and persistent badgering of the Fed over the rate hikes is putting a spotlight on a policy error that may be more imagined than real. The sharp and public critique is not only unusual for the way American Presidents treat an independent Federal Reserve, but also it is overshadowing the Fed’s attempt to assuage the market with its communications about flexibility and data dependence. In other words, Trump is likely heightening market fears about rate hikes.
These fears could crank up another notch or two higher in the wake of news that Treasury Secretary Steven Mnuchin assembled bankers as part of a “Plunge Protection Team (PPT).” Interestingly, the statement announcing Mnuchin’s efforts were only posted on Twitter and not directly in the Treasury’s news feed on the government web site (as of the time of this writing). I can only assume the intent was to put the news in a place that garner’s more of the general public’s attention (Twitter once again proving its core value!). From the Treasury’s tweet:
Secretary Mnuchin convened individual calls with the CEOs of the nation’s six largest banks. See attached statement. pic.twitter.com/IEb2kv6dx9
— Treasury Department (@USTreasury) December 23, 2018
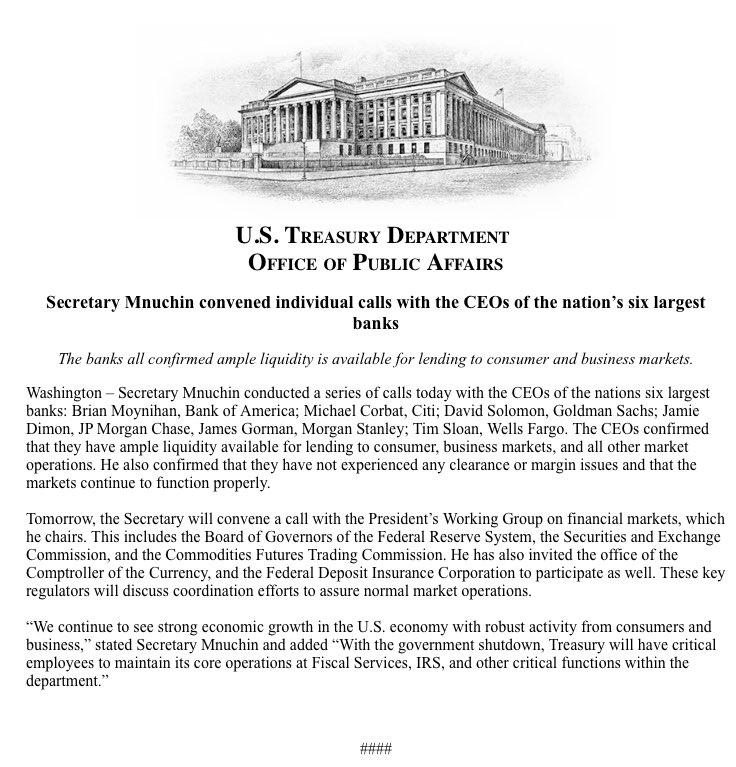
Source: U.S. Treasury on Twitter
I have seen references on Twitter calling this announcement “Liquidity Secured” as a sarcastic reference to Tesla CEO Elon Musk’s false claims that funding was secured to take the company private for $420/share. The move by the Treasury smells like desperation, but I am not taking it lightly. The move represents another sign that the Administration reached peak hubris and now recognizes all is not well. The market is so deeply oversold that the government likely does not have to do much to kindle a sharp rally. My only question now is can the administration or even the Federal Reserve do enough to prevent the Post-Trump Reversal from becoming a FULL reversal? For now, I am assuming that the stock market has to ultimately drive a lot lower still before the Fed is fully ready to capitulate.
CHART REVIEWS
So many charts look so similar: UGLY. After all, only 8% of stocks are still above their 200DMAs. Still, there are a few charts I to post with stories that stand out in the chaos whether bad or good. I used SwingTradeBot to help me find some of the last stragglers trying to hold up critical 200DMA support. (Other stocks still above their 200DMAs not shown below are McDonalds (MCD), Clorox (CLX), and Proctor & Gamble (PG)).
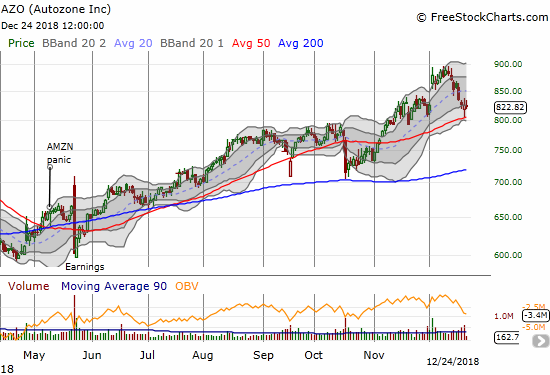
Autozone (AZO)
The auto retailers are standing head and neck above the hapless crowd. AZO is just off its all-time high with a mild pullback that looks like a routine test of 50DMA support.
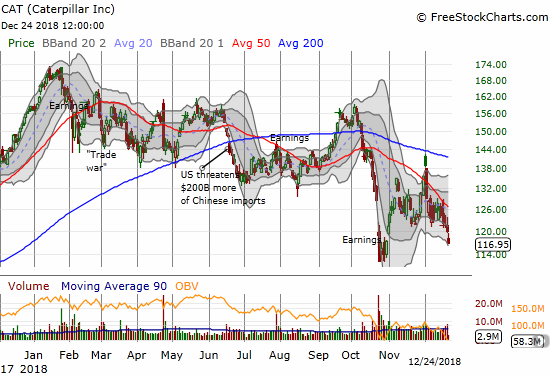
Caterpillar (CAT)
After sharply pulling back from the premature post-G20 optimism, CAT held its ground while the rest of the market plunged this month. The stock’s surprising out-performance made it a poor hedge for about two weeks. That resilience finally ended over the past two trading days. The stock is still holding itself above its 2018 low.
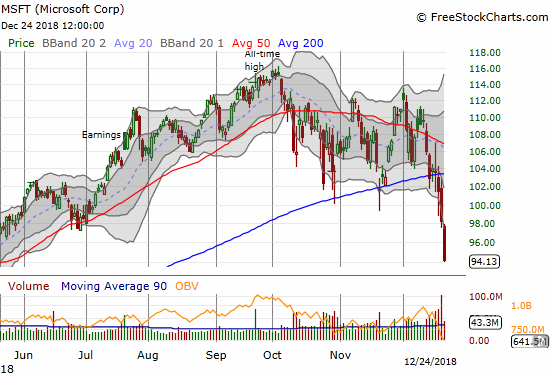
Microsoft (MSFT)
MSFT is one of the last stocks suffering a 200DMA breakdown. MSFT effectively held this support through the October and November sell-offs. December’s bearishness was just too much even for MSFT. The stock market is finally taking down its strongest as investors get more and more desperate to move to cash.
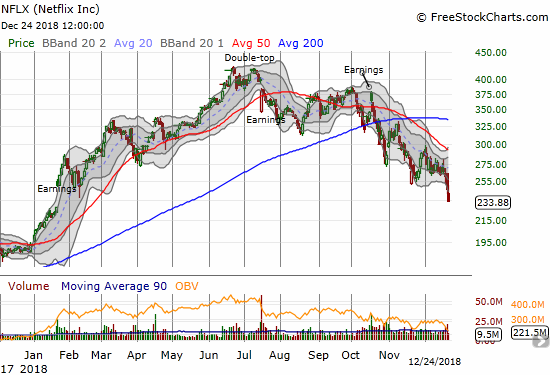
Netflix (NFLX)
Like ITB and like retailers, NFLX was a warning sign that I did not extrapolate enough. I called a top in NFLX over the summer. After its fade from October earnings, I put NFLX on my short list of stocks to fade on rallies. That strategy has worked well, but I was not positioned short during the latest breakdown which took the stock to an 11-month low. NFLX is 44.2% off its all-time high and double-top.
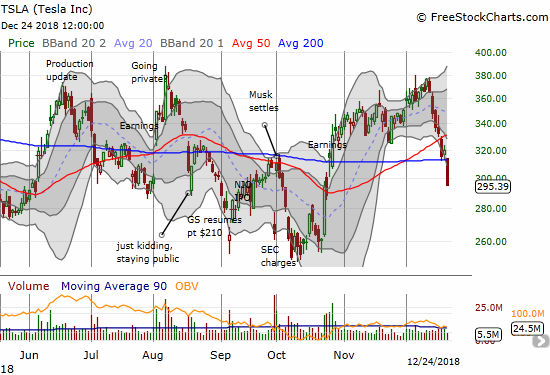
Tesla (TSLA)
It took a while, but the burden of the bear finally caught up to TSLA. The stock plunged 7.6% in a 200DMA breakdown that finally forced TSLA into the company of the vast majority of stocks trading under their respective 200DMAs. Unlike so many stocks, TSLA simply remains stuck in its trading range. Its 2018 low and double bottom is still a 14% drawdown away.
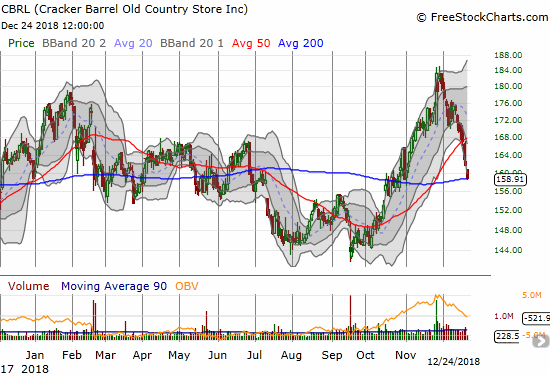
Cracker Barrel (CBRL)
CBRL is one of the rare stocks still trading above its 200DMA. The stock faced down a test of that support on Christmas Eve. Like TSLA, a 200DMA breakdown for CBRL is far from disastrous given the stock’s extended trading range. The run-up in November provided a very brief breakout above this range that held not just in 2018 but also since 2014. Also like TSLA, CBRL is heavily shorted: 24.9% of its float is sold short. TSLA’s bear burden is 23.3% of its float sold short.
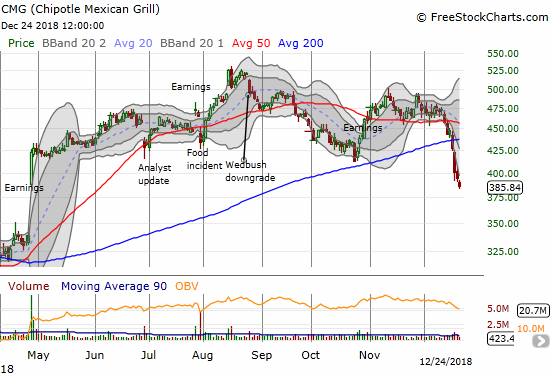
Chipotle Mexican Grill (CMG)
CMG is another stock that took some time joining the majority of stocks suffering a 200DMA breakdown. CMG’s breakdown was sharp with a subsequent 13.1% 3-day loss. CMG is still 34.6% above its 2018 low, but the stock looks ready to fill its large April post-earnings gap up.
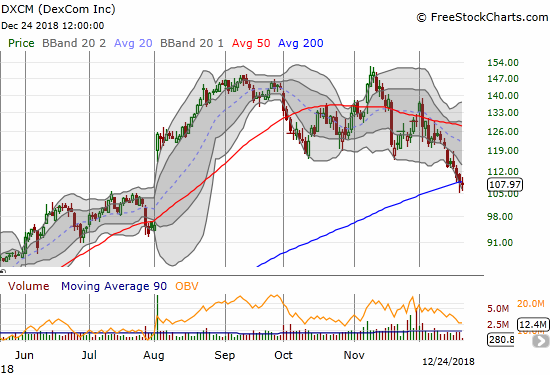
Dexcom (DXCM)
DXCM finally closed below its 200DMA by the slimmest of margins. The stock now looks like it is carving out an extended topping pattern.
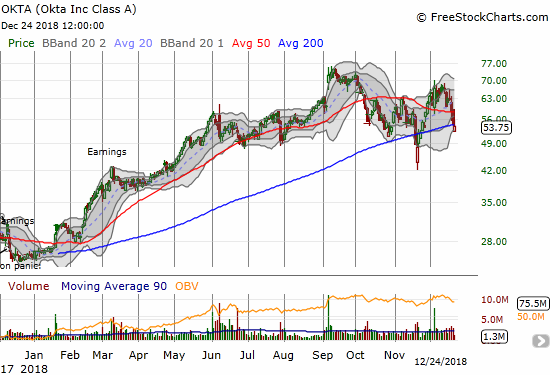
Okta (OKTA)
OKTA is at the top of my buy list for an oversold bounce. The stock suffered a 200DMA breakdown but almost rallied enough to recover that support. OKTA is still far enough above its November low. The stock is up 109.9% year-to-date.
— – —
FOLLOW Dr. Duru’s commentary on financial markets via email, StockTwits, Twitter, and even Instagram!
“Above the 40” uses the percentage of stocks trading above their respective 40-day moving averages (DMAs) to assess the technical health of the stock market and to identify extremes in market sentiment that are likely to reverse. Abbreviated as AT40, Above the 40 is an alternative label for “T2108” which was created by Worden. Learn more about T2108 on my T2108 Resource Page. AT200, or T2107, measures the percentage of stocks trading above their respective 200DMAs.
Active AT40 (T2108) periods: Day #7 under 20% (7th oversold day), Day #12 under 30%, Day #14 under 40%, Day #64 under 50%, Day #80 under 60%, Day #135 under 70%
Daily AT40 (T2108)
")
Black line: AT40 (T2108) (% measured on the right)
Red line: Overbought threshold (70%); Blue line: Oversold threshold (20%)
Weekly AT40 (T2108)

*All charts created using freestockcharts.com unless otherwise stated
The T2108 charts above are my LATEST updates independent of the date of this given AT40 post. For my latest AT40 post click here.
Related links:
The AT40 (T2108) Resource Page
You can follow real-time T2108 commentary on twitter using the #T2108 or #AT40 hashtags. T2108-related trades and other trades are occasionally posted on twitter using the #120trade hashtag.
Be careful out there!
Full disclosure: long SSO, long UVXY puts, long CAT calendar put spread, long ITB calls, long QQQ puts
*Charting notes: FreeStockCharts.com stock prices are not adjusted for dividends. TradingView.com charts for currencies use Tokyo time as the start of the forex trading day. FreeStockCharts.com currency charts are based on Eastern U.S. time to define the trading day.
“The market is so deeply oversold that the government likely does not have to do much to kindle a sharp rally. My only question now is can the administration or even the Federal Reserve do enough to prevent the Post-Trump Reversal from becoming a FULL reversal? For now, I am assuming that the stock market has to ultimately drive a lot lower still before the Fed is fully ready to capitulate.”
Your crystal ball was working today, Duru. The sharp rally you postulated could happen, happened, and was the best we’ve seen in about 10 years. As to what happens next, that’s another matter. We’ll see if your second assumption is true.
I think the important thing here is that all the misplaced fear regarding ‘firing’ the Fed chair, PPTs (or whatever silly nomenclature is associated with this nonsense), or what Trump thinks, were either fueling or exacerbating a market decline. If it is indeed misplaced, then it created some wonderful buying opportunities, which I took advantage of to a limited extent.
I bought nothing today. The market’s optimism may well fade quickly, depending on who says what, and when. If there is no economic data to back it up, then ultimately we may look back at this as one of the best buying opportunities in a decade, created entirely by what I call ‘cascading fear of fear’. If that’s true, and I’m right, then indicators don’t matter, and ultimately only whether you got in when it was cheap matters. In the short term, cheap can get cheaper, something everybody should keep in mind.
A “cascading fear of fear” is a term I will use to explain what I mean by a “second derivative” market. Given my ovserold trading rules, I am always nibbling during the oversold period and taking profits on bearish positions. You can bet I sold a lot of short term positions into this rally! Given we are still so deeply oversold, I did not move to fade anything.
For the long-term, I decided as soon as I saw the gap up open to just put cash to work. Of course no way I expected healthy gains so quickly on those. And I sure felt queasy all over again when sellers successfully faded that gap.
I assume sellers are finally exhausted and done for the year. The first full trading week of 2019 could be a good tell. I think I’m ready!