
AT40 = 48.9% of stocks are trading above their respective 40-day moving averages (DMAs)
AT200 = 56.7% of stocks are trading above their respective 200DMAs
VIX = 17.1
Short-term Trading Call: bearish
Stock Market Commentary
Sellers put on a rare performance: the S&P 500 fell for two days in a row. Buyers tapped the brakes on automatic buying programs and behavior and allowed sellers to stroll across the ticker tape unharmed. The selling was enough to print a negative performance for the week. The index has actually traded down 3 of the last 5 weeks. For perspective, consider that since the week ending October 11, 2019, the S&P 500 has traded down just 5 out of 20 weeks. The first two down weeks were fractional losses.
Note that SPY closed at 333.48 and just above my 332 bear/bull line.
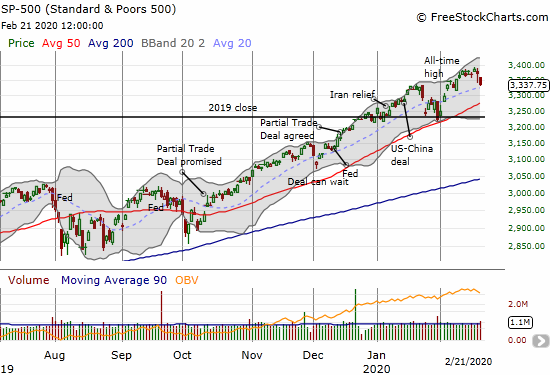
Economic data continue to weigh on the global economy with the U.S. stock market only taking occasional notice. Last week Japan, Germany, and South Korea each delivered awful economic numbers. On Friday, it was finally the U.S.’s turn. It was like economic data stumbled and tripped in the crosswalk and forced buyers to take notice. The broad selling in the stock market on Friday represents a momentary tapping of the brakes. From IHS Markit on February 21:
“With the exception of the government-shutdown of 2013, US business activity contracted for the first time since the global financial crisis in February, according to IHS Markit’s flash PMI data. Adjusted for seasonal factors, the Composite PMI Output Index (covering both manufacturing and services) slumped to 49.6 in February, down from 53.3 in the opening month of 2020.
Weakness was primarily seen in the service sector, where the first drop in activity for four years was reported, but manufacturing production also ground almost to a halt due to a near-stalling of orders.
Interestingly, the report was not all doom and gloom as, counter-intuitively, Markit reported high levels of business sentiment. Both overall business sentiment and service sector sentiment reached 8-month highs while manufacturing sentiment hit a 10-month high. I am honestly scratching my head about this data when at the same time Markit quoted some companies expressing “…greater caution in respect to spending due to worries about a wider economic slowdown and uncertainty ahead of the presidential election later this year.” Certainly the sentiment data can help explain the overall resilience in the stock market.
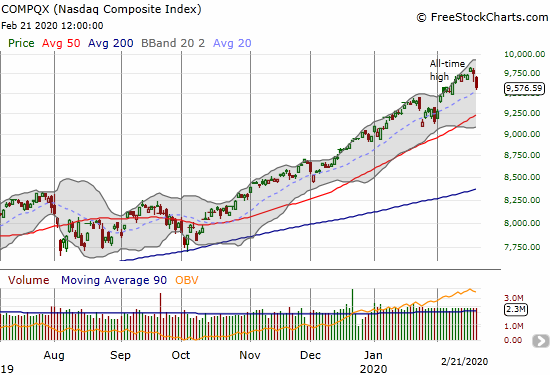
The NASDAQ (COMPQX) printed a performance similar to the S&P 500 but with greater overall gains. Given my bearishness on the stock market, I have been in the habit of buying puts on the indices. Last week I alternated to Invesco QQQ Trust (QQQ) given its accelerating performance. I picked two weeks to expiration and even doubled down on Wednesday. I thought I missed a good profit-taking opportunity when the stock market briefly swooned Thursday morning. Friday gave me a great second chance. I took profits with the QQQ down abut 1.4% (it finished down 1.9%).
AT40 (T2108), the percentage of stocks trading above their respective 40-day moving averages (DMAs), fared much better than I would have expected on such a broad sell-off. My favorite technical indicator “only” fell from 52.3% to 48.9% for a 2-week low. I was expecting a steep drop at least to the low 40s. Two possibilities for interpretation: 1) the underlying stock market is already starting to stabilize, or 2) the selling has plenty of room left on the downside. My bearish bias on the market has me choosing the second interpretation for now.
Volatility
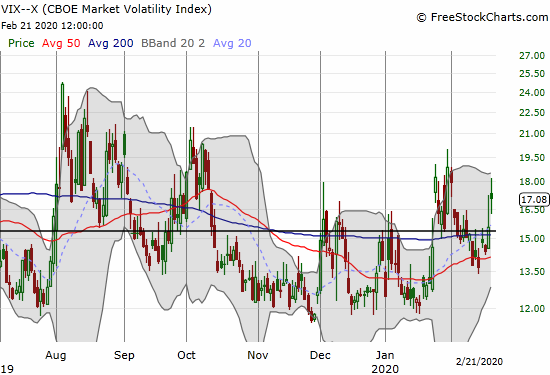
The volatility index (VIX) avoided a retest of the 12 level. The next upward cycle kicked off on Thursday’s selling. As usual, the volatility faders went to work. The VIX hit an intraday high of 17.2 before closing right on top of the 15.35 pivot. The faders were much less effective on Friday with the VIX managing to hold onto its gap up open. I am assuming that the “pent-up” selling pressure in the market will not end until the VIX gets a close above 20. Last week’s VIX rally may have set such a move in motion with the 13.5 level serving as a higher low.
The Short-Term Trading Call
I go into the coming week without puts on the indices for the first time in 3 weeks or so. As such, I feel a little over-exposed to risk. However, as soon as SPY trades below 332, I am going to chase the index downward aggressively with put options. My first downside target for SPY is of course 50DMA support. (For more background on my bearishness, see “A Sharp Market Rebound, Too Many Stocks Left Behind – Above the 40 (February 7, 2020)“)
During this period of bearishness, I continue to dabble in some upside plays in select themes and sectors. I update some of my positioning and assessments below.
Stock Chart Reviews – Below the 50DMA
Vulcan Materials (VMC)
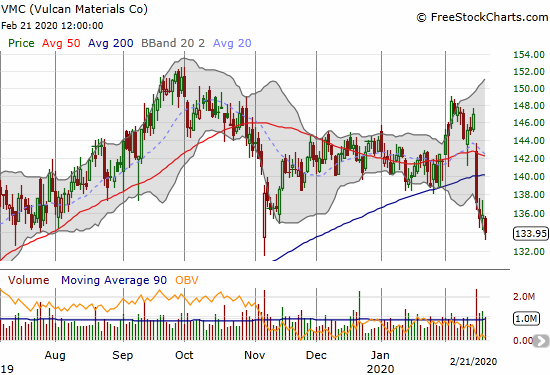
Vulcan Materials (VMC) confirmed a 200DMA breakdown that it suffered after reporting earnings. This selling looks more damaging than the post-earnings selling in November where buyers stepped right into the breach. VMC closed at an 8-month low in what is likely the beginning of a more extended slide. I will be warily eyeing these developments given the potential implications for the construction sector.
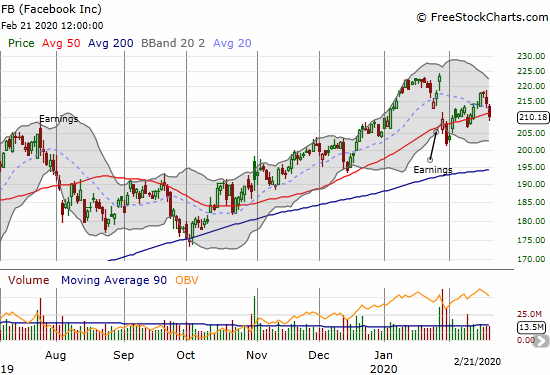
Facebook (FB)
Facebook (FB) is one of many stocks where the flow of automatic money is visible. The post-earnings dip was soon bought. Soon after that rebound, an analyst downgrade took FB below its 50DMA again. Buyers stepped in even more quickly. FB looked like it was on its way to filling its post-earnings gap before the selling of the last two days of the week. These kinds of stocks are hard to fade in a stock market on an extended run-up: by the time I recognize the selling pressure, the selling is coming to an end. These are also the stocks helping to prop up the major indices while the majority of stocks are toiling away.
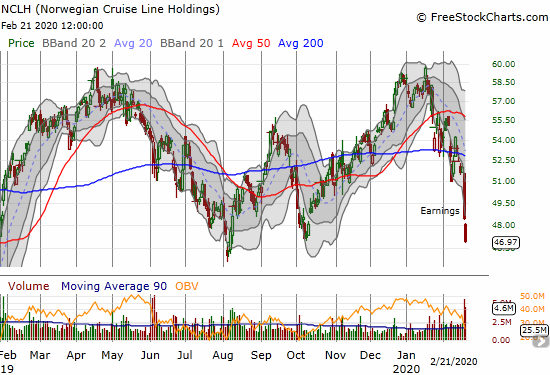
Norwegian Cruise Line Holdings (NCLH)
Norwegian Cruise Line Holdings (NCLH) suffered a big post-earnings blow as the economic pressures of the coronavirus weighed on guidance. The stock sold off toward the lows of 2019. A break of those lows puts the $40 level in play. The following declaration from the CEO is telling and puts NCLH on my buy list for a future time:
“
The 2019 storyline for Norwegian Cruise Line Holdings can be best described in one single word, resilience, a theme that will surely carry over into 2020 as they confront the effects of the virus outbreak. Focusing on just 2019 and with headwinds from the sudden cessation of cruises to Cuba and the impact of Hurricane Dorian the year that just ended allowed us to demonstrate once again the strength and resilience of our business model. A model founded on operating three award winning global brands in each of the industry’s major categories; a focus on sourcing the best guests from around the world, but anchored in North America consistently diversifying our deployments and quickly redeploying vessels as needed depending on market conditions; and our go-to-market strategy of emphasizing value over price as the main lever to drive demand.
Despite these headwinds the company still delivered record financial results, which reflects a doubling over the last five years of revenue to approximately $6.5 billion; adjusted EBITDA approaching $2 billion; and adjusted earnings per share reaching an all time high and above the $5 mark for the first time in our company’s history.
Norwegian Cruise Line Holdings’ (NCLH) CEO Frank Del Rio on Q4 2019 Results – Earnings Call Transcript, February 20, 2020, Seeking Alpha
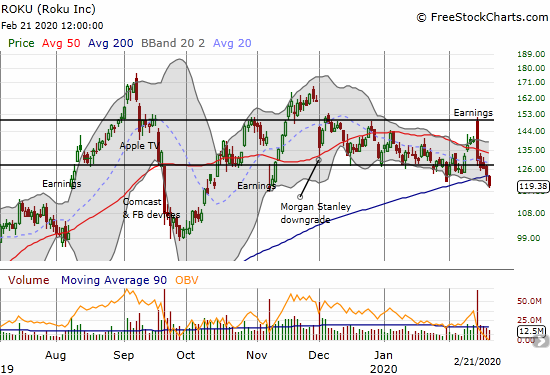
Roku (ROKU)
I wrote the following about Roku (ROKU) in my previous Above the 40 post: “I am still waiting for a clear break one way or the other before placing any further trades. The uptrending 200DMA may soon force the issue…a bearish breakdown below support or enough of a bounce off support to breakout above the band.” I bought puts in ROKU on Friday. The 200DMA breakdown confirms the post-earnings bearish engulfing pattern. ROKU closed at a 3+ month low where it gapped down for its November earnings.
Stock Chart Reviews – Above the 50DMA
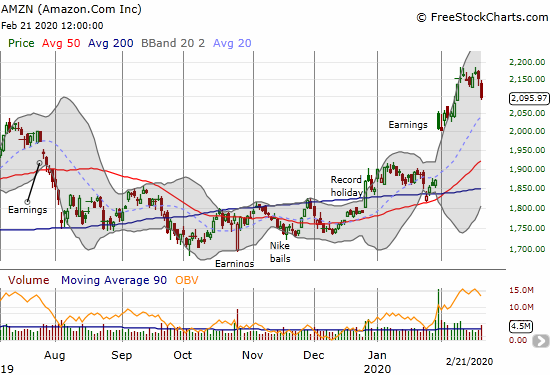
Amazon.com (AMZN)
Amazon.com (AMZN) finally followed through on the bearish setup I described last week. AMZN has no “natural” support until around 2000 which represents the stock’s post-earnings closing low…and of course it is a round number as well.
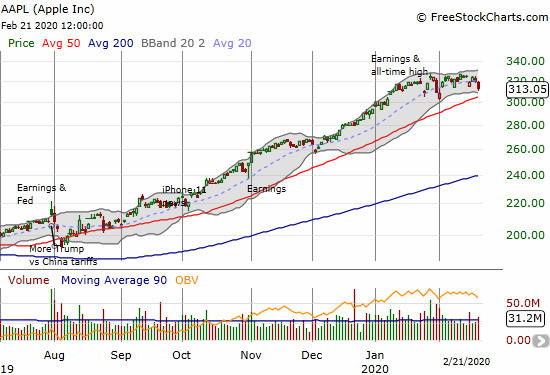
Apple (AAPL)
The uptrend in Apple (AAPL) has flattened out. My weekly call trade in AAPL has had its roughest streak in a long time. I automatically bought weekly calls in the midst of Friday’s selling, but something tells me I may soon suspend this strategy (on-going success in buying QQQ puts could be one key tell). AAPL looks like it is headed for a test of its 50DMA: the automatic buying in the stock looks like it is failing to push the stock ever higher. Like Facebook (FB) the signs of the automatic buying were in the near instant buying pressure on small pullbacks: a pre-earnings gap down, a post-earnings pullback, and the China-related earnings warning. Friday’s 2.3% loss reversed the post-warning rebound.
Note that a 50DMA test is hardly newsworthy given AAPL’s run-up. However, a 50DMA breakdown WILL be newsworthy as the relentless march higher in AAPL has left no natural levels of support until its 200DMA or perhaps $260-270.
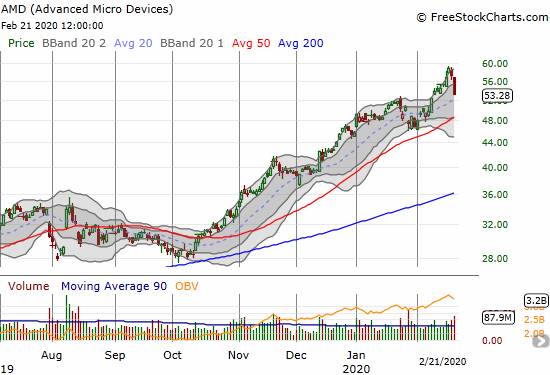
Advanced Micro Devices (AMD)
Advanced Micro Devices (AMD) was going parabolic until the last two days of heavy volume selling. A top should be in place in AMD for quite some time now. However, I want to try a buy on a 50DMA test. If AMD cracks $60, the stock of course will be right back to bullish form.
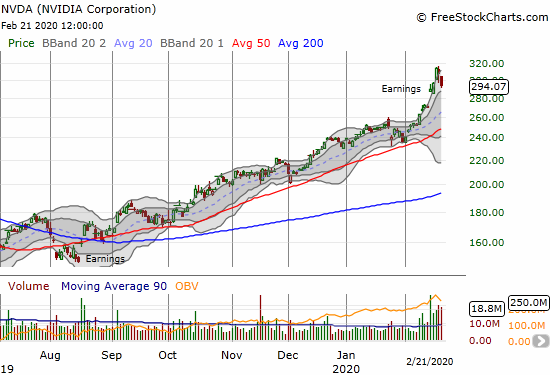
NVIDIA Corporation (NVDA)
NVIDIA Corporation (NVDA) was also going parabolic before two days of heavy volume selling. Like AMD, last week should mark a lasting top in the stock. NVDA has been quite a story. The parabolic run-up took NVDA to an all-time high, beating out the last all-time high set in October, 2018. Between these two goalposts, NVDA cratered around 50%. That is quite a roller coaster ride and recovery for such an important stock and company!
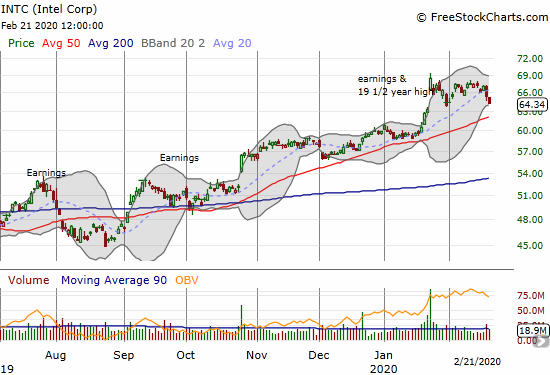
Intel (INTC)
Intel (INTC) has failed to make progress since its huge post-earnings pop last month. I optimistically doubled down on my between earnings trade in INTC for what will likely be my last try until (when?) the stock market flips oversold. For now, with no signs of upward momentum and a bearish looking stock market, the prospects for breaking to new highs anytime soon seem low.
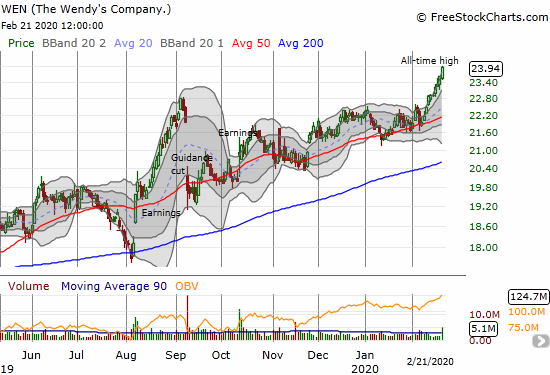
The Wendy’s Company (WEN)
One half of my chicken sandwich trade is doing well: The Wendy’s Company (WEN). With earnings coming up next week, I plan to use all-time highs as an opportunity for taking profits. I still like buying dips in WEN.
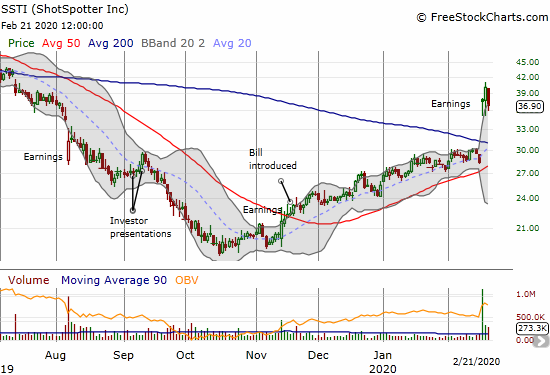
ShotSpotter (SSTI)
ShotSpotter (SSTI) greatly exceeded my expectations last week and delivered an explosive confirmation of my bottoming thesis from December. The stock soared 32.6% post-earnings and buyers stepped in again the next day. However, Friday’s 7.9% reversal may mark the end of the post-earnings move. I am watching as closely as ever. A post-earnings low may take me out half my position as I look to reload on a test of 200DMA support.
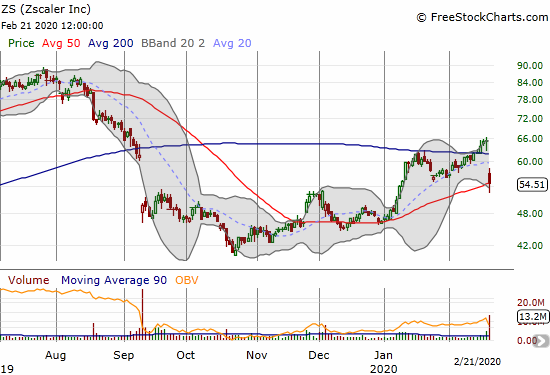
ZScaler (ZS)
ZScaler (ZS) lost 16.4% post-earnings after fooling investors with a pre-earnings 200DMA breakout. ZS managed to cling to uptrending 50DMA support, but that achievement looks tenuous in this market.
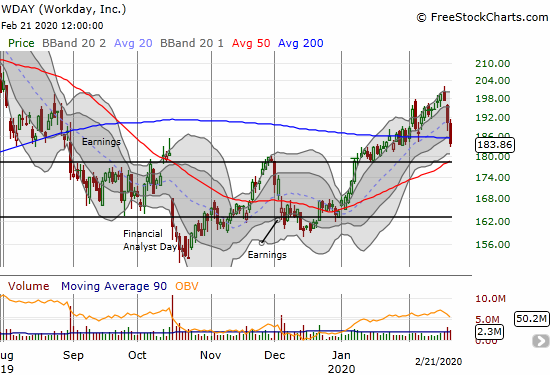
Workday (WDAY)
Speaking of trick 200DMA breakouts, Workday (WDAY) fooled me this month. Two days of selling quickly reversed WDAY’s 200DMA breakout and wiped out some call options I had on WDAY playing the breakout. WDAY’s 50DMA has converged with the upper bound of the previous trading range. I will be looking to see whether that level can serve as firm support.
— – —
FOLLOW Dr. Duru’s commentary on financial markets via email, StockTwits, Twitter, and even Instagram!
“Above the 40” uses the percentage of stocks trading above their respective 40-day moving averages (DMAs) to assess the technical health of the stock market and to identify extremes in market sentiment that are likely to reverse. Abbreviated as AT40, Above the 40 is an alternative label for “T2108” which was created by Worden. Learn more about T2108 on my T2108 Resource Page. AT200, or T2107, measures the percentage of stocks trading above their respective 200DMAs.
Active AT40 (T2108) periods: Day #273 over 20%, Day #112 over 30%, Day #14 over 40% (overperiod), Day #1 under 50% (underperiod), Day #20 under 60%, Day #24 under 70%
Daily AT40 (T2108)
")
Black line: AT40 (T2108) (% measured on the right)
Red line: Overbought threshold (70%); Blue line: Oversold threshold (20%)
Weekly AT40 (T2108)

*All charts created using FreeStockCharts unless otherwise stated
The T2108 charts above are my LATEST updates independent of the date of this given AT40 post. For my latest AT40 post click here.
Be careful out there!
Full disclosure: long VIXY calls, long AMZN put spread, long SSTI, long AAPL calls, long ROKU puts, long WEN, long INTC calls
*Charting notes: FreeStockCharts stock prices are not adjusted for dividends. TradingView.com charts for currencies use Tokyo time as the start of the forex trading day. FreeStockCharts currency charts are based on Eastern U.S. time to define the trading day.