
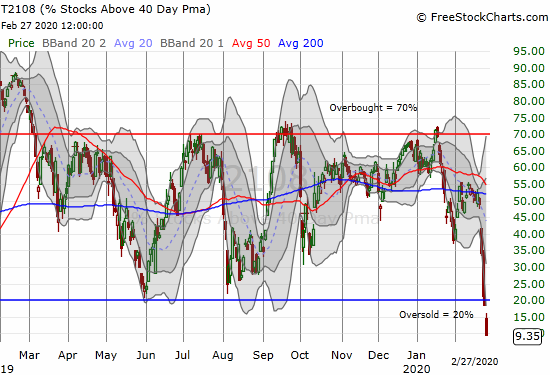
AT40 = 9.2% of stocks are trading above their respective 40-day moving averages (DMAs) (oversold day #2)
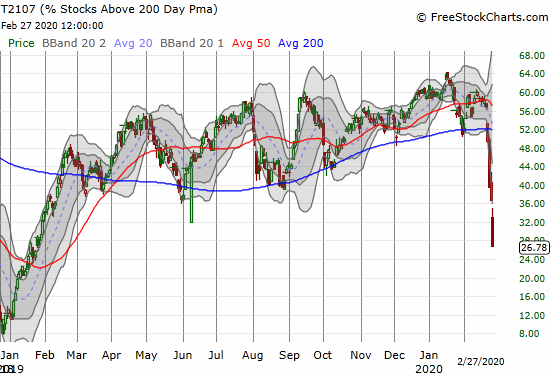
AT200 = 26.8% of stocks are trading above their respective 200DMAs (near 13-month low)
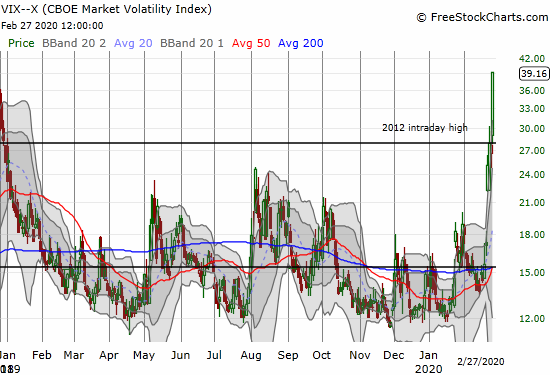
VIX = 39.2 (up 42.1%)
Short-term Trading Call: bullish
Stock Market Commentary
Oversold
The stock market is only into its second oversold day, but the technical extreme is already just about as stretched as it can get. AT40 (T2108), the percentage of stocks trading above their respective 40-day moving averages (DMAs), plunged from 18.5% to 9.4%. AT40 only took 27 trading days to go from one extreme, overbought, to the other. In just 28 trading days, AT40 is already into the extreme edge of oversold status!
This is what I call “second derivative” selling: selling that accelerates to the downside and creates the most extreme of trading conditions. This kind of selling wipes out weeks and months of gains in a flash and reverses major, bullish breakouts. Second derivative selling is a feature of panic and a rush for the exits that leaves investors regretting they ever believed the bullish thesis that preceded the chaos and carnage.
AT200 (T2108), the percentage of stocks trading above their respective 200DMAs, further emphasized the broad based damage in the stock market. Now just 26.8% of stocks remain above this important longer-term trendline. AT200 plunged to a 13-month low.
The Indices
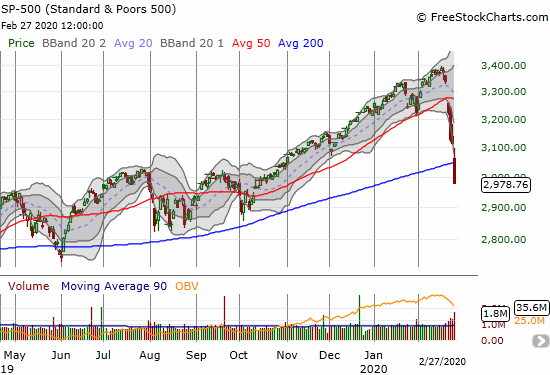
The S&P 500 (SPY) opened with a gap down near its 200DMA support. A choppy rally from there gave the impression that buyers would defend the 200DMA; I started grabbing some stocks and call spreads on my shopping list. Unfortunately, the end of lunch on Wall Street brought back hungry and eager sellers. The selling accelerated in the last 45 minutes of trading. The index ended with a 4.4% loss and a 4-month low. The S&P 500 finished erasing its entire breakout from October of last year. The persistent and stubborn rally that followed that breakout is becoming a distant memory.
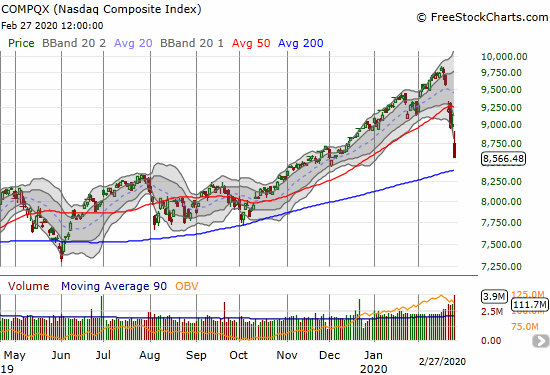
The NASDAQ (COMPQX) gapped down and rallied similarly to the S&P 500 without the benefit of 200DMA support. The weak close to a 3.6% loss puts 200DMA support into play.
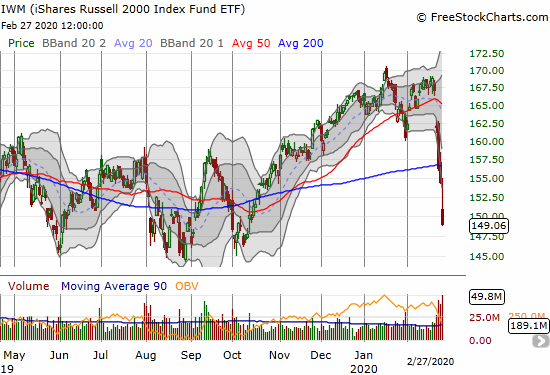
The iShares Russell 2000 Index Fund ETF (IWM) reversed its November breakout on Tuesday. Now the big question is whether IWM can hold the lows from 2019! The index of small cap stocks closed the day with a 3.5% loss and a 4-month low.
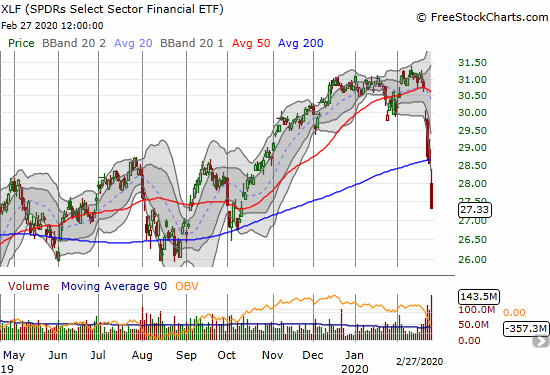
The SPDRS Select Sector Financial ETF (XLF) confirmed its 200DMA breakdown with a 4.3% loss. Like IWM, the new question is whether the index of financials can hold 2019 lows.
The speed and resulting depth of these oversold levels are historic. How much more history lays ahead?
Volatility
The volatility index (VIX) somehow lost 1.0% the previous day and gave the appearance of a topping. Thursday’s 42.1% jump quickly erased such interpretations. Volatility faders could not touch the VIX today.
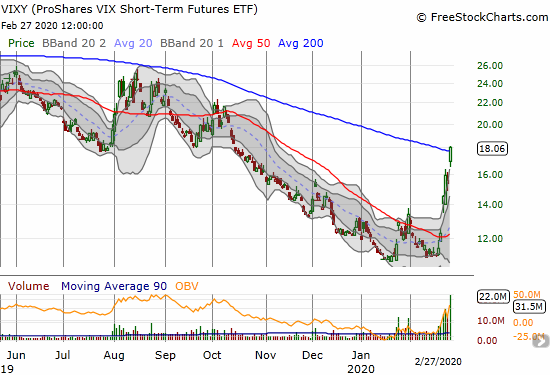
I thought I had perfectly prepared for a such surge in volatility by rotating into long volatility instruments with call options. However the persistent decline in instruments like ProShares VIX Short-Term Futures ETF (VIXY) meant that my choice of strike, March $17, became too far out of the money. I did not think to accumulate more calls, and I failed to buy shares outright. So I lamented having to sell my call option for a tiny profit with VIXY at $17. The time for going long volatility is now past, and I am focused on joining the volatility faders.
The Short-Term Trading Call
I changed my short-term trading call once again. I am now full out bullish even without the VIX dropping below 22 as I laid out in my last Above the 40 post. AT40 is in single-digits and the VIX is extremely extended to the upside. I have to stay focused on the bullish trading opportunities from here until at least after the stock market exits this extreme, second derivative oversold period.
I took profits on my Caterpillar (CAT) puts and held onto my S&P 500 put spread. However the plunge into the close was so deep that my spread finally closed out at my (raised) target price. I bought an “Armageddon” QQQ March 13 $190 put option and have a smattering of other puts. Overall, I am overweighted to the long side. I will get aggressive if the market sells off on Monday to lower levels. I am content NOT to add ahead of the weekend.
The currency market has even more of my attention. Price action is getting extreme in forex, and, surprisingly, the euro (FXE) has come alive in a big way. I will have to dedicate a post to these moves. In the meantime note that the Australian dollar (FXA) versus the Japanese yen (FXY) is finally breaking down and adding its own confirmation to the malaise in the stock market. I am now accumulating a long position in AUD/JPY as part of my oversold position. Often, I will short AUD/JPY as a hedge on bullish positions, but I have often found this strategy sub-optimal as AUD/JPY can rally sharply out of oversold conditions in the financial market. (For more details on the importance of AUD/JPY see Why the Australian Dollar and Japanese Yen Matter for Stock Traders).
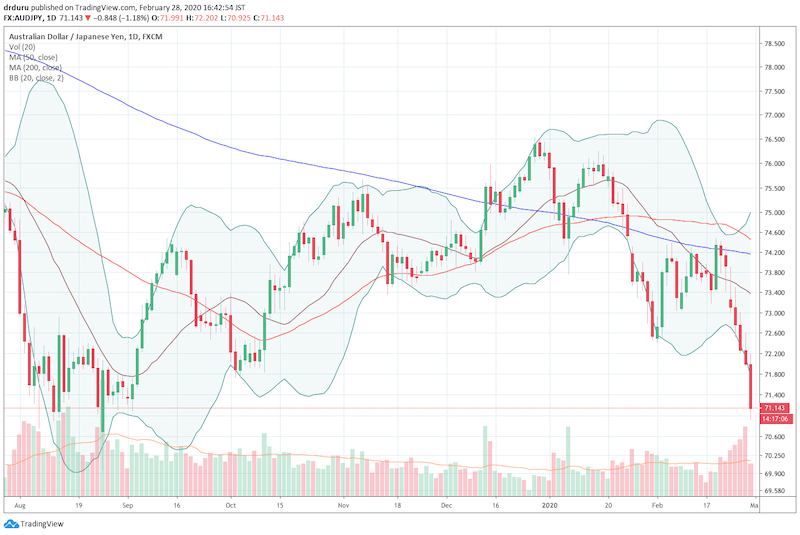
Source: TradingView
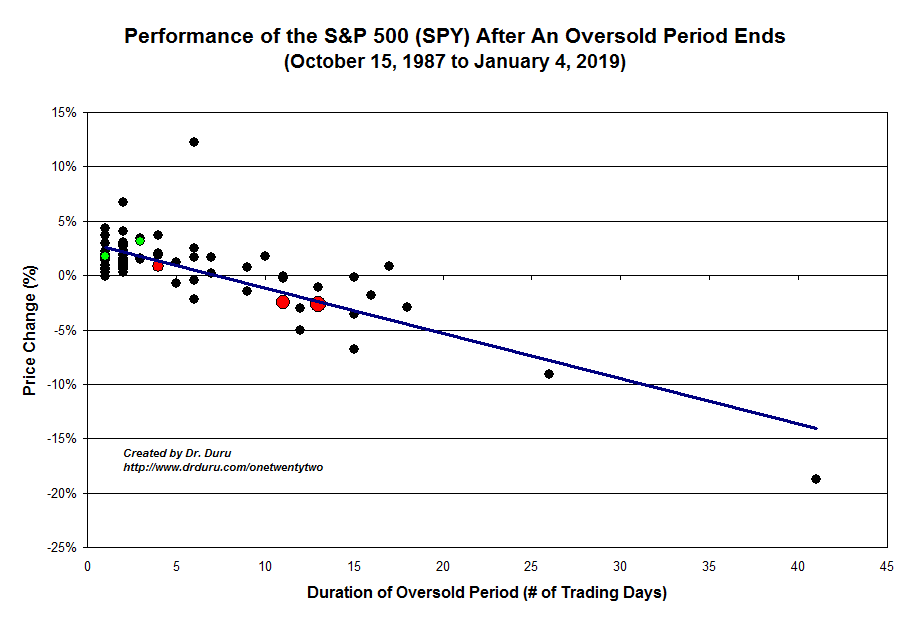
The chart below demonstrates the extreme nature of this move. The S&P 500 is down 4.4% since first closing in oversold conditions. Historically, the index does not lose this much in an entire oversold period until the extreme stretches out to 8 days or so! Also note the large cluster of oversold periods that last just a day or two. This cluster is what can make buying oversold periods so valuable.
Stock Chart Reviews – Below the 50DMA
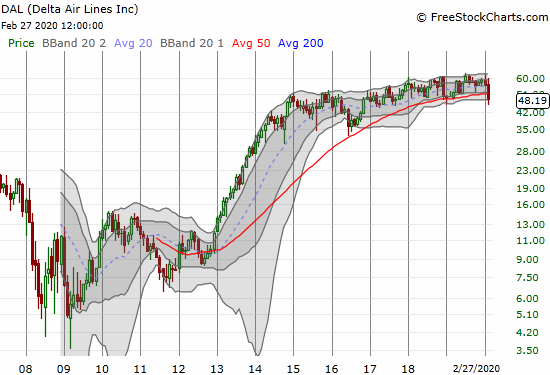
Delta Airlines (DAL)
Anything travel-related is getting slammed. Delta Airlines (DAL) lost 2.8% but had an impressive bounce from its lows. DAL still closed well below its lower Bollinger Band (BB). I almost put it on the shopping list until I pulled back to see the monthly chart. I see a stock that has made grudging progress since a sharp 2-year rally ended in 2015. This is NOT the kind of stock I want to take on in such a high-risk environment.
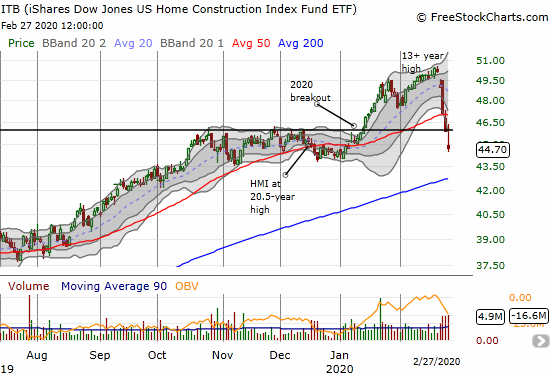
iShares Dow Jones US Home Construction Index Fund ETF (ITB)
I added yet more call options in iShares Dow Jones US Home Construction Index Fund ETF (ITB) as part of my well-worn seasonal trade on home builders. My shopping list is now long with individual builders I want to buy. I will dedicate an entire post to this space soon (perhaps my monthly housing market review), especially given the momentous post-earnings reaction for Toll Brothers (TOL). Importantly, ITB finished erasing its entire 50DMA breakout. I will get ever more aggressive going forward. This trade should work out in the short-term until/unless an economic calamity truly becomes evident to financial markets.
Stock Chart Reviews – Above the 50DMA
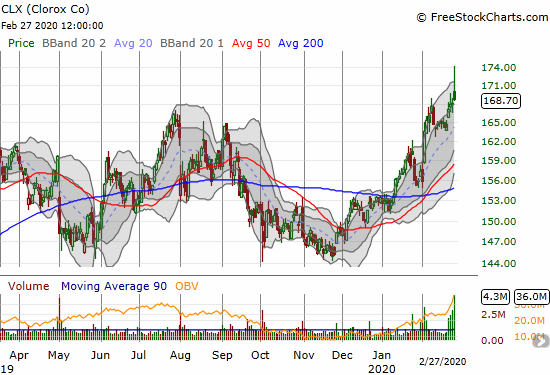
Clorox (CLX)
I struggled to find an interesting stock still trading above its 50DMA! I kept hearing about Clorox (CLX) as a virus play given its collection of disinfectant products. The stock’s rally is not nearly as impressive as I expected. Moreover, CLX faded hard from its intraday high of $174. The stock likely topped out. The money that comes out of plays like CLX will likely rotate right back to tech growth stocks.
— – —
FOLLOW Dr. Duru’s commentary on financial markets via email, StockTwits, Twitter, and even Instagram!
“Above the 40” uses the percentage of stocks trading above their respective 40-day moving averages (DMAs) to assess the technical health of the stock market and to identify extremes in market sentiment that are likely to reverse. Abbreviated as AT40, Above the 40 is an alternative label for “T2108” which was created by Worden. Learn more about T2108 on my T2108 Resource Page. AT200, or T2107, measures the percentage of stocks trading above their respective 200DMAs.
Active AT40 (T2108) periods: Day #2 under 20% (oversold day #2 ending 275 days over 20%), Day #3 under 30%, Day #14 under 40%, Day #5 under 50%, Day #24 under 60%, Day #28 under 70%
Daily AT40 (T2108)
")
Black line: AT40 (T2108) (% measured on the right)
Red line: Overbought threshold (70%); Blue line: Oversold threshold (20%)
Weekly AT40 (T2108)

*All charts created using FreeStockCharts unless otherwise stated
The T2108 charts above are my LATEST updates independent of the date of this given AT40 post. For my latest AT40 post click here.
Be careful out there!
Full disclosure: long UVXY puts, long ITB calls and call spread, long IWM calls, long AUD/JPY, long QQQ put and call spread
*Charting notes: FreeStockCharts stock prices are not adjusted for dividends. TradingView.com charts for currencies use Tokyo time as the start of the forex trading day. FreeStockCharts currency charts are based on Eastern U.S. time to define the trading day.