
AT40 = 38.9% of stocks are trading above their respective 40-day moving averages (DMAs)
AT200 = 44.8% of stocks are trading above their respective 200DMAs
VIX = 18.9
Short-term Trading Call: cautiously bullish
Stock Market Commentary
From opening at the edge of oversold trading conditions to closing on near panic buying, last week was a wild week!
I described a bullish divergence that started last week’s trading which would likely delay the market’s dip into oversold trading conditions. Several big cap tech stocks suffered tremendous losses on Monday while barely nudging the S&P 500 (SPY). More importantly, my favorite technical indicator, AT40 (T2108), the percentage of stocks trading above their respective 40-day moving averages (DMAs), managed to close with a gain. It closed at 22.9%, just above the 20% threshold for oversold trading conditions. The stock market never looked back from that point.
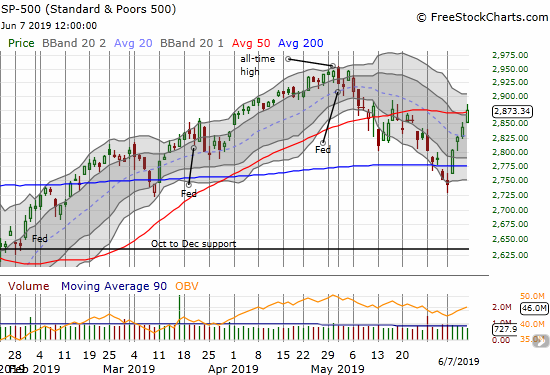
The S&P 500 (SPY) gapped higher the next day and sliced right through its 200DMA resistance. The index even closed the week with a marginal push through its 50DMA resistance. The astounding 4.4% gain on the week erased a LOT of the negativity characterizing trade since the all-time high in April. In fact, the rush upward has the distinct look of a “buyer’s panic” – a move where traders and investors suddenly realize they got caught leaning the wrong way and rush back into the market to avoid missing out on gains.
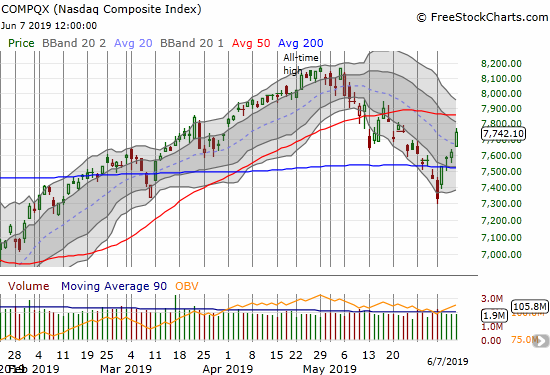
The NASDAQ (COMPQX) also gapped up on Tuesday and notched a 3.8% gain for the week. The tech-laden index still needs to contend with overhead resistance from its 50DMA.
With the breaches of 200DMA resistance AND AT40 soaring through 30%, I flipped my short-term trading call to cautiously bullish. With hindsight, I was TOO cautious. While I unloaded several bearish positions into Monday’s selling, I held almost all the remainder of such positions for the entire week. I spent most of my trading scrambling to get as bullish as the market. The chart reviews below describe some of the hits and misses. The week was a reminder of the bullish implications of a 200DMA breakout for the major indices when accompanied by an escape out of or away from oversold conditions.
The Federal Reserve and the Promise of Future Rate Cuts
The June jobs report placed a perfect exclamation point on the trading. Job creation came up well short of “expectations”; the bad news seemed to seal the deal for imminent rate cuts from the Federal Reserve. This “bad news is good news” behavior is a bit unsettling because it forces the Fed into a rough corner. The economy is hardly weak enough to justify a rate cut, but the Fed may feel compelled to cut rates to avoid upsetting the stock market and thus triggering a fresh sell-off (aka another rate tantrum). If the Fed does not cut soon, it will have to place very dovish language in its reports on monetary policy to soften the market’s disappointment. An example of such messaging came from St. Louis Federal Reserve president James Bullard when he helped launch the stock market’s oversold rally with the following conclusion (from CNBC):
Along with weak inflation and warning signs from the U.S. bond market, “a downward policy rate adjustment may be warranted soon” to help boost inflation expectations and help ease fears that have emerged in bond prices of a sharper-than-expected U.S. slowdown.
Bullard showed typical Fed deference to market expectations by claiming that dropping interest rates indicated monetary policy could be too tight. He even conceded that the Fed could cut rates as “insurance” as it did back in the 1990s. This dovish talk alone should have made me a lot more aggressive than “cautiously bullish”!
The market was so primed by Bullard to believe that the Fed will cut interest rates soon that, based on the screaming headlines from mainstream financial media, it seemed to interpret relatively innocuous language from Federal Reserve Chair Jerome Powell on Tuesday as confirmation of an imminent rate cut. From Powell’s opening remarks at the “Conference on Monetary Policy Strategy, Tools, and Communications Practices“:
“I’d like first to say a word about recent developments involving trade negotiations and other matters. We do not know how or when these issues will be resolved. We are closely monitoring the implications of these developments for the U.S. economic outlook and, as always, we will act as appropriate to sustain the expansion, with a strong labor market and inflation near our symmetric 2 percent objective.”
Powell offered absolutely nothing new in those comments. His speech went on to discuss the topic of the day which focused on the history of unconventional monetary policy actions and the effective lower bound (ELB) of interest rates. Perhaps the market interpreted news of the Fed’s review of monetary policy during a strong economy with weak inflation as a potential promise of future rate cuts:
“My FOMC colleagues and I must—and do—take seriously the risk that inflation shortfalls that persist even in a robust economy could precipitate a difficult-to-arrest downward drift in inflation expectations. At the heart of the review is the evaluation of potential changes to our strategy designed to strengthen the credibility of our symmetric 2 percent inflation objective.”
Nowhere else in the speech did I even find a hint of a promise of rate cuts or even a hint of a confirmation of Bullard’s dovishness. Such is the power of a significant shift in market sentiment and market narrative!
The below table of probabilities for various Fed Fund futures (as of time of writing) shows that the market expects the Fed to first cut rates at the July meeting. The current rate range is 225-250 basis points. By July, the odds for rates to be no higher than 200-225 is 65.0% + 14.3% = 79.3%; the first rate cut. The odds for rates to be no higher than 175-200 basis points after the August meeting is 53.3%. These odds increase to 66.4% by the October meeting. The market is close to expecting a THIRD rate cut by December with 47.2% odds for interest rates to be no higher than 150-175 basis points by then! (I am assuming the Fed cuts rates 25 basis points at a time).
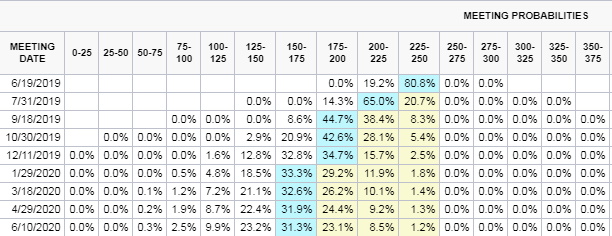
Source: CME FedWatch
A Volatility Index That Stopped Cooperating
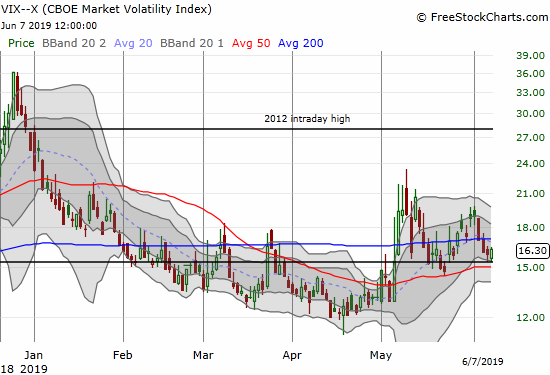
With President Trump and Mexico coming to some kind of terms, this week is set up to continue the bullish run….EXCEPT the volatility index (VIX) actually perked up on Friday. The VIX bounced perfectly off its 15.35 pivot point two days in a row. Of course, this jump may be related to some nervousness about the pending June 10th deadline on tariffs on imports from Mexico. Regardless, the VIX is one thing to keep in mind going into this week.
Trade War
Now that President Trump is declaring victory over Mexico as I expected, the Mexican peso has significantly strengthened. At the time of writing, USD/MXN has almost reversed all its losses post the trade threat. I am waiting out the intraday market volatility as long as I can before taking profits. I do not want to hold my short USD/MXN into Monday morning trading given the potential for fresh headlines to upset this trade. For example, the Mexican President might decide to contradict language coming from the U.S. or perhaps the detente suffers a quick setback. These and many other vagaries have happened after other apparent U.S. foreign policy and trade “victories.”
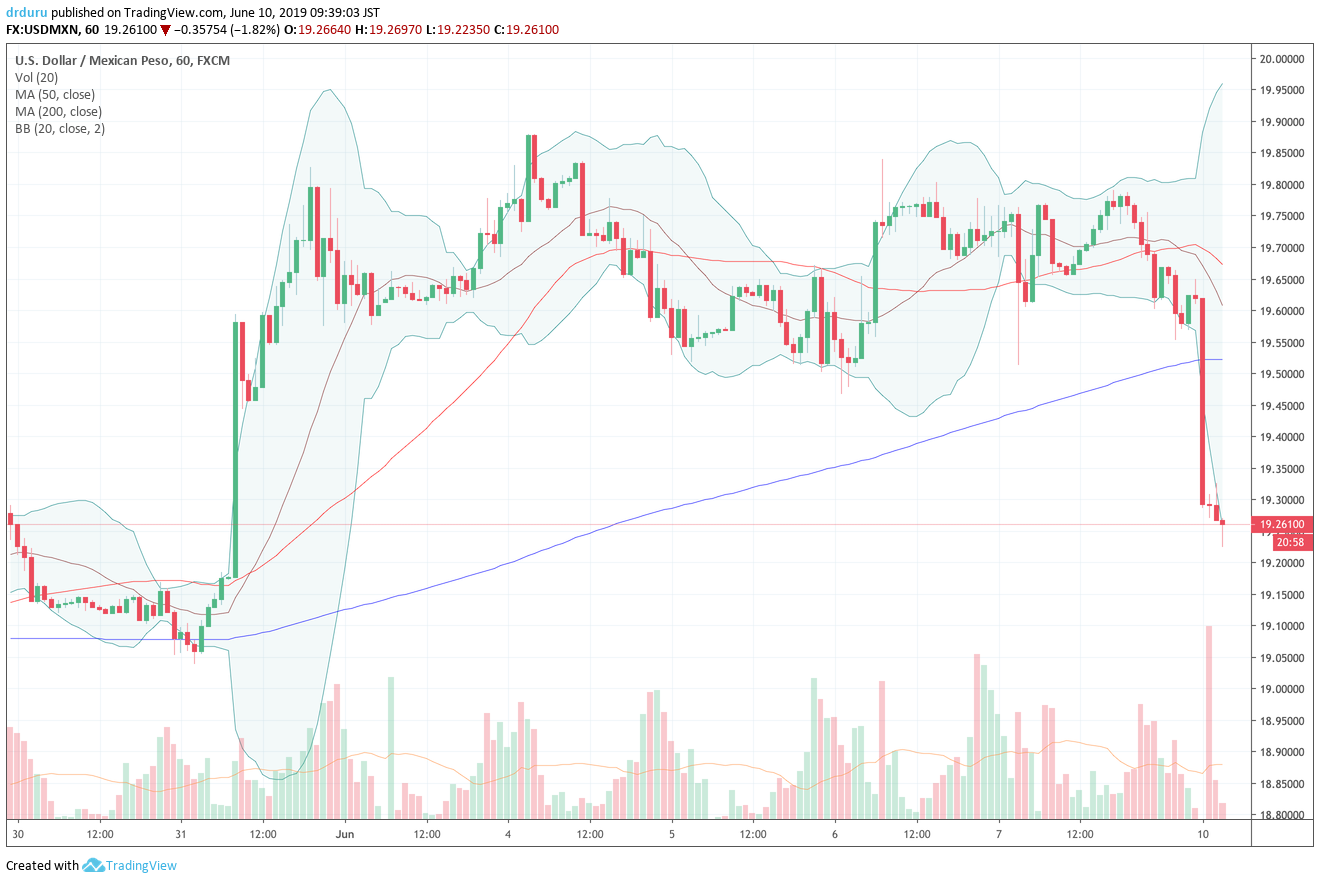
Source: TradingView
Stock Chart Reviews – Bearish
To simplify the bear/bull split on my chart reviews, I am ignoring current momentum. However, note well, that the momentum of a bounce from oversold conditions, especially a buyer’s panic, can easily overcome all sorts of overhead resistance!
Facebook (FB)
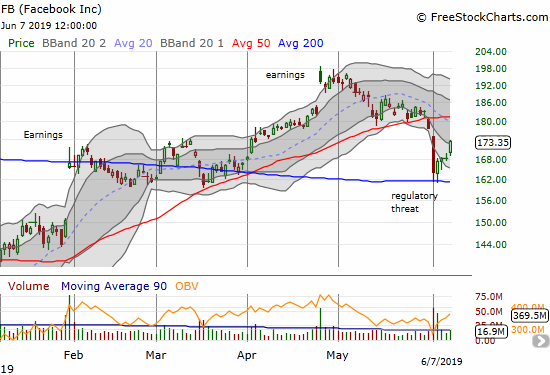
Facebook (FB) confirmed a 50DMA breakdown in dramatic fashion to start the week. However, sellers had almost no follow-through. After two days testing 200DMA support, sellers clearly exhausted themselves and buyers took over. FB looks set to test overhead 50DMA resistance and is a bearish chart until it closes above that line.
Amazon.com (AMZN)
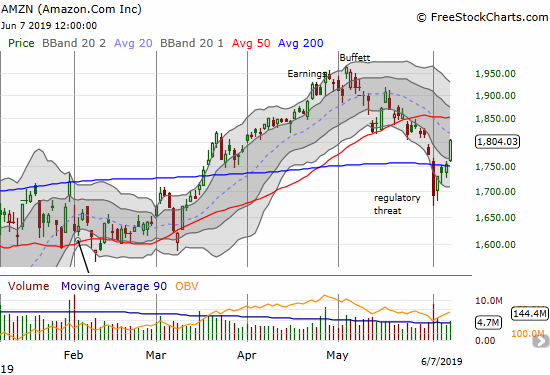
Amazon.com (AMZN) looked “finished” after Monday’s selling took the stock well below its 200DMA support. The subsequent rebound did struggle a bit at 200DMA resistance, but Friday’s 2.8% gain put a resounding end to that battle. Now overhead 50DMA resistance awaits. Unlike other trades I missed, I rushed into AMZN on the 200DMA breakout. I flipped the call option before the close.
Netflix (NFLX)
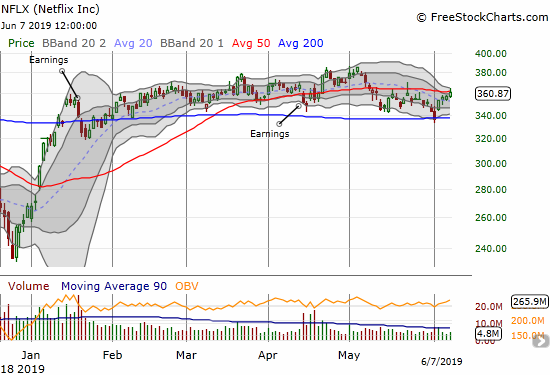
I got caught betting Netflix (NFLX) would break though 200DMA support with a calendar put spread. The weight of the big cap tech sell-off looked heavy enough to last more than a day. The chart below shows the stock wasted no time in affirming support at the bottom of its almost 5-month trading range. The stock remains bearish until it closes above 50DMA resistance.
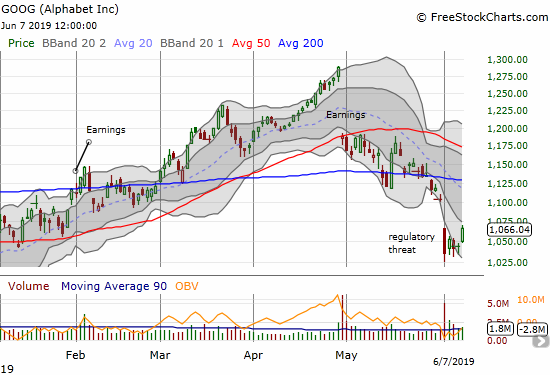
Alphabet (GOOG)
Alphabet (GOOG) struggled the most of its fellow big cap tech stocks. Ironically, THIS was the stock I rushed to buy on Monday’s big down day. While I am now net positive on the shares, I remain wary. I am planning to hang around for a test of 200DMA resistance, but I am beginning to think GOOG is truly a broken stock.
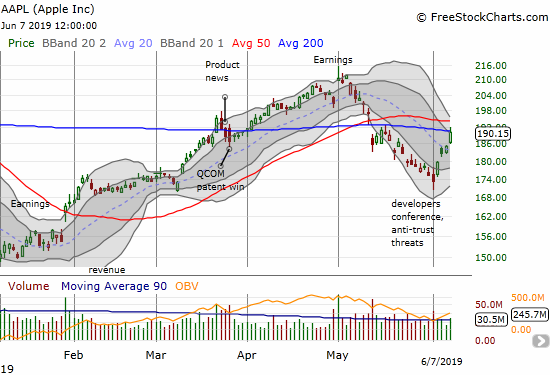
Apple (AAPL)
Apple (AAPL) is another stock that remains in a bearish position, but it is hard for me to call it truly bearish given current momentum. The stock’s rebound took AAPL right into 200DMA resistance. AAPL is just another day or two from even breaking through 50DMA resistance which would put it firmly in bullish ground again. I did not buy my weekly call options this round, but I did buy another July put spread as a hedge against more trade war turmoil (which I fully expect to come from China).
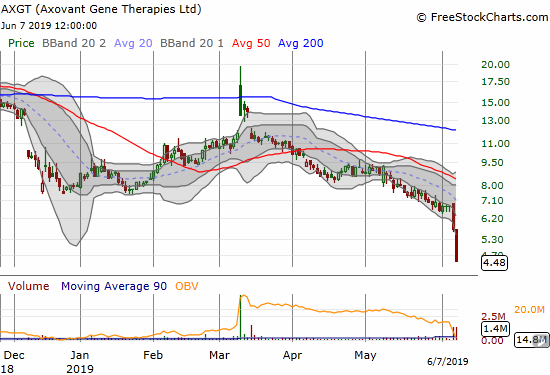
Axovant Gene Therapies (AXGT)
Axovant Gene Therapies (AXGT) has been bearish since it broke through 50DMA support in April and perhaps since it closed below 200DMA resistance after March’s surge. I belatedly dumped my speculative position in the wake of last week’s selling after drug trial news and the end of a licensing and collaboration agreement with Benitec Biopharma. This was my third roundtrip on AXGT. The huge success of my first two rounds made me too slow to accept defeat this time around. Another lesson learned!
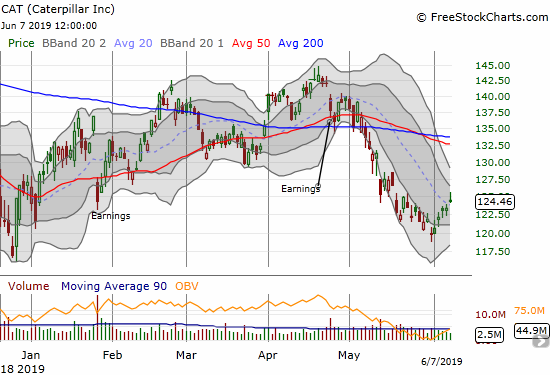
Caterpillar (CAT)
Caterpillar (CAT) gained on Friday but notably faded back to its open. While CAT may have bottomed around $120, just above its December low, I doubt it will regain enough momentum to power over declining resistance from its 50 and 200DMAs on the first test. Per a CNBC Options Action segment a few (two?) weeks back, I used this rally to jump into a July 120/110 put option. I will get a lot more aggressive with puts on a test of resistance as CAT at that point would set up as a great hedge on what should be a much larger bullish position in my short-term set of trades.
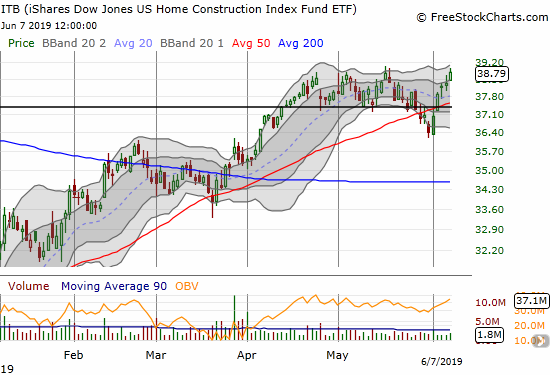
iShares Dow Jones Home Construction ETF (ITB)
The iShares Dow Jones Home Construction ETF (ITB) is only bearish because my topping thesis did not quite get invalidated with last week’s rate-driven rebound. I strongly suspect that ITB will get sold heavily after the Fed’s first rate cut. All the rate-driven euphoria should be price in by then, and the vacuum will get filled with the implications of a weakening economy on housing demand.
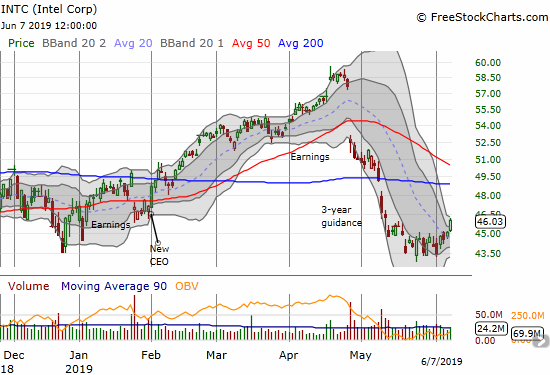
Intel (INTC)
Intel (INTC) is bearish because it is below both its 200DMA and declining 50DMA. Still, the stock is breaking out of a type of bottoming consolidation pattern and should be good for a bounce going into overhead resistance. I bought a fresh batch of call options in anticipation of such a move.
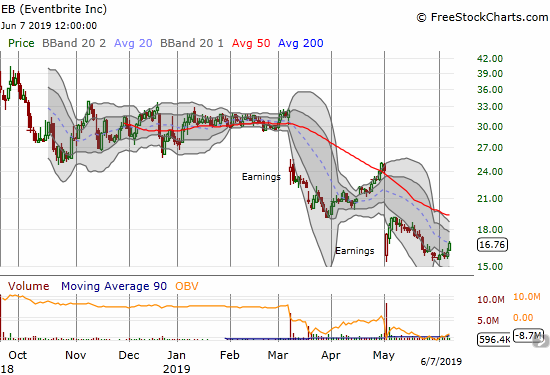
Eventbrite (EB)
Eventbrite (EB) also looks like it is breaking out from a bottoming pattern but volume was very poor on Friday’s move. The stock closed at 20DMA resistance. I think the stock should test 50DMA resistance if the mood of the stock market stays strong, but it will be a short candidate at that point.
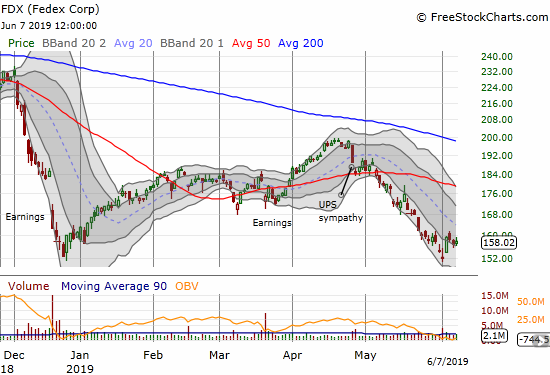
Federal Express (FDX)
Federal Express (FDX) barely nudged its way out of its primary downtrend through its lower Bollinger Band (BB). I have a July put spread in the stock, and I almost took profits on Monday’s selling. The stock looks like it has bottomed just based on bouncing away from the December low (double bottom anyone?). Still, the stock needs to break above last week’s high to make that bottom convincing. At that point, FDX becomes an obvious play for a test of 50DMA resistance.
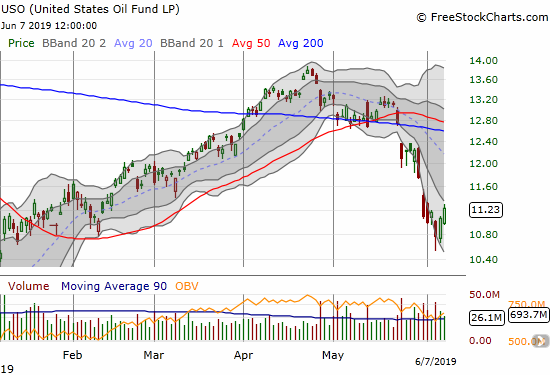
United States Oil Fund (USO)
United States Oil Fund (USO) is another equity that is in a bearish position that I am playing for a rebound. Oil has sold off sharply since late April; the selling took a brief break in early May. Oil is “due” for a rebound and will have the tail at its back with the promise of easier monetary policy on the way.
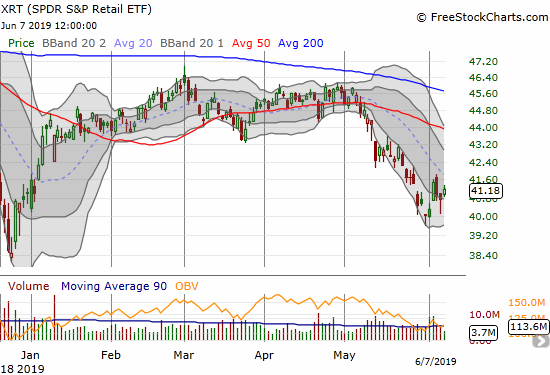
SPDR S&P Retail ETF (XRT)
The SPDR S&P Retail ETF (XRT) surged with the market on Tuesday but failed to keep up from there. Ironically, I jumped into XRT calls as a way to play a bounce from oversold conditions. Even last Monday’s single bullish stock, retailer Williams Sonoma (WSM), sold the last three days and finished the week below its 200DMA and closed at a post-earnings low.
Stock Chart Reviews – Bullish
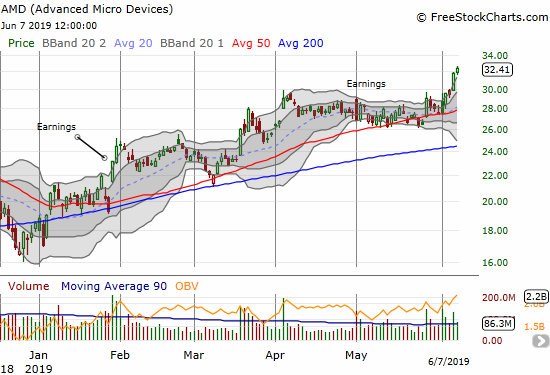
Advanced Micro Devices (AMD)
I was caught leaning the wrong way on Advanced Micro Devices (AMD). I thought the stock would continue trading further below its 50DMA in May. Instead, the stock has shown impressive relative strength. For example, the stock ended May relatively flat for the month. I should have treated the retest of 50DMA support at that point as a buying opportunity. AMD is already up 18.2% for the month of June.
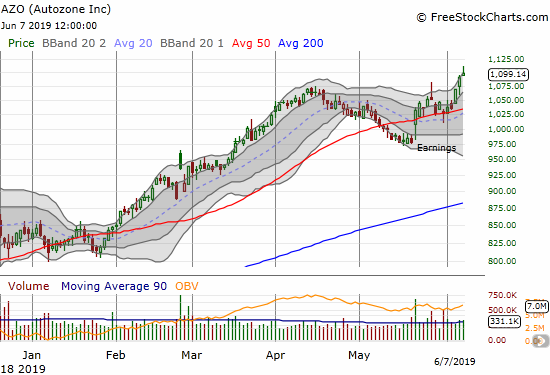
Autozone (AZO)
The post-earnings momentum continues for Autozone (AZO). The stock made an all-time high last week.
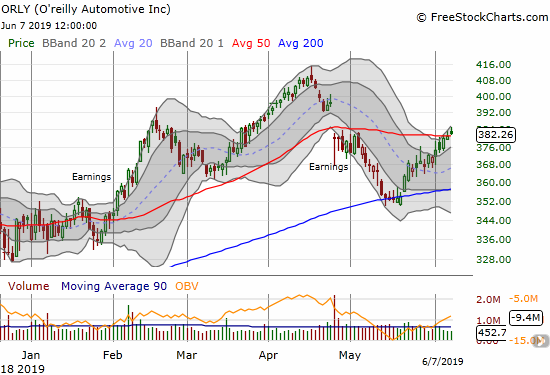
O’reilly Automotive (ORLY)
AZO is dragging ORLY upward in sympathy. The stock successfully bounced off 200DMA support and barely made a 50DMA breakout last week. With a new post-earnings high, the stock is in confirmed bullish position even if it experiences a (small) setback from here.
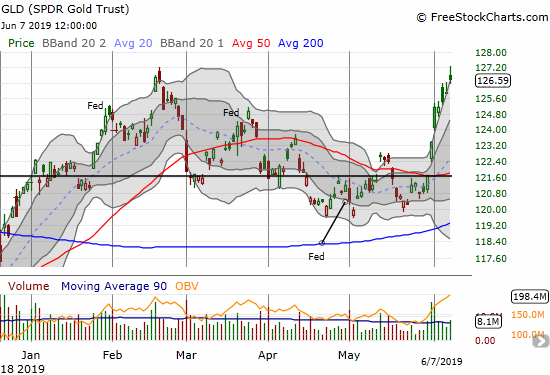
SPDR Gold Trust (GLD)
The promise of more easy money has been good to gold. SPDR Gold Trust (GLD) has gained 8 straight trading days including a strong 50DMA breakout that I should have bought. I somehow missed this entire move for a swing trade. With GLD closing above its upper-BB 6 straight days and up against its high of the year, it is “due” for a rest – I want to buy that dip as long as the market is still enthusiastically looking forward to rate cuts.
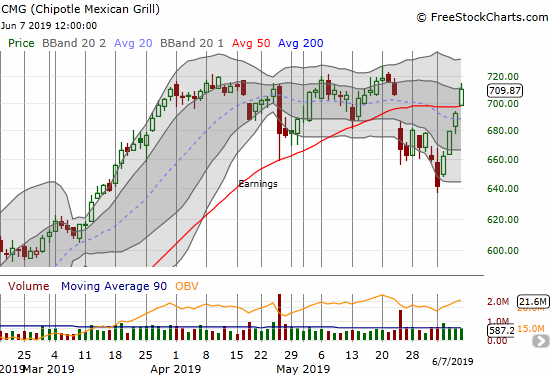
Chipotle Mexican Grill (CMG)
Last Monday, CMG looked ready for an extended sell-off. I bought a June 630/620 put spread the next day. I should have waited for the rendezvous with overhead 50DMA resistance. CMG blew past that resistance on Friday and closed the gap that created the 50DMA breakdown. The stock is back in bullish position. The stock still needs to clear the congestion that started in April to confirm the new breakout.
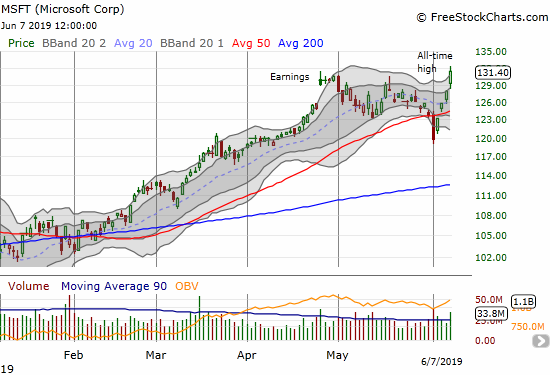
Microsoft (MSFT)
Seeing the carnage in Microsoft (MSFT) helped convince me that big cap tech would continue to suffer selling pressure. I should have kept my eye on MSFT. This stock was perhaps my biggest miss of the week as I should have bought the 50DMA breakout. Now, MSFT is right back to an all-time high. MSFT is clearly a buy on dips for sing trades.
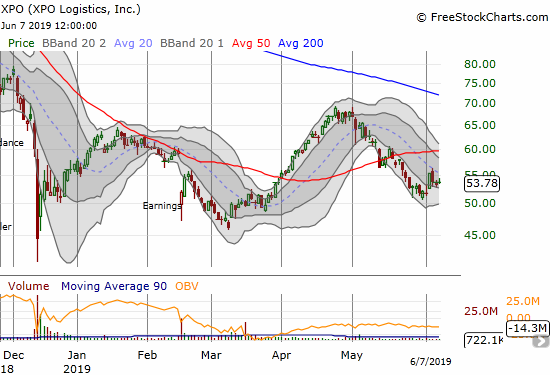
XPO Logistics (XPO)
XPO Logistics (XPO) is similar to FDX except it came far short of retesting its March low, much less its December low. With the April high surpassing the January high, the stock looks like it is slowly but surely turning the corner – higher highs and higher lows. So while it trades below a now uptrending 50DMA and a declining 200DMA, I put the stock in the bullish camp…especially given the company is still (presumably) repurchasing shares.
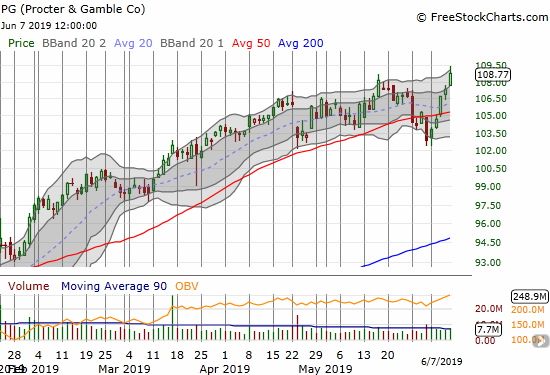
Proctor & Gamble (PG)
I thought Proctor & Gamble (PG) was in a lose-lose situation. PG totally surprised me by sharply rebounding with the stock market. I thought a rally last week would cause money to flood out of the “safety” of PG and into riskier stocks. Instead, PG benefited like so many others from the market’s change in mood. Call me stubborn, but PG still just seems far too expensive to continue trading at these lofty levels no matter the market sentiment. I am keeping my eye on it.
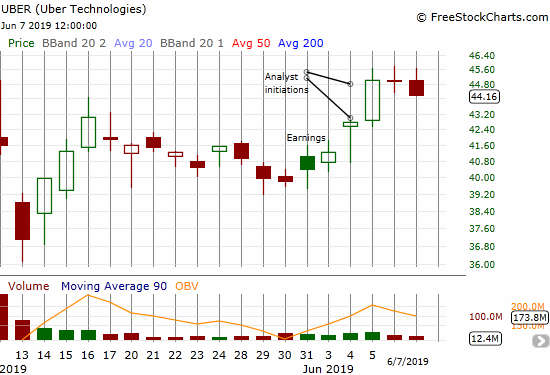
Uber (Uber)
My bullish pre-earnings trade in Uber (UBER) worked out very well. Now can the stock rally above its $45 IPO price?
— – —
FOLLOW Dr. Duru’s commentary on financial markets via email, StockTwits, Twitter, and even Instagram!
“Above the 40” uses the percentage of stocks trading above their respective 40-day moving averages (DMAs) to assess the technical health of the stock market and to identify extremes in market sentiment that are likely to reverse. Abbreviated as AT40, Above the 40 is an alternative label for “T2108” which was created by Worden. Learn more about T2108 on my T2108 Resource Page. AT200, or T2107, measures the percentage of stocks trading above their respective 200DMAs.
Active AT40 (T2108) periods: Day #104 over 20%, Day #4 over 30% (overperiod), Day #12 under 40% (underperiod), Day #23 under 50%, Day #23 under 60%, Day #66 under 70%
Daily AT40 (T2108)
")
Black line: AT40 (T2108) (% measured on the right)
Red line: Overbought threshold (70%); Blue line: Oversold threshold (20%)
Weekly AT40 (T2108)

*All charts created using FreeStockCharts unless otherwise stated
The T2108 charts above are my LATEST updates independent of the date of this given AT40 post. For my latest AT40 post click here.
Related links:
The AT40 (T2108) Resource Page
You can follow real-time T2108 commentary on twitter using the #T2108 or #AT40 hashtags. T2108-related trades and other trades are occasionally posted on twitter using the #120trade hashtag.
Be careful out there!
Full disclosure: long GOOG shares, short FB shares and long calls, long AAPL put spread, long WSM put, long NFLX put, long AMD puts, long CAT put spread, long PG puts, long FDX put spread, long GLD, short USD/MXN, long MU calls, long INTC calls, long USO calls, long XRT calls, long XPO calls
*Charting notes: FreeStockCharts stock prices are not adjusted for dividends. TradingView.com charts for currencies use Tokyo time as the start of the forex trading day. FreeStockCharts currency charts are based on Eastern U.S. time to define the trading day.
Correction on AAPL disclosure: I forgot I purchased a $195 calendar call option with the short side expiring this week and the long side expiring the following week. The configuration is to avoid chasing the stock this week in anticipation of more follow-through next week.