
AT40 = 25.2% of stocks are trading above their respective 40-day moving averages (DMAs)
AT200 = 39.3% of stocks are trading above their respective 200DMAs
VIX = 17.9
Short-term Trading Call: neutral
Stock Market Commentary
AT40 (T2108), the percentage of stocks trading above their respective 40DMAs, broke through 30% and closed at 25.2%. My favorite technical indicator is just another down day from oversold territory (below 20%), a position it has not seen in 95 trading days. Given the stock market’s slow drift downward, the question remains whether the stock market is “close enough” to oversold to buy. So far, the technical picture is too mixed to make a call and sticking by the neutral short-term trading call seems appropriate. However, the balance of power looks like it is subtly shifting to the bulls. On the bearish side, a convincing close below key supports would reinforce the precariousness of the current market conditions even as such a move would likely bring the stock market into oversold conditions.
The S&P 500 (SPY) clung to support at its flattening 200-day moving average (DMA) after punching through support and hitting the bottom of its lower Bollinger Band (BB). In near synchronized action, the NASDAQ (NDX) printed a similar move.
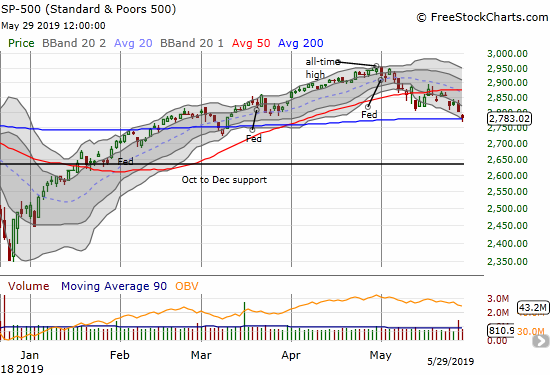
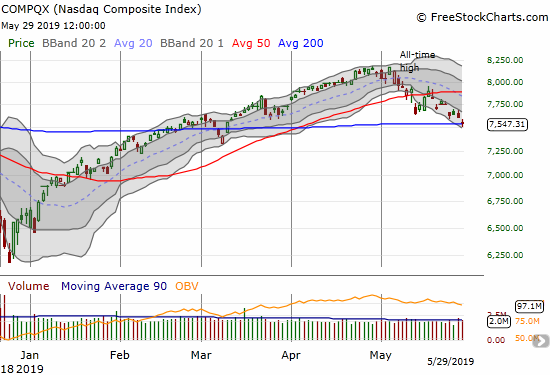
The S&P 500 formed a hammer while the NASDAQ formed a small doji or “spinning body.” Both become bottoming patterns if buyers follow-through with a higher close by the end of the week. Such a bottoming will look all the more convincing given the bounces from 200DMA support.
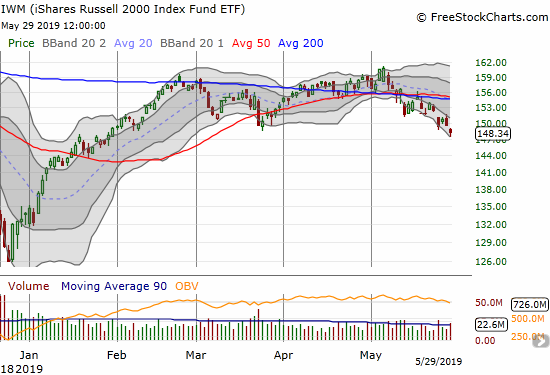
While the iShares Russell 2000 ETF (IWM) made a move similar to the S&P 500 and the NASDAQ, its close placed the index in a bearish position. IWM broke through support at the March lows. The index of small-caps flags the clear potential for sellers to take the other major indices right through critical support in short order. IWM’s breakdown prevents me from getting bullish, but I bought call options as a first move in anticipation of the next market bounce. Like previous IWM call options, I will be inclined to sell them into the first profitable bounce.
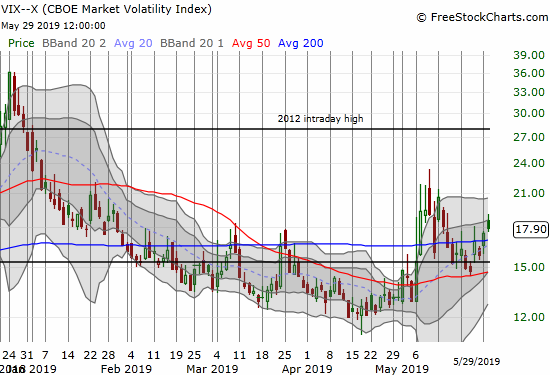
The volatility index (VIX) gained 2.3% but still faded off its intraday high. I am surprised the VIX did not surge a lot higher given the important technical breakdowns in the major indices. However, perhaps traders anticipated that buyers would defend supports on the S&P 500 and the NASDAQ. I used another gain in the VIX as an opportunity to buy another put on Ultra VIX Short-Term Futures ETF (UVXY) expiring next Friday.
The currency markets are also starting to favor the bulls. The Australian dollar (FXA) versus the Japanese yen (JPY) has finally stopped declining despite the recent dovish turn in the Reserve Bank of Australia. AUD/JPY has now consolidated for two weeks above the flash crash lows from January. The important currency pair is creating a bullish divergence with the stock market.
Stock Chart Reviews – Bearish
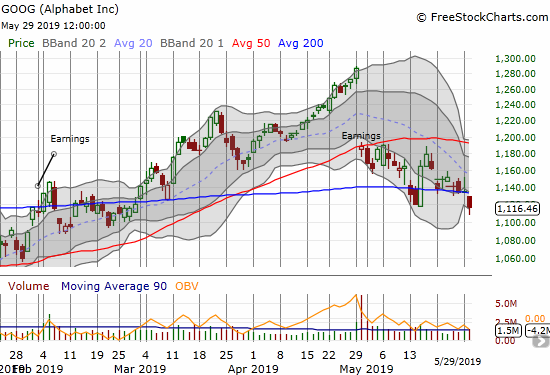
Alphabet (GOOG)
Alphabet (GOOG) broke down below its 200DMA again and in the process printed a new post-earnings low. This is a double-bearish move that suddenly finished reversing the sudden (and strange) price surge from two weeks ago. GOOG could be a fresh warning on big cap tech.
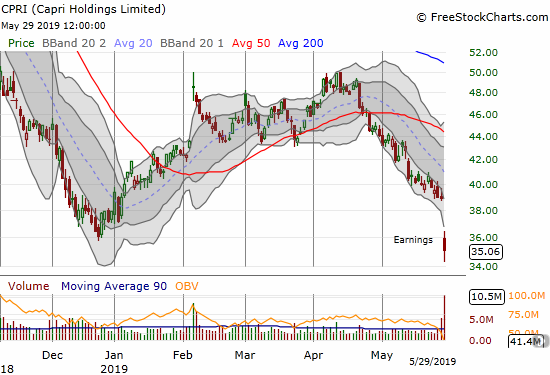
Capri Holdings (CPRI)
Luxury retailer Capri Holdings (CPRI) is the latest retailer to get slammed post-earnings. The technicals going into earnings warned of potential trouble. The stock double-topped in April, followed soon by a 50DMA breakdown, and all confirmed with a punch through the February to March triple support level. Sellers kept up the pressure through the lower-BB channel for a month. I wish I noticed these signs BEFORE earnings…!
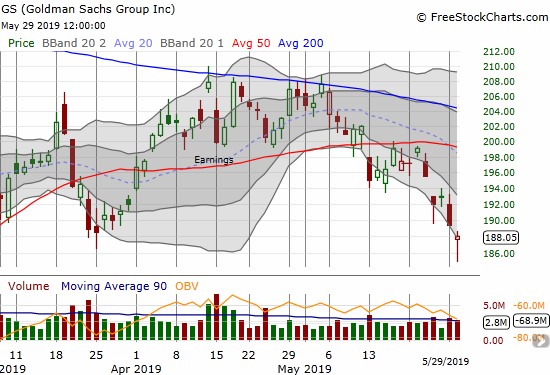
Goldman Sachs (GS)
Goldman Sachs (GS) is trying to hold the line at its March low, but I put it in the bearish camp given its double failure at descending 200DMA resistance and a 50DMA breakdown. I am wishing I still held my short position in GS. A relief rally in GS would likely end at the top of the lower-BB.
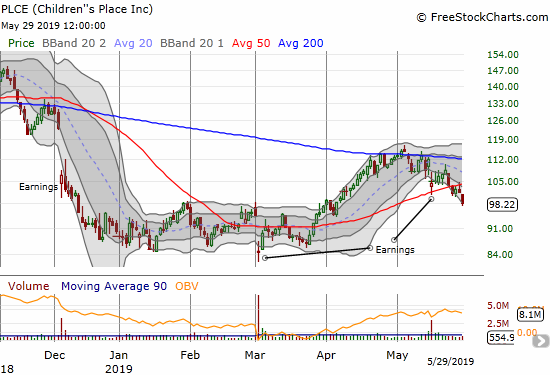
Children’s Place (PLCE)
I was bullish on Children’s Place (PLCE) for months as it consolidated off the December low. The April breakout vindicated my patience. However, with the 200DMA successfully holding stiff resistance, a 50DMA breakdown after a failed post-earnings recovery, and the general malaise descending upon retail, it is time for me to flip the bias on PLCE. The December low is now back in play.
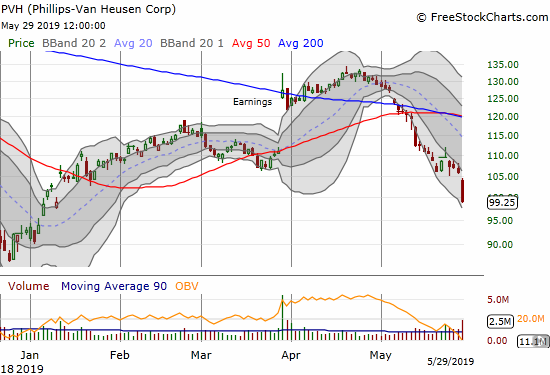
PVH Corporation (PVH)
PVH Corporation (PVH) may have provided the final confirmation of a malaise in retail. “Someone” must have gotten “the drop” on PVH earnings as the stock plunged before the report. In after hours, the stock closed down another 11% in the wake of a very somber outlook. In the interview below with CNBC’s Jim Cramer, PVH CEO Manny Chirico admits to the sudden downturn in the retail outlook. (I duly noted Cramer’s reluctance to accept the bearish message coming from Chirico). Chirico warned of a challenging second half of the year ahead. Such a forecast is particularly important because it includes the all-important holiday season.
I have done little trading in retail even as all the warning signs have dropped all over the market. PVH has finally made me stand up and take notice. Thanks to PVH, I expect rallies from here to end in short order as dead cat bounces…even if they start from oversold conditions.
Calvin Klein-parent CEO: Our growth has slowed, but not from tariffs from CNBC.
Stock Chart Reviews – Bullish
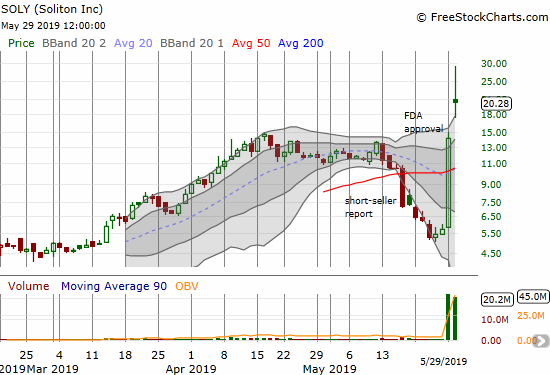
Soliton (SOLY)
Just over a week ago I covered the buying opportunity in Soliton (SOLY). I only managed to accumulated about 40% of the stock I wanted before it took off. As I stated I would, I sold my position into the run-up on good news from the FDA. The stock was up 80% at the time I sold, and I did not want to be greedy – not to mention my mistake in Axovant Sciences (AXGT) was playing in my head.
SOLY went on to close up 148.2% on Tuesday! Today, it gained another 42% and was up as much as another 104.0% before fading into its close. Needless to say, this episode reminded me that the proper trading strategy in these extreme situations is to sell half and then ride the house’s money.
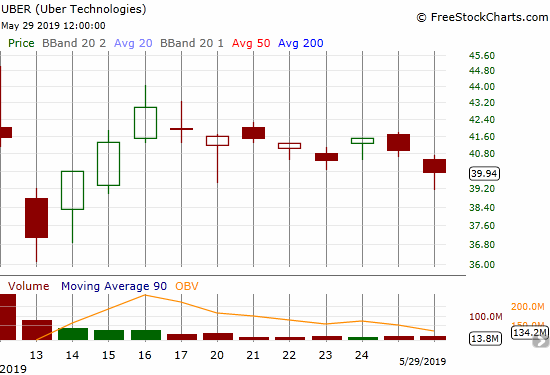
Uber (UBER)
Uber (UBER) is in the bullish camp only because it is clinging to a consolidation pattern. Soon after the IPO, I made the case for going long UBER. I was able to exit my subsequent purchase with a profit; now I see the potential for another long trade ahead of earnings. CNBC’s Fast Money observed high volume trading in the June 7th weekly $43.50 call options as an indication of bullish expectations for earnings. These options seem “cheap” at $0.53/$0.55 given the potential for the stock to race back to its $45 IPO price in a contrarian move. The stock market’s near oversold conditions also make me more inclined to buy call options.
Note well that there was also heavy trading action at the $42 strike of the June 7 weekly calls that Fast Money failed to cover. With a bid/ask spread around $.30/$.35 for the $42/$43.5 call spread, I like this as an even better risk/reward way to play a contrarian bump higher post-earnings. For comparison, the $37 June 7 put costs $0.70/$0.75. Options pricing is anticipating a 9% move in UBER by the end of next week…making the call spread even more attractive.
— – —
FOLLOW Dr. Duru’s commentary on financial markets via email, StockTwits, Twitter, and even Instagram!
“Above the 40” uses the percentage of stocks trading above their respective 40-day moving averages (DMAs) to assess the technical health of the stock market and to identify extremes in market sentiment that are likely to reverse. Abbreviated as AT40, Above the 40 is an alternative label for “T2108” which was created by Worden. Learn more about T2108 on my T2108 Resource Page. AT200, or T2107, measures the percentage of stocks trading above their respective 200DMAs.
Active AT40 (T2108) periods: Day #97 over 20% (overperiod), Day #1 under 30% (underperiod, ending 97 days over 30%), Day #5 under 40%, Day #16 under 50%, Day #16 under 60%, Day #59 under 70%
Daily AT40 (T2108)
")
Black line: AT40 (T2108) (% measured on the right)
Red line: Overbought threshold (70%); Blue line: Oversold threshold (20%)
Weekly AT40 (T2108)

*All charts created using FreeStockCharts unless otherwise stated
The T2108 charts above are my LATEST updates independent of the date of this given AT40 post. For my latest AT40 post click here.
Related links:
The AT40 (T2108) Resource Page
You can follow real-time T2108 commentary on twitter using the #T2108 or #AT40 hashtags. T2108-related trades and other trades are occasionally posted on twitter using the #120trade hashtag.
Be careful out there!
Full disclosure: long UVXY puts, long IWM calls, long AXGT, long AUD/JPY
*Charting notes: FreeStockCharts stock prices are not adjusted for dividends. TradingView.com charts for currencies use Tokyo time as the start of the forex trading day. FreeStockCharts currency charts are based on Eastern U.S. time to define the trading day.