
AT40 = 39.5% of stocks are trading above their respective 40-day moving averages (DMAs)
AT200 = 45.4% of stocks are trading above their respective 200DMAs
VIX = 16.0
Short-term Trading Call: neutral (downgrade from cautiously bullish)
Stock Market Commentary
The last 5 or 6 trading days have been good for bulls and buyers. It was fun while it lasted, but I am switching my short-term trading call back to neutral given the topping action in the stock market. Many of the bullish setups I described in my last Above the 40 post also look a lot more precarious thanks to two straight days of fading in the trading action.
On Monday, a strong market rally ended on a weak note with a notable fade off intraday highs. Today, the stock market gapped up at the open again, but sellers controlled most of the trading action from there. Suddenly, sellers and bears have managed to hold a line of resistance that indicates a change in the tone of trading. Of course, if buyers answer the challenge with a higher close, I expect the stock market to return to its more bullish programming.
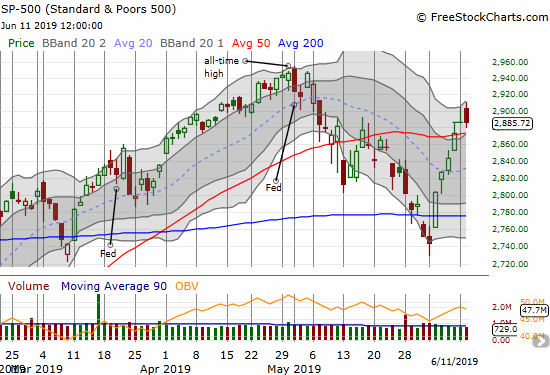
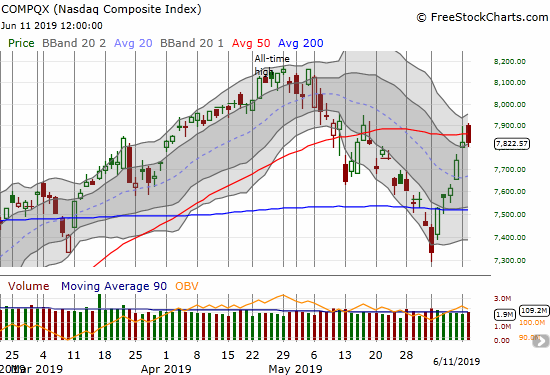
The S&P 500 (SPY) and the NADSAQ ended the day essentially flat with the tech-laden index suffering a particularly bearish setback. Both indices gapped up to yesterday’s intraday high before sellers took over.
The NASDAQ (COMPQX) also gapped up on Tuesday and notched a 3.8% gain for the week. The tech-laden index still needs to contend with overhead resistance from its 50DMA.
While thestock market looks toppy, I cannot consider going bearish until the S&P 500 (SPY) confirms a fresh 50DMA breakdown. Even then, AT40 (T2108), the percentage of stocks trading above their respective 40DMAs, may be too close to oversold for even a cautiously bearish stance to make sense. AT40 closed the day at 39.5% and of course just barely missed oversold conditions a week ago. Moreover, the next Federal Reserve decision on monetary policy is coming in a week (June 19th) – plenty of time for the market to continue its breathless anticipation of dovish commentary and confirmation of aggressive rate cuts it now expects.
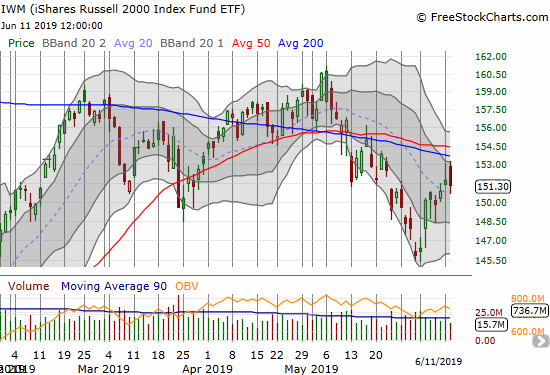
The iShares Russell 2000 ETF (IWM) added to the bearish case with a 0.3% loss and a second straight day fading from declining 200DMA resistance.
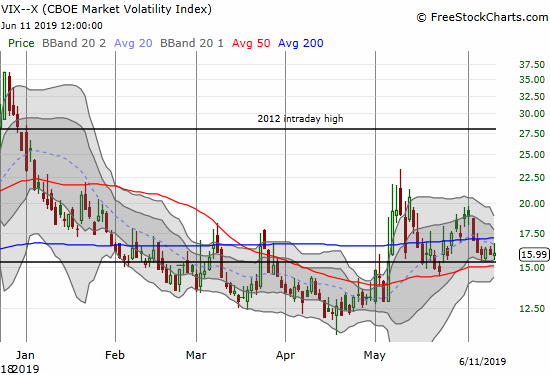
The volatility index (VIX) tested and held support at its 15.35 pivot for the fourth straight day. The resilience through much of the market’s bullish run is a distinct warning sign of an imminent launch higher in volatility. I will buy call options on Ultra VIX Short-Term Futures ETF (UVXY) with an expiration next week in anticipation of a significant move higher before expiration.
Stock Chart Reviews – Bearish
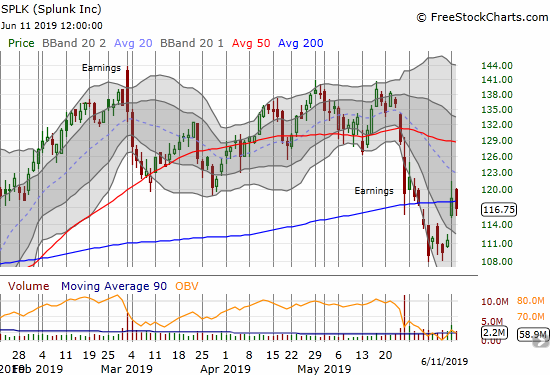
Splunk (SPLK)
Along with many software stocks, Splunk (SPLK) opened this week with significant gains. The broad-based buying looked like a natural extension of the panic buying that characterized trading going into last week’s close. SPLK ended the day of sympathy buying with a 6.4% gain and was as high as about 8% at one point. Given the 200DMA breakout, I decided to buy a calendar call spread at the $125 strike. Today’s close under the 200DMA puts SPLK back into bearish territory and puts my position into immediate jeopardy. I am just going to ride it out from here.
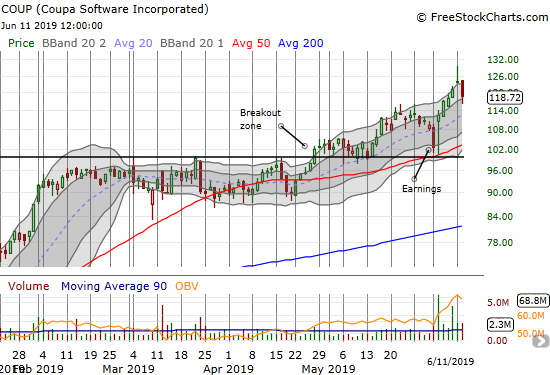
Coupa Software (COUP)
Coupa Software (COUP) is riding an impressive breakout and uptrend, but the stock flamed out significantly after Monday’s buying. On Monday, COUP traded as high as 6.8% before closing near flat on the day. Today’s 4.1% drop confirmed a bearish shooting star pattern even though the stock still closed within its uptrending upper Bollinger Band (BB) channel. Many stocks printed similar patterns thanks to Monday’s fade, but this shooting star is particularly ominous given it happened off all-time highs and from above the upper-BB. Moreover, COUP reported earnings last week that the market poorly received. In other words, the move looks like a blow-off top that at least puts 50DMA support back into play.
I was riding a 125/130 call spread into this week that I failed to sell on Monday. Today, I quickly bought a put option expiring next Friday alongside the call spread as a backstop to the bullish position.
Stock Chart Reviews – Bullish
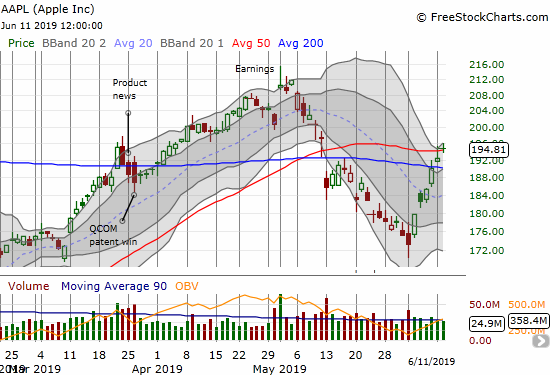
Apple (AAPL)
Apple (AAPL) is actually a stock that moved from bearish to bullish since my last post. While I do not think this setup will endure, I still have to acknowledge the bullishness of confirming a 200DMA breakout with a 50DMA breakout.
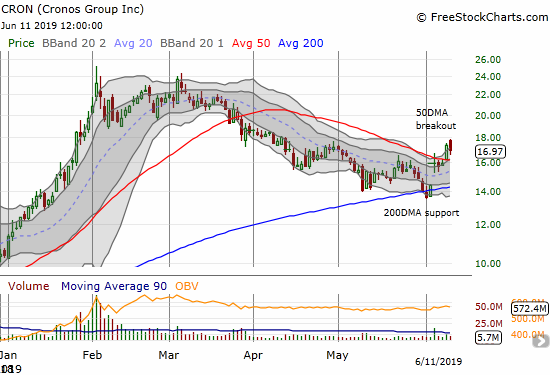
Cronos Group (CRON)
Cronos Group (CRON) traded down from a double top for three straight months with little relief. However, it defended 200DMA support at the start of the month and yesterday broke out above its 50DMA. Note that today’s 2.4% prevented confirmation of the breakout and provides a note of caution. I am a buyer given this stock is immune from trade war headlines. I will put a stop loss below 15.25, the low point after the gap up from 200DMA support.
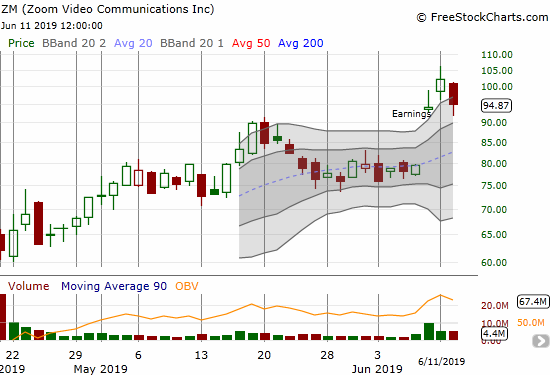
Zoom Video Communications (ZM)
I was tempted to put Zoom Video Communications (ZM) in the bearish camp for toppy action. The stock is still bullish because it trades above the previous all-time high set last month. The stock also closed above its first post-earnings close. If ZM breaches the May high, I then expect it to finish filling the post-earnings gap up. I prefer to trade this setup with options like a call spread or even a calendar call spread at the $100 or $105 strike.
— – —
FOLLOW Dr. Duru’s commentary on financial markets via email, StockTwits, Twitter, and even Instagram!
“Above the 40” uses the percentage of stocks trading above their respective 40-day moving averages (DMAs) to assess the technical health of the stock market and to identify extremes in market sentiment that are likely to reverse. Abbreviated as AT40, Above the 40 is an alternative label for “T2108” which was created by Worden. Learn more about T2108 on my T2108 Resource Page. AT200, or T2107, measures the percentage of stocks trading above their respective 200DMAs.
Active AT40 (T2108) periods: Day #106 over 20%, Day #6 over 30% (overperiod), Day #14 under 40% (underperiod), Day #25 under 50%, Day #25 under 60%, Day #68 under 70%
Daily AT40 (T2108)
")
Black line: AT40 (T2108) (% measured on the right)
Red line: Overbought threshold (70%); Blue line: Oversold threshold (20%)
Weekly AT40 (T2108)

*All charts created using FreeStockCharts unless otherwise stated
The T2108 charts above are my LATEST updates independent of the date of this given AT40 post. For my latest AT40 post click here.
Related links:
The AT40 (T2108) Resource Page
You can follow real-time T2108 commentary on twitter using the #T2108 or #AT40 hashtags. T2108-related trades and other trades are occasionally posted on twitter using the #120trade hashtag.
Be careful out there!
Full disclosure: long SPLK calendar call spread, long COUP call spread and put option, long AAPL put spread and calendar call spread
*Charting notes: FreeStockCharts stock prices are not adjusted for dividends. TradingView.com charts for currencies use Tokyo time as the start of the forex trading day. FreeStockCharts currency charts are based on Eastern U.S. time to define the trading day.