
AT40 = 24.1% of stocks are trading above their respective 40-day moving averages (DMAs)
AT200 = 37.9% of stocks are trading above their respective 200DMAs
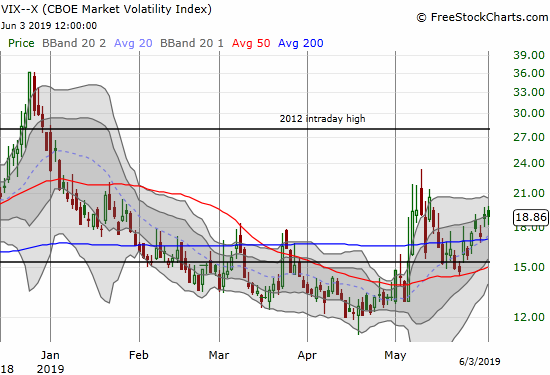
VIX = 18.9
Short-term Trading Call: neutral
Stock Market Commentary
“The stock market might turn at lower levels.”
Jim Cramer, CNBC’s Mad Money, June 3, 2019
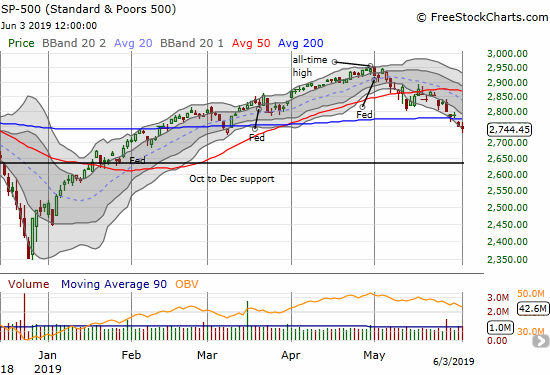
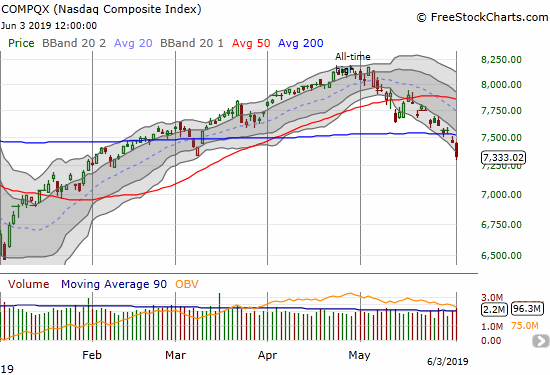
This truism is a bit silly, but it is a reminder of both the power and the risks of trading oversold levels. I expected to dive into the risks and opportunities of oversold trading this week. However, a subtle bullish divergence may delay a dive into oversold territory for stocks. The big story of the day was a vicious sell-off in big cap tech stocks that, somehow, did not translate into broader damage across the stock market. While the NASDAQ lost 1.6% and confirmed Friday’s bearish 200-day moving average (DMA) breakdown, the S&P 500 (SPY) only lost a fraction of a percent. Most importantly, AT40 (T2108), the percentage of stocks trading above their 40DMAs, INCREASED slightly and did not even break the low from Friday. The 20% threshold for oversold conditions remains unbroken.
I was so sure that the day would end in oversold trading conditions that I jumped into a position in Alphabet (GOOG).
GOOG is the “G” end of FANG, aka Facebook (FB), Amazon (AMZN), Netflix (NFLX), and Google (now Alphabet). Despite losing 7.5%, 4.6%, 1.9%, and 6.1% respectively, FANG could not bite its way into oversold trading conditions. Even the carnage in other big cap tech stocks like Microsoft (MSFT) and Salesforce.com (CRM) failed to bite as well.
While these stocks look well overdone to the downside, I do not want to downplay the additional downside risks in these stocks. The U.S. House Judiciary Committee made it clear that a bi-partisan effort is underway to investigate the tech giants that dominate our digital lives. From the press release:
“Today, the House Judiciary Committee announced a bipartisan investigation into competition in digital markets…
A small number of dominant, unregulated platforms have extraordinary power over commerce, communication, and information online. Based on investigative reporting and oversight by international policymakers and enforcers, there are concerns that these platforms have the incentive and ability to harm the competitive process. The Antitrust Subcommittee will conduct a top-to-bottom review of the market power held by giant tech platforms. This is the first time Congress has undertaken an investigation into this behavior. “
Democrats and Republicans rarely cooperate on anything anymore. So this cooperation means a high probability exists that Congress will succeed in constraining the activities of at least some of its targets, even if the action unfolds over years. This cooperation on anti-trust matters is bad enough news for tech giants. Even worse is that Congress looks willing to write laws to force the Justice Department into action. The third bullet point explaining what the Committee will investigate makes the threat clear: it will assess “…whether existing antitrust laws, competition policies, and current enforcement levels are adequate to address these issues.”
Until public hearings begin, the market will likely treat these stocks with great suspicion. In other words, these stocks are damaged goods and will not likely break through overhead resistance levels anytime soon. Of course, for some stocks like GOOG and FB, those prospects still leave plenty of overhead space for relief rallies.
The bite of FANG was so weak that investors and traders could barely be bothered to scramble for index put options. The volatility index (VIX) barely budged and never cracked the important 20 level. The timidity of the VIX during the past month or so of selling has kept me expecting more selling ahead.
As I mentioned in my last Above the 40 post, I normally would have considered Friday’s bounce just above the oversold threshold to be “close enough” to trigger my oversold trading strategy. Friday’s 200DMA breakdowns in the S&P 500 and the NASDAQ stayed my hand. Now I have the carnage in big cap tech as another excuse. If the market fails to setup oversold buying conditions, then the next point for aggressive buying would be a 200DMA breakout followed by the confirmation of a higher close than the breakout close.
Currency Indicators: Australian dollar and the Japanese yen (AUD/JPY)
The Australian dollar (FXA) versus the Japanese yen (FXY) added to the case for bullish divergence. AUD/JPY broke down on Friday but failed to follow-through. At the time of writing AUD/JPY is still floating higher from the brief intraday lows of Sunday night. A well-anticipated rate cut from the Reserve Bank of Australia (RBA) barely nudged the Australian dollar at the time of writing.
Stock Chart Reviews – Bearish
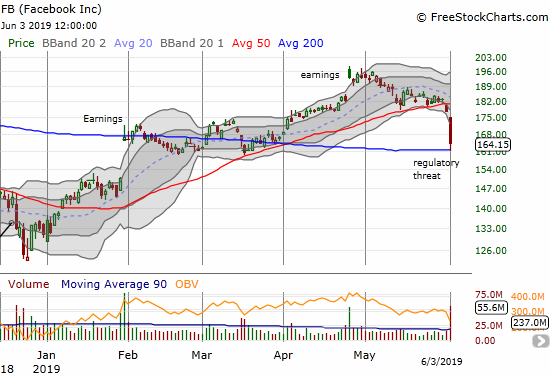
Facebook (FB)
Facebook (FB) provided a stark reminder of the importance of paying attention to key breakdowns. The stock broke down below its 50DMA on Friday and setup the vicious selling on Monday. Sellers took the stock all the way down to 200DMA support before buyers finally stepped in. The stock closed the day with nasty 7.5% loss.
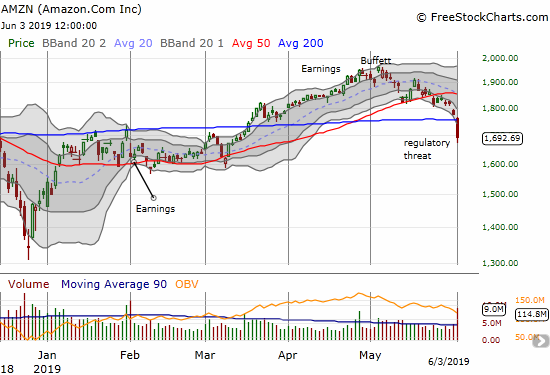
Amazon.com (AMZN)
Amazon.com (AMZN) peaked after gapping up on news that Berkshire Hathaway finally bought shares in the previous quarter. Sellers slowly took profits from there. Today’s profit-taking was fast with a bearish 200DMA breakdown and a 4.6% one-day loss.
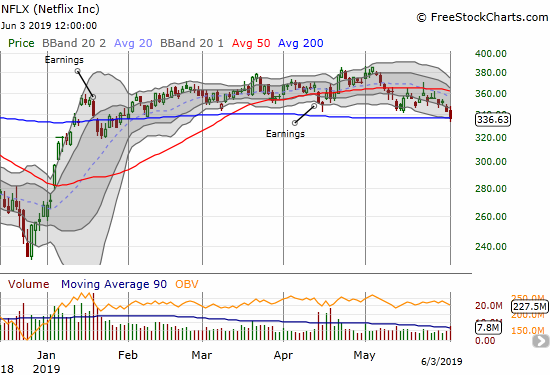
Netflix (NFLX)
Netflix (NFLX) fared the best out of the FANG stocks. While the company dominates the digital streaming of movies, I highly doubt the House Judicial Committee has NFLX on its hit list. Consumers have a LOT of streaming options. Still, the stock’s 1.9% loss was enough to put NFLX on the edge of a bearish 200DMA breakdown. NFLX has traded in a tight range since January earnings.
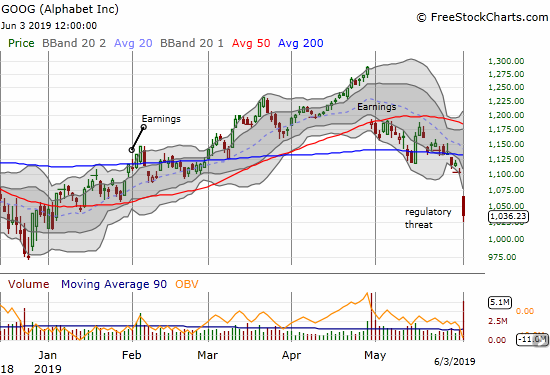
Alphabet (GOOG)
The sellers were so vicious in Alphabet (GOOG) that the stock gapped down below its lower Bollinger Band (BB) and just kept pushing lower. The stock is extremely stretched to the downside with a 6.1% loss and now a flat performance for 2019. At its all-time high just before April earnings, GOOG was up 24.3%. I cannot help thinking and acting like this is a major buying opportunity even with the regulatory risk threatening to weigh the stock down for some time to come.
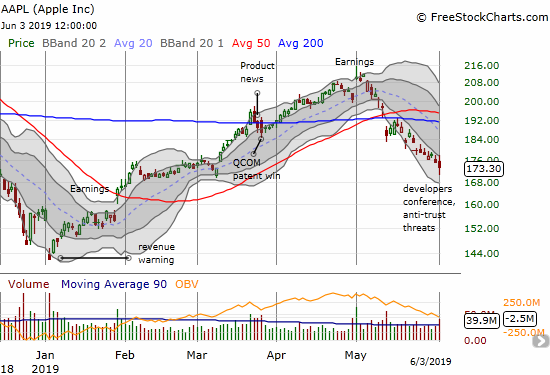
Apple (AAPL)
Like the rest of the market, Apple (AAPL) was happily ignoring the carnage in FANG as fans settled in for the company’s developer’s conference. When news broke that AAPL could also be a target, the stock dropped like a rock. Somehow, buyers managed to rally the stock back to just a 1.0% loss. The swoosh took me out of a put spread I bought as a trade war play and hedge against my weekly call option play. For good measure, I added a call to this week’s play. Clearly, the last month has not been kind to this trading strategy!
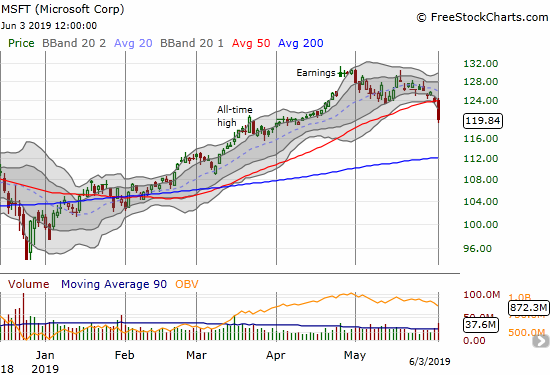
Microsoft (MSFT)
When I saw the bearish breakdown in Microsoft (MSFT), I became deeply surprised that the stock market managed to escape oversold trading conditions. Today’s carnage was clearly very concentrated!
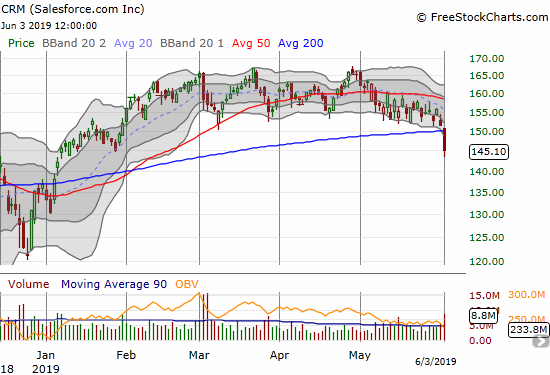
Salesforce.com (CRM)
Salesforce.com (CRM) was working on a 4-month trading range until today’s bearish breakdown below 200DMA support. CRM reports earnings the evening of June 4th. These earnings could deliver a key pivot point for CRM and related cloud stocks. At Monday’s close, the stock market was pricing in a 6.2% up or down post-earnings move at the end of this week.
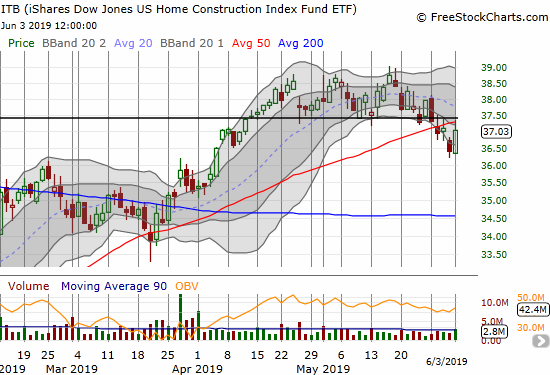
iShares Dow Jones Home Construction ETF (ITB)
The iShares Dow Jones Home Construction ETF (ITB) put on an impressive display of relative strength. Likely thanks to another drop in interest rates, ITB managed to gain 1.7%. While this move seemed to put my topping thesis in jeopardy, the index still faded neatly from the dual resistance of the 50DMA and the closing price ahead of the start of the October and Fall sell-off.
Stock Chart Reviews – Bullish
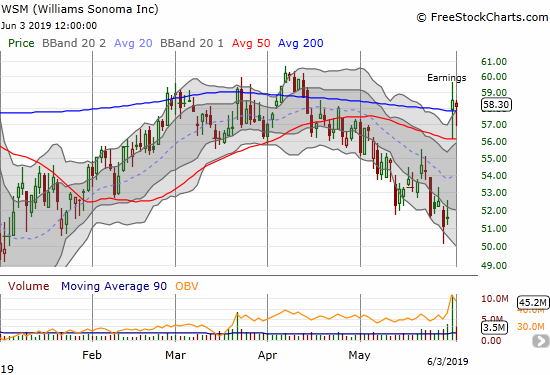
Williams Sonoma (WSM)
I HAD to find something to put in the bullish section.
I made several bets against retailer earnings last week. Williams Sonoma (WSM) was one that actually failed; the stock surged post earnings more than 11%. I was quite surprised to see such a specialty retailer do so well post-earnings after seeing so many other retail disasters across the spectrum. Now WSM is a stock to watch. It is bullish for now because it gapped above its 200DMA and held support today. The stock is not truly in the clear until it closes above its April peak and 2019 high.
— – —
FOLLOW Dr. Duru’s commentary on financial markets via email, StockTwits, Twitter, and even Instagram!
“Above the 40” uses the percentage of stocks trading above their respective 40-day moving averages (DMAs) to assess the technical health of the stock market and to identify extremes in market sentiment that are likely to reverse. Abbreviated as AT40, Above the 40 is an alternative label for “T2108” which was created by Worden. Learn more about T2108 on my T2108 Resource Page. AT200, or T2107, measures the percentage of stocks trading above their respective 200DMAs.
Active AT40 (T2108) periods: Day #100 over 20% (overperiod), Day #4 under 30% (underperiod), Day #8 under 40%, Day #19 under 50%, Day #19 under 60%, Day #62 under 70%
Daily AT40 (T2108)
")
Black line: AT40 (T2108) (% measured on the right)
Red line: Overbought threshold (70%); Blue line: Oversold threshold (20%)
Weekly AT40 (T2108)

*All charts created using FreeStockCharts unless otherwise stated
The T2108 charts above are my LATEST updates independent of the date of this given AT40 post. For my latest AT40 post click here.
Related links:
The AT40 (T2108) Resource Page
You can follow real-time T2108 commentary on twitter using the #T2108 or #AT40 hashtags. T2108-related trades and other trades are occasionally posted on twitter using the #120trade hashtag.
Be careful out there!
Full disclosure: long UVXY puts, long AUD/JPY, long GOOG shares and vertical and calendar call spreads, short FB shares and long call spread, long AAPL calls, long WSM put spread and put, long NFLX calendar put spread
*Charting notes: FreeStockCharts stock prices are not adjusted for dividends. TradingView.com charts for currencies use Tokyo time as the start of the forex trading day. FreeStockCharts currency charts are based on Eastern U.S. time to define the trading day.
Having worked in large-scale software tech longer than even Microsoft (let alone FANG) existed, I can say confidently that Amazon, Google, and Facebook are the companies that have built monopolist power by monetizing invading the privacy of individuals. Not Apple – despite its size – and not Netscape; neither make any use of knowledge of individuals except to tailor their own services. Microsoft and Yahoo, however, could be using that tactic, specifically by recording user web searches and scanning user emails and chatboard posts. So look for those two to be pulled into this dragnet, if only because Google will try to use them as examples of existing competition. It’s not clear to me whether Twitter should be – any thoughts on that?
Twitter is not a monopolist and is competing with a lot of other communication platforms, including Facebook. Their issue will more likely be freedom of speech concerns as they continue to try cleaning up feeds and user accounts. I almost bought TWTR yesterday but decided to wait. I am guessing some headline will come suggesting Twitter is a target and I will buy on that swoosh.