
Housing Market Intro/Summary
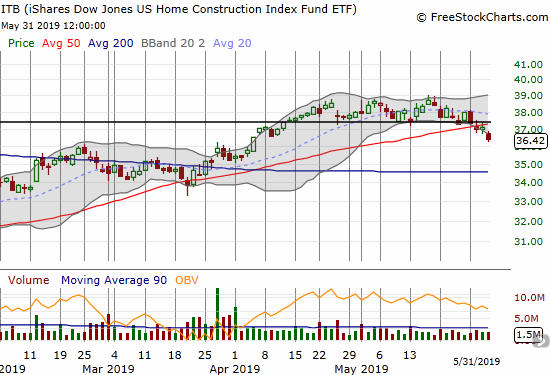
In several posts on the housing market, I made the case for a top in the stocks of home builders and pointed out the parallel weaknesses in the housing data. Last week, the iShares US Home Construction ETF (ITB) appeared to confirm what looks like a triple top in the index. Not only did ITB break down below its 50DMA, but also ITB dropped below the price that marked the start of the big Fall 2018 sell-off (the thick black horizontal line below). This line provided support since mid-April until last week.
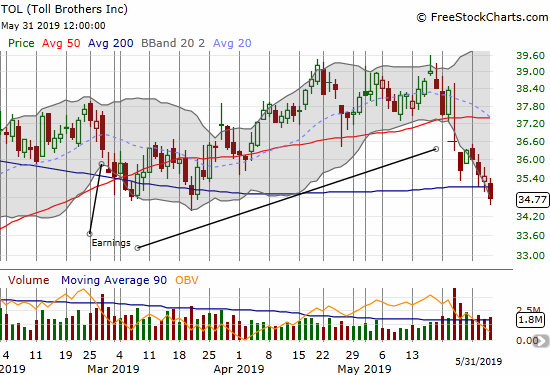
The individual stocks of important home builders are showing key confirmations of weakness. Most recently, Toll Brothers (TOL) reported earnings that the market sold. The stock dropped below its 50-day moving average (DMA) and confirmed the weakening outlook with a 200DMA breakdown to end last week.
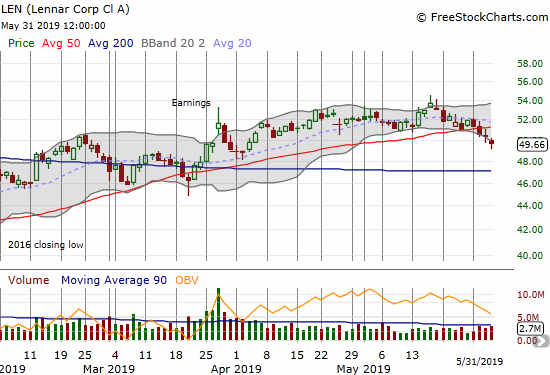
Lennar (LEN) has not yet retested its post-earnings low, but the stock confirmed a 50DMA breakdown and looks ready for a test of its 200DMA.
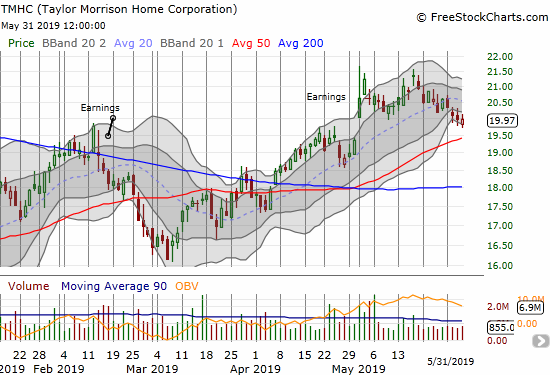
On the other hand, two home builders with recently strong earnings are still hanging in there: Talyor Morrison Home (TMHC) and William Lyon Homes (WLH). Again, my seasonal trading rules are keeping me out of these stocks for now, but I still keep them on my radar to understand where the strength still resides in the housing market (earnings reviews still pending).
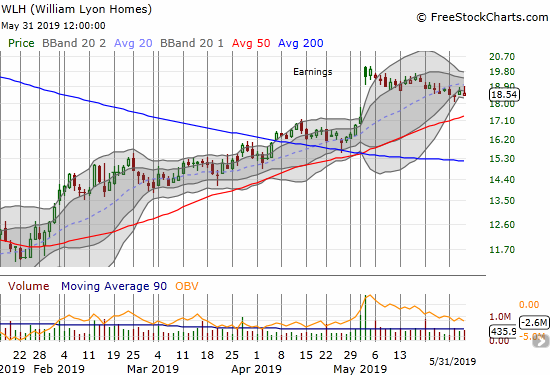
So across home builders, the picture remains mixed. Yet, a loss of momentum is consistent enough to give the impression of a top. The housing data (in aggregate) continue to confirm for me that a seasonal top in home builders will play out yet again this year. The remaining question is whether a more sustained top is underway.
New Residential Construction (Single-Family Housing Starts) – April, 2019
After a sudden burst of activity to start the year, housing starts quickly cooled off.
Single-family housing starts for March were revised upward from 785,000 to 804,000. April starts increased month-over-month by 6.5% to 854,000. On an annual basis, single-family housing starts decreased by 4.3%. The January surge is a confirmed anomaly in the middle of a downtrend: it is the only month since September to register a year-over-year gain in starts.
Last June’s year-over-year decline was the first for housing starts since August, 2016, and June’s level sat as the lowest of the year until the October to December plunge. The graphic below suggests that within a few more months housing starts could resume its downtrend from last year’s top.
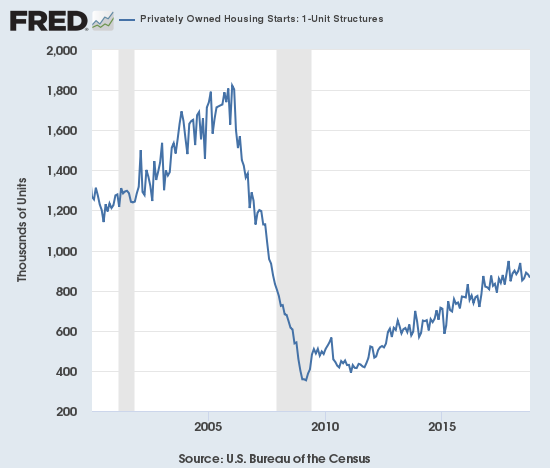
Source: US. Bureau of the Census, Privately Owned Housing Starts: 1-Unit Structures [HOUST1F], retrieved from FRED, Federal Reserve Bank of St. Louis, May 28, 2019.
When overall housing starts plunged in November, three of four regions experienced sharp declines led by the West. February’s decline took housing starts in the West back to November levels which in turn were the lowest since June, 2016. The West’s on-going declines finally took a break in April; only the South dropped. The Northeast, Midwest, South, and West each changed 20.7%, 15.4%, -13.9%, and 2.3% respectively. April demonstrated the importance and weight of home building activity in the South given its declines were enough to bring the aggregate nationwide starts number down into negative territory.
Existing Home Sales – April, 2019
The monthly downtrend for existing home sales ended in February. However, the year-over-year declines continued in April for the 14th straight month. For January’s declines, the NAR did more projecting than usual in claiming that the down cycle had come to an end. At the time, I noted that nothing in the existing home sales data confirmed such an end. February’s abrupt surge seemed to build the case for a bottoming; March and April sales data put that case right back into doubt.
The seasonally adjusted annualized sales in April of 5.19M were down 0.4% month-over-month from the unrevised 5.21M in sales for March. Year-over-year sales decreased 4.4%. In January, existing home sales were at their lowest level since November, 2015.

(As of the March, 2018 data, the NAR further reduced historical data to just 13 months. For historical data from 1999 to 2014, click here. For historical data from 2014 to 2018, click here) Source for chart: National Association of Realtors, Existing Home Sales© [EXHOSLUSM495S], retrieved from FRED, Federal Reserve Bank of St. Louis, May 28, 2019.
In the November, 2018 report the NAR strained to paint a story of increasing demand. The NAR used the monthly gain in sales to celebrate: “After six consecutive months of decline, buyers are finally stepping back into the housing market…” With buyers still stepping away from the market, the NAR in February reached for a market bottom (emphasis mine): “Existing home sales in January were weak compared to historical norms; however, they are likely to have reached a cyclical low.” I countered that substantial year-over-year declines still indicated that the more meaningful trend remained downward. My claim stands.
For months the NAR has pointed to rising inventories as a positive sign. April’s report was no exception: “We see that the inventory totals have steadily improved, and will provide more choices for those looking to buy a home.” Yet, despite the rise in inventories, now nine months running, median prices continue to increase and sales keep trending downward. Until proven otherwise, higher inventories are a sign of a weakening, not a strengthening, market for existing homes.
Absolute inventory levels increased from 1.80M a year prior to 1.83M in April. Based on months of supply, inventory changes all pointed higher: “Unsold inventory is at a 4.2-month supply at the current sales pace, up from 3.8 months in March and up from 4.0 months in April 2018.” Recall from the last Housing Market Review that the inventory situation is very different based on price ranges. In March, the most expensive homes, $1M and up, had 10 months of supply while homes in the two lowest tiers only had 3 to 4 months of supply. The NAR did not provide this breakdown for April.
While the median price of an existing home stayed effectively flat month-over-month in January, prices continued their year-over-year ascent in February with a 3.6% year-over-year increase – above January’s 2.8% year-over-year gain (which was the slowest price growth since February, 2012). In March, price growth crept upward to a year-over-year gain of 3.8%, which included the largest nominal increase for a March in history. April delivered the 86th straight annual increase: 3.6%. Again, the evidence does not support the NAR’s on-going claims that rising inventories help affordability.
March’s 33% share of first-time buyers was a notable jump over the 30% the year prior. The share dropped to 32% for April which was 1% point below last year’s 33%. The average share for first-time homebuyers for 2016 was 35%. The NAR’s 2017 Profile of Home Buyers and Sellers reported an average of 34% for 2017 and 33% for 2018. Interestingly, the NAR made a point of commenting on the dampening impact of student debt on the demand from millennials, many of whom would be first-timers. The NAR then gave students a very odd recommendation: “Given the record high job openings in the construction sector, some may want to take a gap year to work there and save, and thereby lessen the student debt burden.” The NAR is snatching at straws trying to figure out ways to increase the buying power of the market!
Investors purchased 16% of homes in April, down from March’s 18% and up from the 14% the year prior and the same as the 16% in February. Investor sales averaged a share of 15% in 2017 and 14% in 2016. I am still awaiting the average for 2018.
February just barely ended a 4-month streak of annual sales declines across all four regions. The broad-based declines resumed in March and continued in April. In particular, the West suffered a tenth consecutive month in the red year-over-year. Here are the regional changes: Northeast -4.5%, Midwest -7.9%, South -1.7, West -5.9%.
As usual, regional sale fluctuations had little to no relationship to the on-going year-over-year price run-ups: Northeast 0.9%, Midwest 5.5%, South 4.4%, West 1.3%.
Single-family sales declined 1.1% from March and decreased on a yearly basis by 4.0%. The median price of $269,300 was up 3.7% year-over-year.
California Existing Home Sales – April, 2019
According to the California Association of Realtors (CAR), sales of existing homes in California hit a 10-year low in January. February’s month-over-month comeback of an 11.8% gain was enough to print a 6-month high and the biggest monthly gain since January, 2011. April sales dropped just slightly from March by 0.1%, but it was a 4.8% year-over-year drop.
Price growth flattened out starting in 2014 but over the past year it has declined. February’s median price was the lowest in 12 months. April’s median price jumped 6.5% from March to $ 602,920, a 3.2% year-over-year increase. CAR welcomed price softness in March: “The flattening home prices, coupled with low mortgage rates, bode well for housing affordability and may bring more buyers who may have given up back to the market.” This time, for April, the stubbornly high prices were a big negative: “Weak buyer demand, largely prompted by elevated home prices, is playing a role in the softening housing market.”
Unlike the NAR, the CAR is not celebrating inventory build-ups. In this latest report, CAR sounded relived by the declines in active listings: “Encouragingly, the growth in active listings from the year prior decelerated for the fourth straight month. The number of homes available for sale increased only 10.8 percent from last April…The growth in active listings has fallen from more than 30 percent at the end of 2018 suggesting that the market is becoming more balanced, rather than experiencing a full-scale exodus of sellers in California.” CAR seems to appreciate that rising inventories in the face of soft demand is NOT a good sign!
April hit some key milestones:
- Sales have fallen year-over-year for a year.
- April’s year-over-year sales decrease was the smallest in nine months.
- Pending home sales increased for the second straight month. Prior to that, pending home sales declined for over two years.
- The San Francisco Bay Area was the only Californian region to experience year-over-year declines in its median price. Only one county, Napa, experienced an increase. The declines in other counties were substantial: San Mateo -9.5%, Santa Clara -7.7%, Sonoma -5.8%.
New Residential Sales (Single-Family) – April, 2019
The stark contrast between existing home sales and new home sales continued in March. While existing home sales languished and trended downward, new home sales experienced a dramatic comeback. Softness in existing home sales helped motivate me to predict that November, 2017 represented a sustained peak in new home sales. Revisions to March data pushed new home sales to a new post-recession high.
The Census Bureau revised March sales of new single-family homes significantly upward from 672,000 to 723,000. New home sales for April decreased 6.9% month-over-month but increased 7.0% year-over-year to 673,000.
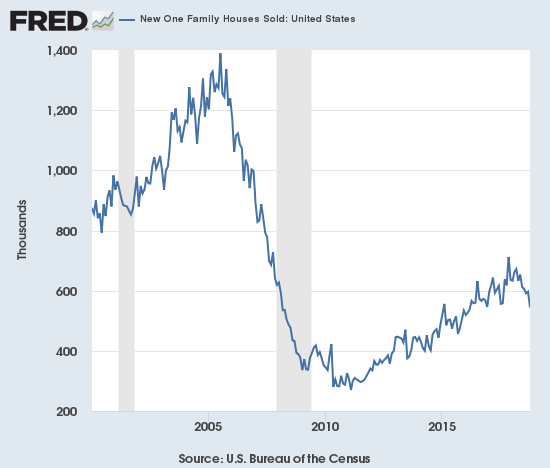
Source: US. Bureau of the Census, New One Family Houses Sold: United States [HSN1F], retrieved from FRED, Federal Reserve Bank of St. Louis, May 30, 2019.
In November, the median sales price of a new single-family home hit its lowest level of 2018 at $308,500. Prices were last that low February, 2017 ($298,000). After March’s median dropped a whopping 9.7% year-over-year (unrevised), April’s median price rebounded 8.8% year-over-year to $342,200. This price stopped just short of the previous record set in November and December, 2017. Prices surged as the share of homes sold swung abruptly in favor of homes priced from $400,000 to $749,000.
In June, 2018 the inventory of new homes for sale jumped to 6.0 months of sales, a perfect balance. Inventory trended upward from there until January’s 6.6. Inventory has drifted downward since: 6.1 in February, 6.0 in March, and 5.9 in April.
The Northeast suffered yet one more double-digit decline in new home sales with a 12.1% drop. The Midwest gained 3.6%. The South gained 5.1% but this time did not lead the regions. The West actually surged 16.8%, a new contrast to existing home sales. I still expect this momentum to end in short order.
Home Builder Confidence: The Housing Market Index – May, 2019
The Housing Market Index (HMI) has surprised me this year. After a rough end to 2018, the HMI has steadily crept higher in 2019. The 66 level for May puts the HMI just two points behind October’s 2018 high. Given this level is where HMI stalled after the 2018 Spring selling season, I do not expect any further gains. It is also hard to imagine home builders increasing their confidence yet further given the increasingly challenging conditions in financial markets. The National Association of Home Builders (NAHB) described the confidence this way: “Builders are catching up after a wet winter and many characterize sales as solid, driven by improved demand and ongoing low overall supply.” New home sales data for April definitely supported this optimism, but I doubt those sales are sustainable. As usual, the NAHB also lamented the affordability issues in the market.
The chart below shows that all the components for HMI are rose in parallel with consumer sentiment which has fully recovered from a brief dip.
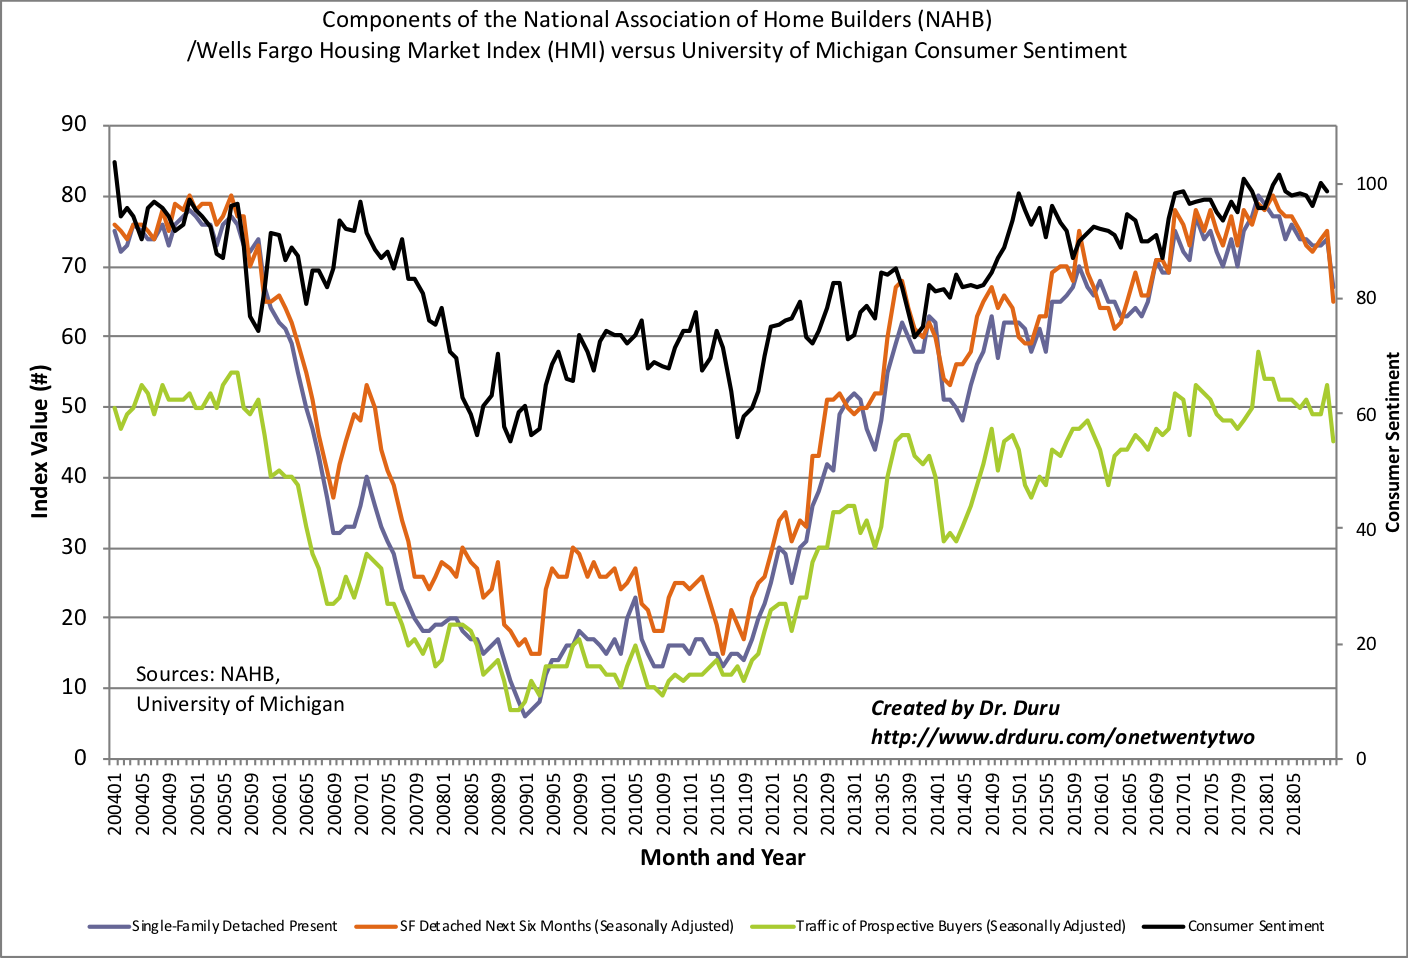
Source: NAHB
The Midwest was the only region that did increase its HMI in May. After a very mixed picture to start the year, all the regions look better. The Northeast surged 10 points to 65, a level not seen in the region since the height of the housing bubble in 2005. I had to double and triple check the data on that one; I find it hard to believe. I will be looking for a downward revision for June. The West delivered another surprise. The region’s HMI increased to 74, a level last seen in October. The West likely powered higher on the sudden pop in new home sales. Given existing home sales declined in the West, I do not expect the West to sustain its strong HMI for long. Thus my regional expectations help form the basis for expecting HMI to top out until at least the Fall when builders tart looking forward to the 2020 Spring selling season.
Parting thoughts
It is time to initiate a new pairs trade pitting a long Redfin (RDFN) versus short Zillow Group (Z) position. Unlike previous pairs trades, this one will be based purely on the price action: the large divergence between he two stocks should not last much longer. The ratio between the price of Zillow Group and Redfin is near its all-time high which was reached a year ago. From that point, RDFN drifted upward while Zillow begain a sell-off. Given the seasonal pressures on home builder stocks, I am assuming Zillow should also top out around this point. The stock also happened to end last week testing resistance from the last peak.
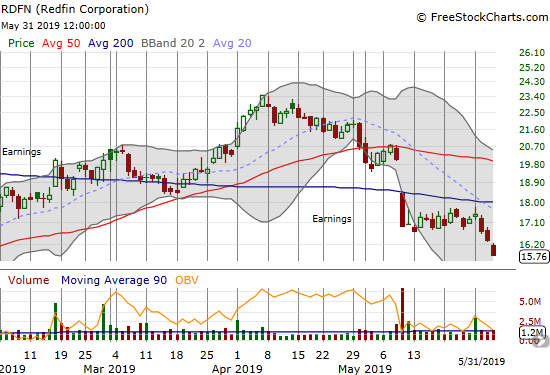
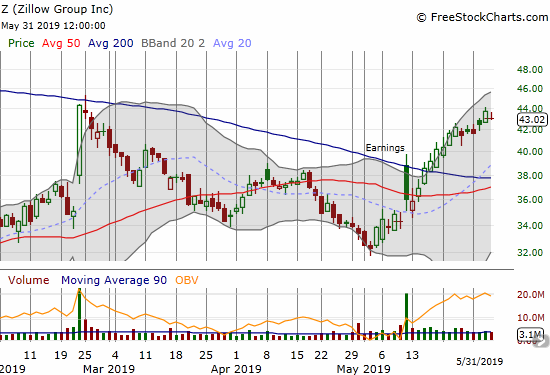
Given the current price trends, this pairs trade is 100% contrarian.
I am also more circumspect about RDFN now. I read through the Seeking Alpha transcript from RDFN’s latest earnings conference call and was left underwhelmed. The business sounds too labor intensive, including the need to build up a renovations unit. Moreover, RDFN is ramping up hiring of agents as the market hits a likely seasonal peak. Also, the channel for buying the current homes of home buyers is starting to sound a little too speculative. The main highlight from the conference call was the company’s assessment of the housing market (emphasis mine):
“Demand has been strong in the opening months of the year and getting stronger every month, even more than we would expect, as we approach the peak of the homebuying season…
As interest rates on a 30-year mortgage declined to nearly 4% at the end of March, U.S. homebuyers have begun to come back in force for the first time since last June…Agents in Boston are saying the market is starting to feel like it did last spring, but elsewhere, in Chicago, in Texas, for example, buyers are still more measured. Even in the strongest markets, buyers are putting immediate offers only on the best listings, while spurning homes with minor problems. And there’s a bidding war that usually involves 2 or 3 competing offers, not 8 or 10, limiting price jumps. And the whole market is extraordinarily sensitive to rate increases because so many of the people buying homes today are just barely able to afford them. When rates went up last fall, buyers didn’t dig a little deeper to afford a home, many stopped looking altogether…
One reason for our confidence in the overall market is that the demand increases in February and March were equivocal, with an increase in homebuyer activity often followed by a setback. But demand in each of the last 5 weeks has been consistent, and the buyers now making offers on homes are more likely to be successful because competition between homebuyers is less intense that it was in the years past.
In other words, if not for the large plunge in interest rates, the housing market would be just as bad now as it was in the closing months of 2018. This dynamic makes me suspect that today’s buyers are rushing to get ahead of a fresh increase in rates; they are pulling forward demand. With builder confidence rising with consumer confidence and this sudden spurt in buying (in select markets), the market is setup for big disappointments in coming months.
Source for all stock charts: FreeStockCharts.com
Be careful out there!
Full disclosure: no positions