

The Market Breadth Summary
- The AI-focused sell-off drove steep declines across technology stocks, but predicting its end is the wrong question for disciplined traders.
- Instead, disciplined entries, technical support, predefined stop losses, and selective rebound trades form the framework for seeking opportunities in the sell-off and crash.
- Thursday’s sell-off pushed the S&P 500 down 4.4% and the NASDAQ down 5.5%, with the NASDAQ breaking below its 200-day moving average.
- A 69.7% VIX surge and heavy semiconductor put buying reflected extreme fear, while historical post-midterm performance provided a bullish counterweight.
- Market breadth remained mixed: AT50 closed at 42.0%, AT200 finished at 43.7%, and the short-term trading call stayed neutral.
The Stock Market Summary
If you are asking where and when this AI-focused sell-off will end, you are asking the wrong question. Instead of asking for forecasts, the calm and disciplined traders and investors ask about managing risks while seeking opportunity. Thus, the main thing that changes within this framework is recognizing that the risks are higher and accordingly the opportunities are greater.
Yet, it is more difficult to cash in on those opportunities, if risk is not properly managed. For example, if the topping AI trade did not motivate a trader to raise cash, then there is little to no room to take on more risk to chase opportunities at lower prices. If a technical trader ignores the fundamentals of support, resistance, and trend, then they risk chasing the wrong opportunities. If a fundamental trader ignores valuations and earnings trends, then they risk getting stuck in quicksand while rebounds unfold without them. I have time-tested rules using market breadth to trade through extremes in the stock market. These rules keep me disciplined and focused. Unfortunately, market breadth at this juncture tells mixed messages because of the violent nature of the money rotating in and (and now mostly) out of high tech. So at this juncture, I will focus on how market breadth provides a backstop to the structured rules that respect the technical setups in the market.
As a reminder, here are the trading rules I put forth last week as a way of coping with the topping AI trade ahead of any catalysts from the midterm elections in the U.S.
- Avoid new positions in stocks ahead of their earnings report.
- Focus buys of individual stocks on breakouts, especially moves that end downtrends.
- Maintain a bias against getting cute with support for highly volatile stocks, especially those in the topping AI trade.
- Getting cute with support is ok for ETFs and indices given the reduced risk profile.
- Predefine stop loss points and remain disciplined on cutting losses short.
- Treat AI stocks like trades, not investments, until breakouts lead to the end of downtrends and topping patterns.
Every one of these rules still applies. The few times I broke these rules, I lost. Most of the gains came from seizing the opportunity in the wake of the surge in emotions following the election. The immediate rally on Wednesday struck me as odd, and nothing happened that triggered any of the rules for chasing opportunity. However, Thursday’s plunge was so extreme that screaming buys for both short-term and longer term trades opened up. The extremes were so big that even famous short-seller Michael Burry sat up and issued a call to buyers. The historic surge in the volatility index (VIX) was all he needed.
The historic extremes were everywhere. The put/call ratio swung to an extreme high (traders favoring put options volume over call options).
On CNBC’s Fast Money, a representative from the CBOE, one of the major options exchanges, quoted some startling numbers. For example, during Thursday’s plunge, the ETF of semiconductors, SMH, experienced a roughly 2.9 put/call ratio with 670K of the near 900K options trading going to puts. The notional value of these options was even more extreme: puts accounted for approximately $1.5B of $1.7B in total SMH options notional value, producing an eye-popping 7.5 put/call ratio by notional value.
The collapse in semiconductor stocks rivals prior crashes. Since 1994, only five comparable periods recorded a worse semiconductor sell-off than the one surrounding these midterms. This list begs the question, should we talk about this moment as the AI Crisis? The Tech Bust? The Semis Crash? All of the above?
All these expressions of extremes highlight the very real risks in the market. However, this sell-off is happening at the start of a historically strong period. So the potential opportunity is in getting a much lower price than usual to play the midterm upside strategy.
Yahoo Finance analyzed historic price dynamics around previous midterms. The market’s loss going into this year’s midterm election is an outlier that could be related to the rate hiking cycle by the Federal Reserve. And of course the loss coming out of the midterms is unique to a highly contentious, technology buildout. Here are key points from “Stocks shrugged off the blue wave overnight — history says don’t trust the bounce yet” (with some editorial from me).
- The eight sessions around a midterm vote, five before and three after, have been one of the S&P 500’s strongest stretches of the year, with gains in 18 of 19 midterms since 1950. The only previous loser was a 1.3% drop in 1994. (This time around, the S&P 500 cratered 4.5%, creating yet one more historic extreme).
- From the end of October in a midterm year to the following June, the S&P 500 has risen in all 19 cycles since 1950, with a median gain of about 15%. (A 15% gain for this cycle would require an 18% gain from Friday’s close).
- In 2018, stocks rallied about 2% the day after that midterm, then fell about 6% over the next month on the way to a Christmas Eve low.
- The Russell 2000 beat the S&P 500 the day after the vote in only 5 of the past 11 midterms. The season that has favored small caps doesn’t start until mid-December. (This time around, the S&P 500 barely edged out IWM 1.58% versus 1.51%)
Taken together, these market statistics weave a mosaic of risk and opportunity (and I have not even layered in market breadth yet!). Anyone giving forecasts during such moments of high uncertainty and volatility is just providing their best guess, sometimes worse. Those people falling back on trite platitudes are barely more helpful. So, instead of asking for forecasts for a bottom, instead ask whether you are buying at defensible support, are prepared to exit on a violation of support, and whether your choice of time frame and equity aligns well with the potential opportunities ahead.
Note my rules have nothing to do with the news flow. I am making a strong claim that during highly emotional and charged market environments (extremes) that the fundamentals matter even less than usual compared to the technicals. Still, I do like to stay keenly aware of the news flow, so I am aware of the narratives floating in the headlines to explain the market price action. Last week was a particularly comical example of how the headlines can flip a narrative with ease depending on the price action at hand. When the S&P 500 gained 1.6% after futures recovered initial overnight losses, the headlines claimed investors looked forward to divided and deadlocked government. The on-going selling in the AI trade did not capture the essence of the market’s dynamics. When the S&P 500 plunged 4.4%, the narrative abruptly shifted to the negatives like the ability of state and local governments to hinder the AI infrastructure build-out and widespread economic fallout (a large portion of recent GDP growth is related to the AI infrastructure buildout).
Perhaps lost in the election-related chaos was Friday’s release of the October jobs report. Payrolls increased a very healthy 165,000 and unemployment dropped from 4.2% to 4.1%. Most surprising was the surge in Professional and business service employment, a sector that supposedly is being ravaged and undercut by AI replacement. The 70K jobs in these payrolls was 42% of the net gain in jobs! Since the market was up on the day, the current narrative is that healthy jobs equals a healthy economy. If the market resumes selling off next week, I expect to hear narratives about how a strong jobs report will force the Fed to keep hiking rates much to the market’s chagrin.
S&P 500 (SPY)
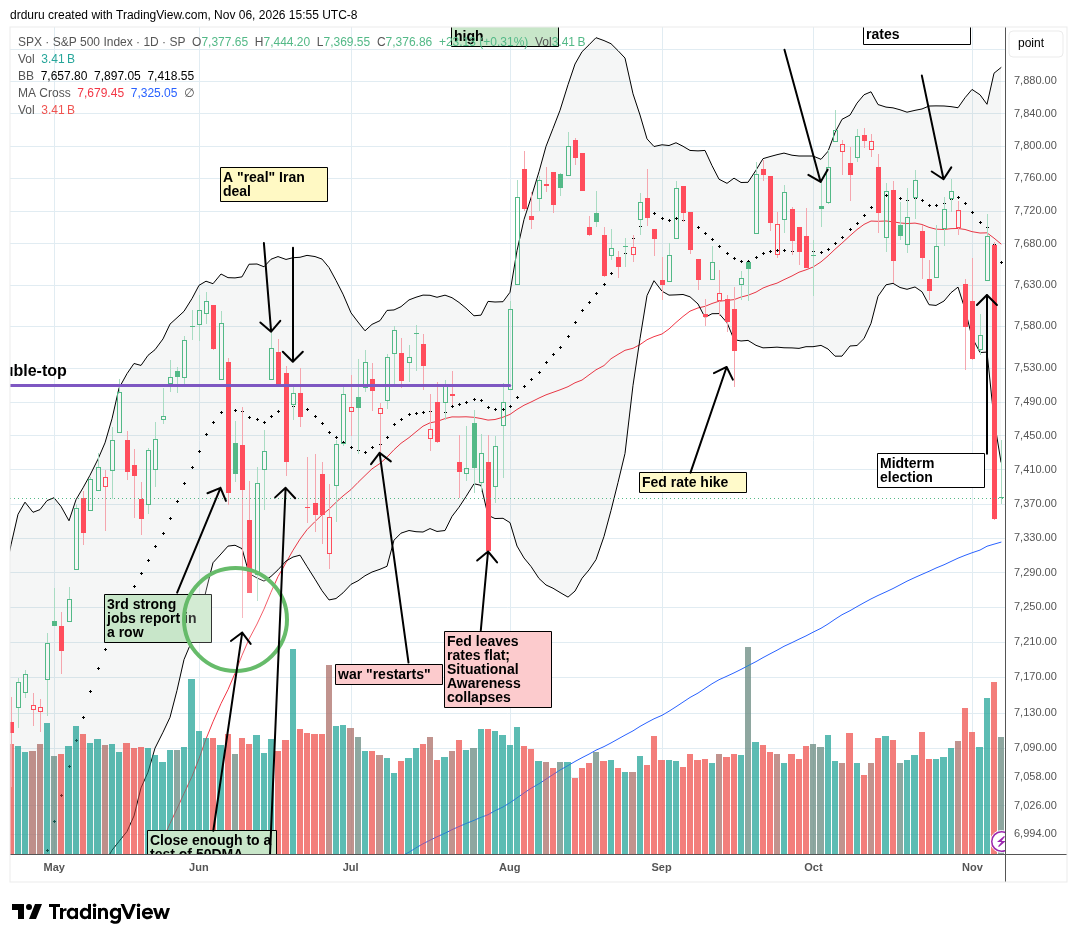
The S&P 500 (SPY) confirmed resistance at its 50-day moving average (DMA) (red line) with Thursday’s 4.4% plunge. Given the ferocity of the selling, I am surprised that the index stopped short of testing 200DMA support (blue line). Friday’s fractional rebound is tenuous, especially given the gradual fade from the intraday high set soon after Friday’s open. I have no interest in any trades on the index until it resolves this critical juncture. A 200DMA breakdown would plunge the index into a bear market (which I define as a confirmed close below the 200DMA). A close above Friday’s intraday high of 7445 would create a stronger prospect for a continued rebound.
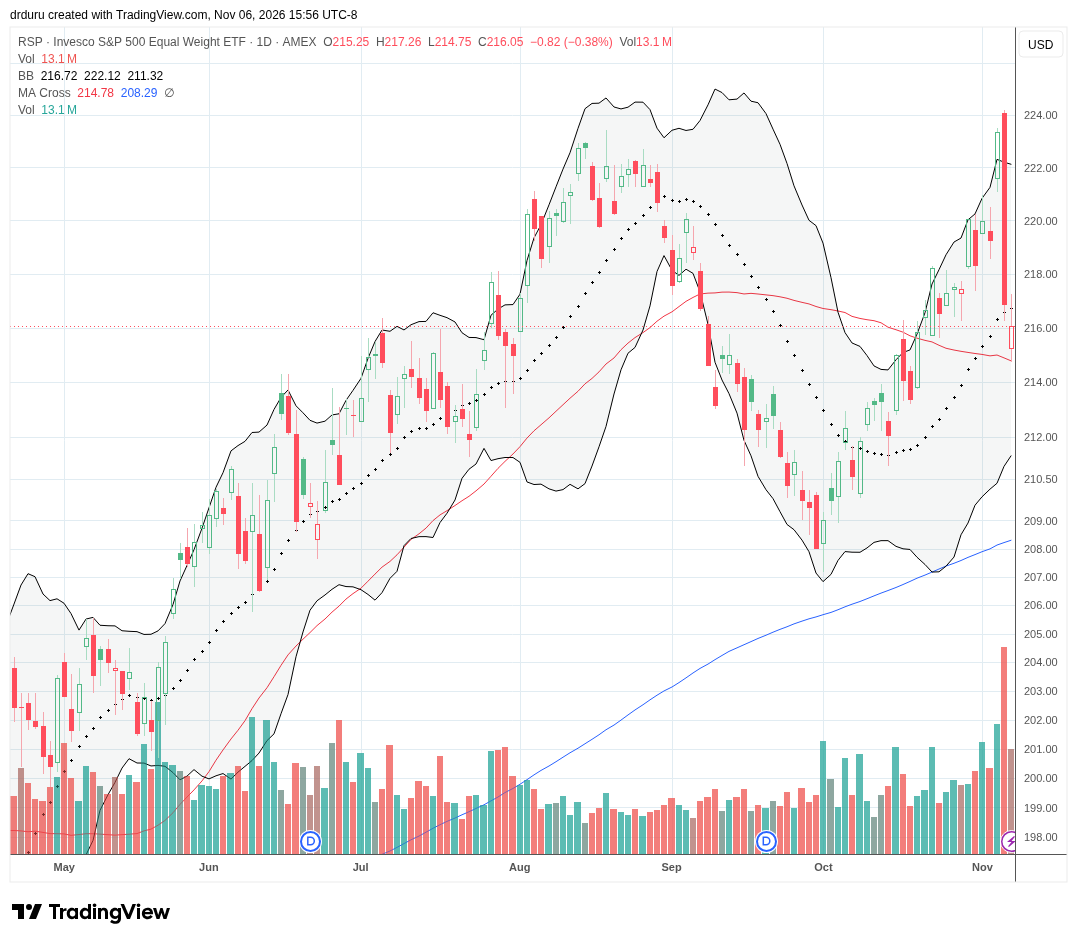
Even the Invesco S&P 500 Equal Weight ETF (RSP) looks terrible. Thursday’s sharp 2.9% pullback created a bearish engulfing topping pattern. The impressive runup since the start of October has come to a calamitous end, and with this end market breadth lost an important tailwind. At least 50DMA support held on Friday’s continued selling…for now.
NASDAQ (COMPQ)
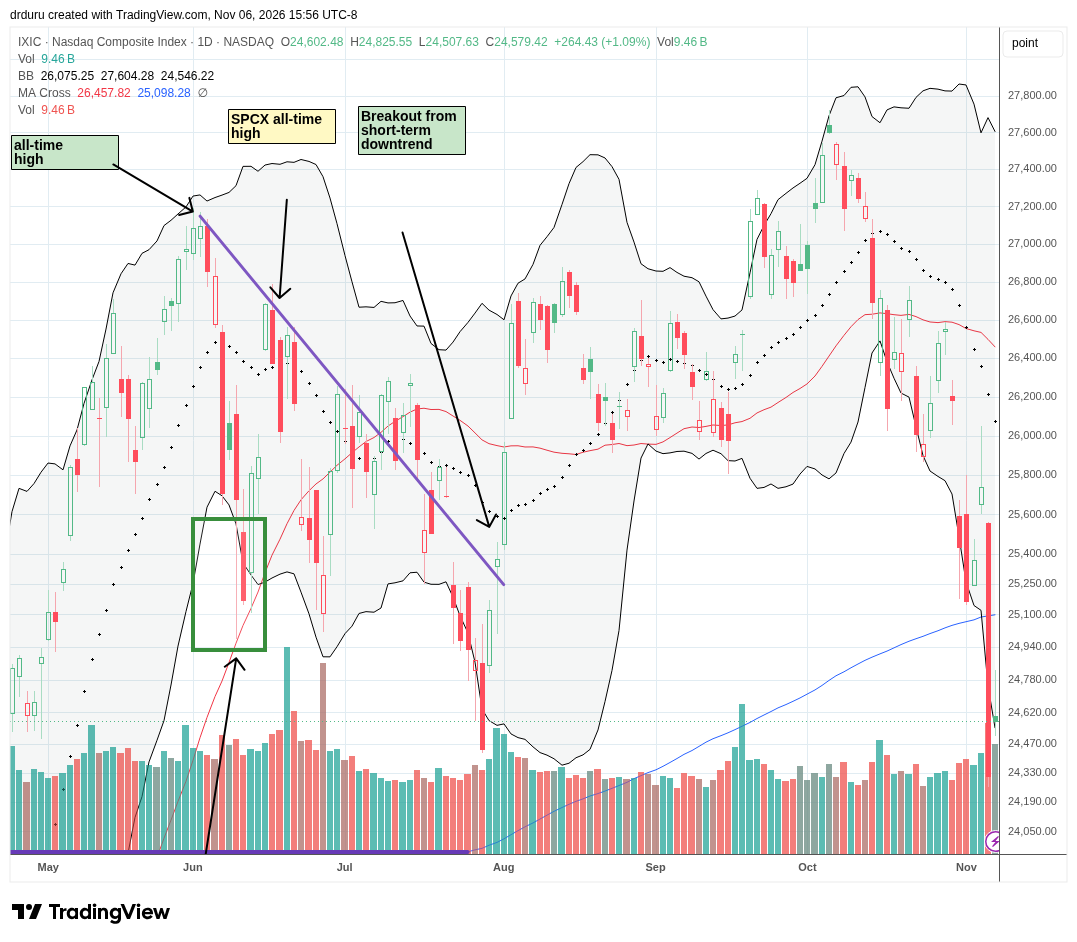
The NASDAQ has been trading bearishly since its 50DMA breakdown in mid-October. Thursday’s historic 5.5% collapse through 200DMA support created an epic fakeout from the gains in the first day of post-election trading. The tech-laden index is in bear market territory although Friday’s tepid 1.1% gain saved the NASDAQ from continuing beyond its 7-month low. Still, the NASDAQ is down 9.4% from its all-time high and up 5.8% for the year. If the year ended today, this year’s performance would actually be the NASDAQ’s smallest annual gain since 2015. Ever since 2017, the NASDAQ has gained at least 20% in years with gains, an incredible run!
iShares Russell 2000 ETF (IWM)
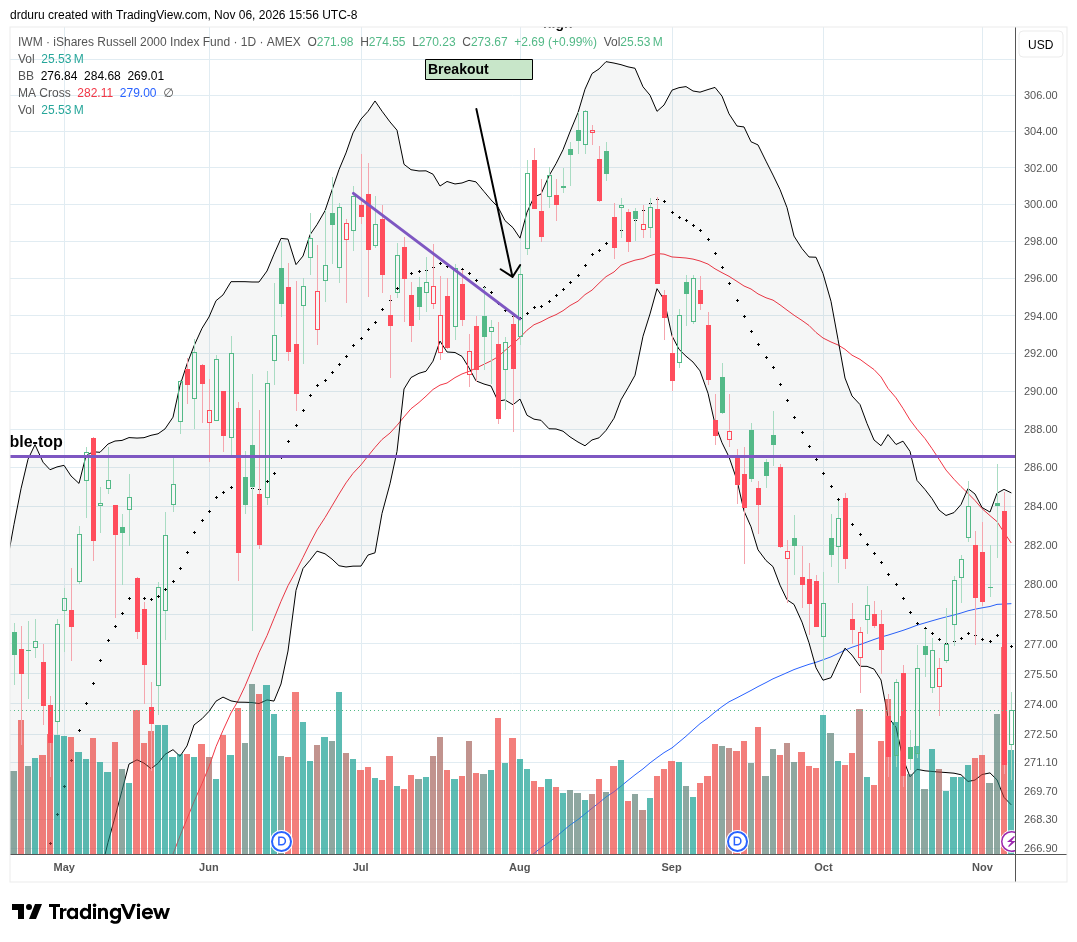
The iShares Russell 2000 ETF (IWM) remains in the bearish position that started with late August’s 50DMA breakdown and continued with a downtrending 50DMA and 20DMA. Last week, 50DMA resistance held and repelled the ETF of small caps right through 200DMA support. IWM finally sustained a rebound which started in mid-October. The move also contributed to the strong streak upward for market breadth. Although IWM is in a bear market I speculated on the October lows holding as support.
The Short-Term Trading Call with the Wrong Question
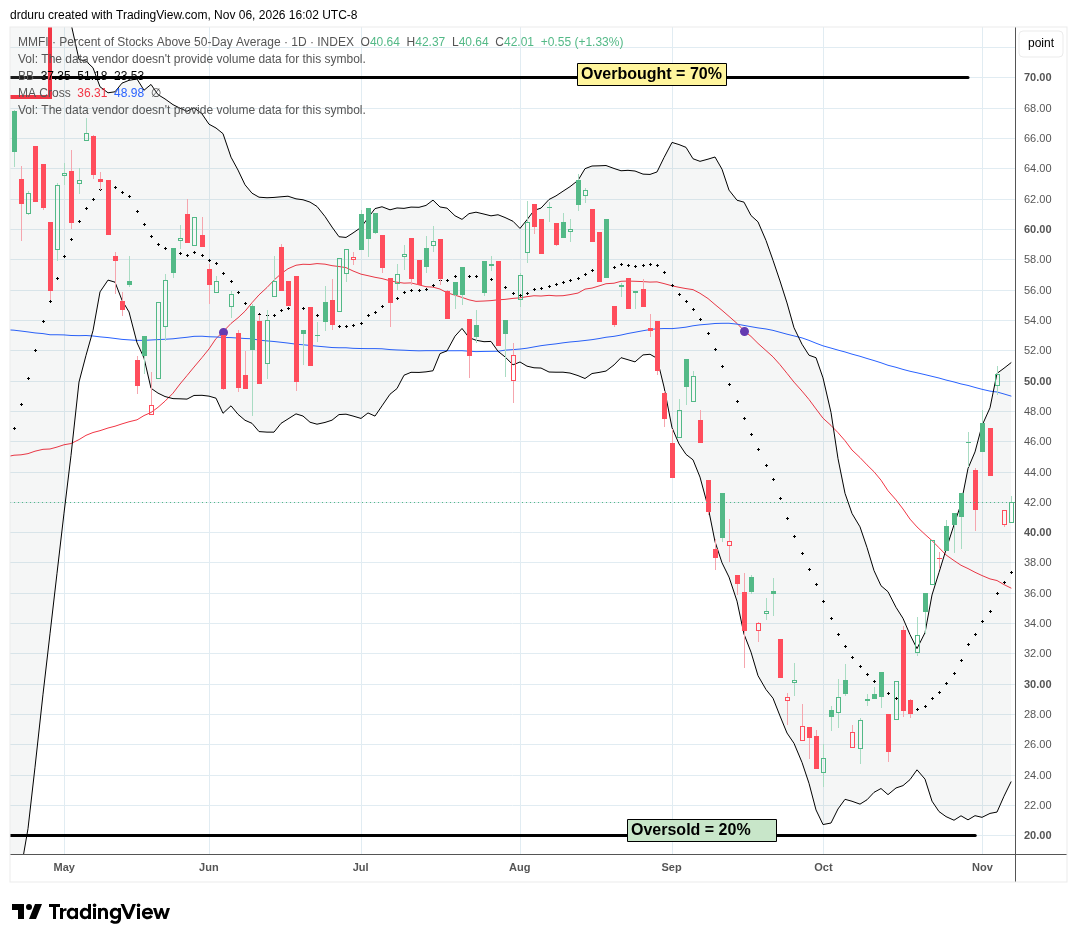
- AT50 (MMFI) = 42.0% of stocks are trading above their respective 50-day moving averages
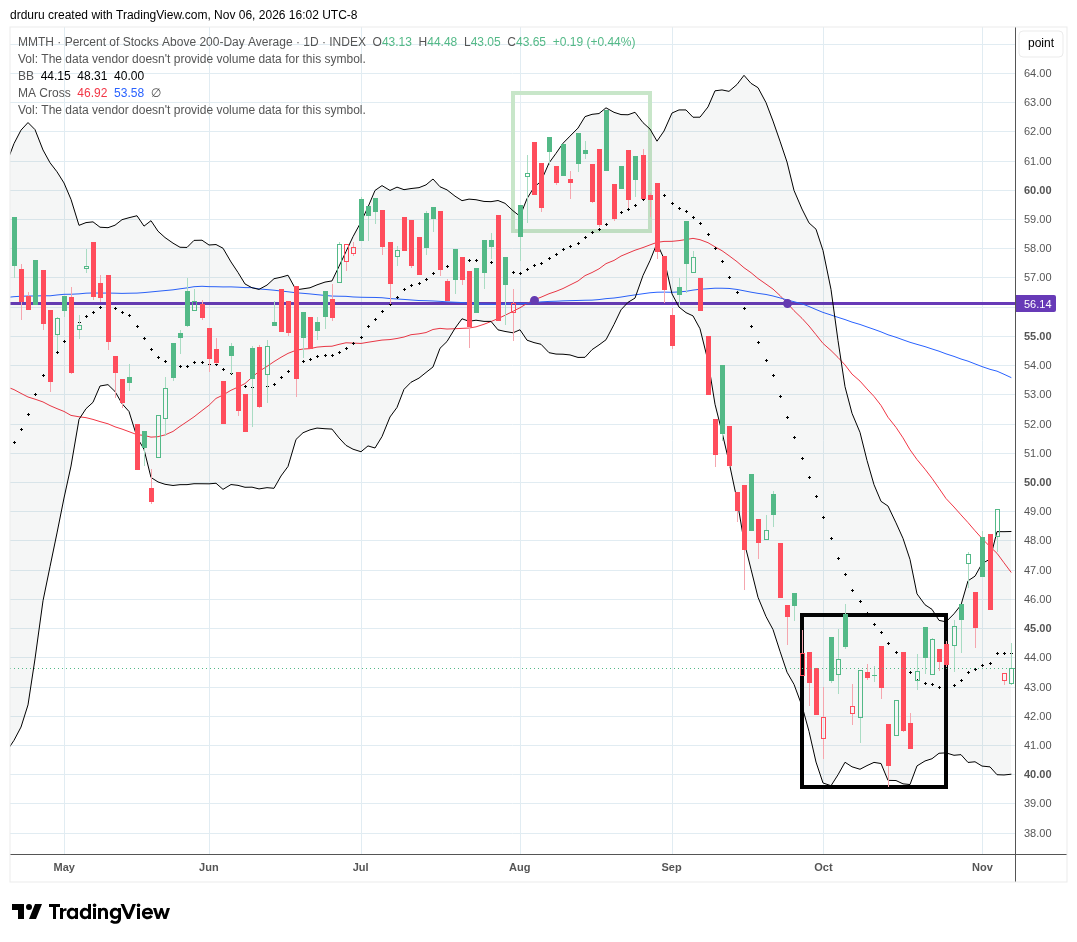
- AT200 (MMTH) = 43.7% of stocks are trading above their respective 200-day moving averages
- Short-term Trading Call: neutral
AT50 (MMFI), the percentage of stocks trading above their respective 50DMAs, closed the week at 42.0%. My favorite technical indicator incredibly closed the week essentially flat. This resilience is encouraging, but the move freezes my short-term trading call in limbo. The bullish momentum from expanding market breadth came to an end, and AT50 is nowhere near the oversold threshold.
AT200, the percentage of stocks trading above their respective 200DMAs, reversed the breakout that previously confirmed the bullish signal from AT50. This damage looks serious enough to make me very wary in the coming week and more inclined to fade an immediate rebound.
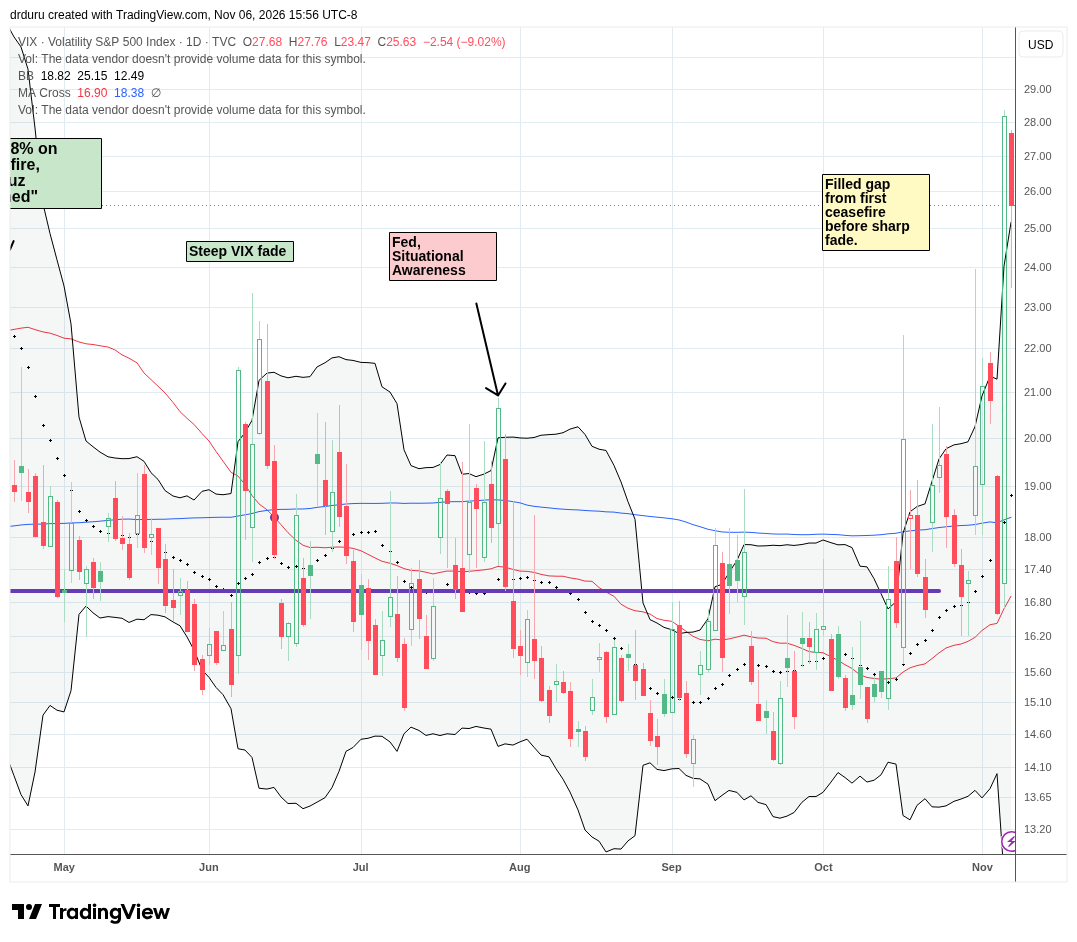
The volatility index (VIX) finally unleashed the fury growing ever since October 16th’s surge. From that point, the VIX spent very little time below 17 where the VIX sat before last year’s tariff turmoil erupted.
With the AI trade in major retreat, flashbacks to the dotcom bust become topical. I have argued for months that the AI trade is topping, but I am still not prepared to compare the unfolding damage to the way the dotcom bubble blew up. Still, the comparison remains uncanny. According to the chart below, the NASDAQ, and presumably the AI trade, has one more new high before things completely fall apart. Again, I think the top for the AI trade will hold for many months to come.
In Case You Missed It….
I posted an update on my thinking about support and resistance for Intel Corporation (INTC) in the wake of its post-earnings collapse. INTC is one of the many stocks associated with the AI trade that has already printed a major (and epic) top.
The Equities
Semiconductors and Memory
NVIDIA Corporation (NVDA)
Description: NVIDIA Corporation designs graphics processing units and accelerated computing platforms used in artificial intelligence, data centers, gaming and other computing markets.
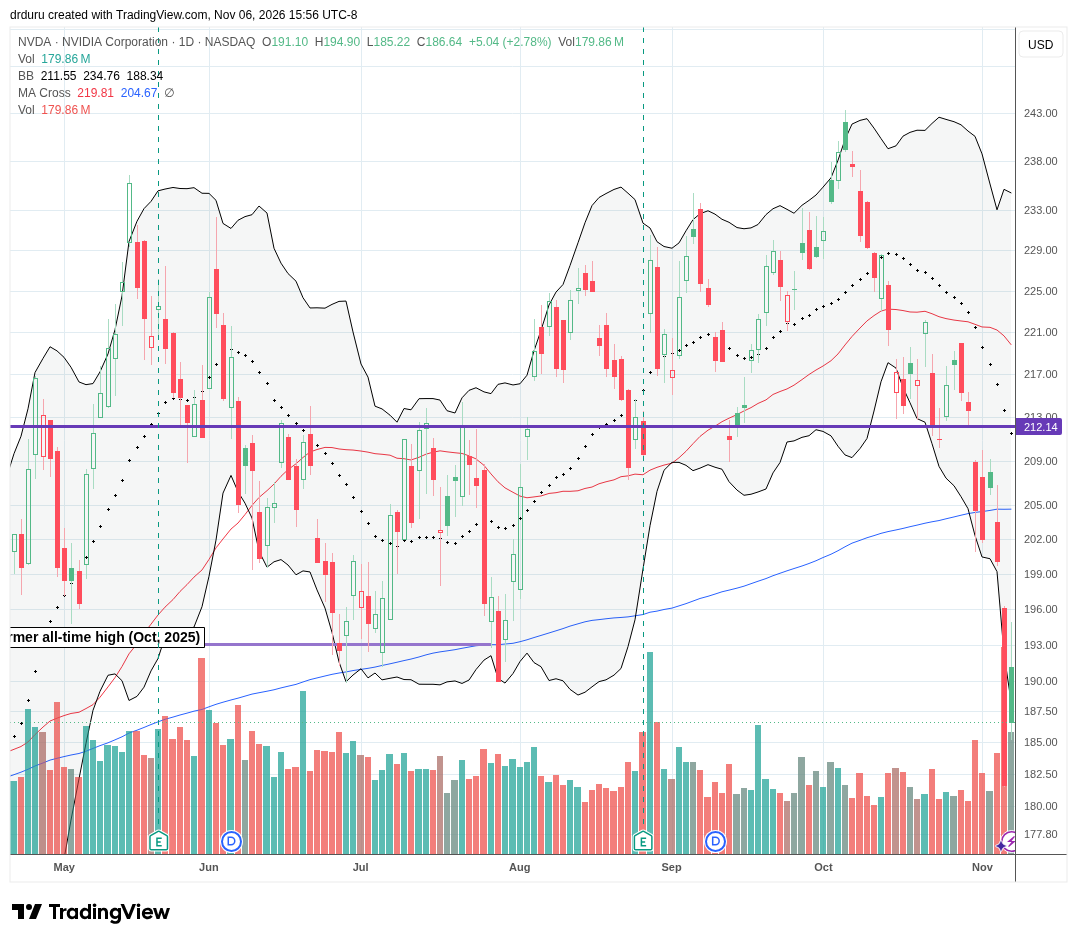
Technical Status: NVIDIA Corporation (NVDA) plunged 9.3% on Thursday. Friday’s 2.8% rebound was far from enough to erase NVDA’s bearish status well below its 200DMA.
Trade Commentary: On November 2, NVIDIA published details of physical and agentic AI applications being deployed or developed by cities and technology partners worldwide. The applications included municipal service agents, transportation monitoring, digital twins for infrastructure planning and shared AI computing infrastructure. That news hardly mattered as the stock took a large brunt of the AI-focused sell-off. With the stock trading well below its lower Bollinger Band and the VIX recording an epic percentage gain, I sold a weekly $180 put spread. I meant to take profits on Friday but missed my target. Now I am bracing to see how much the panic expands as the company’s board investigates the details of CEO Jensen Huang’s affair with an alleged Chinese spy.
Advanced Micro Devices, Inc. (AMD)
Description: Advanced Micro Devices, Inc. develops processors, graphics chips and accelerated computing products for data centers, personal computers and embedded systems.
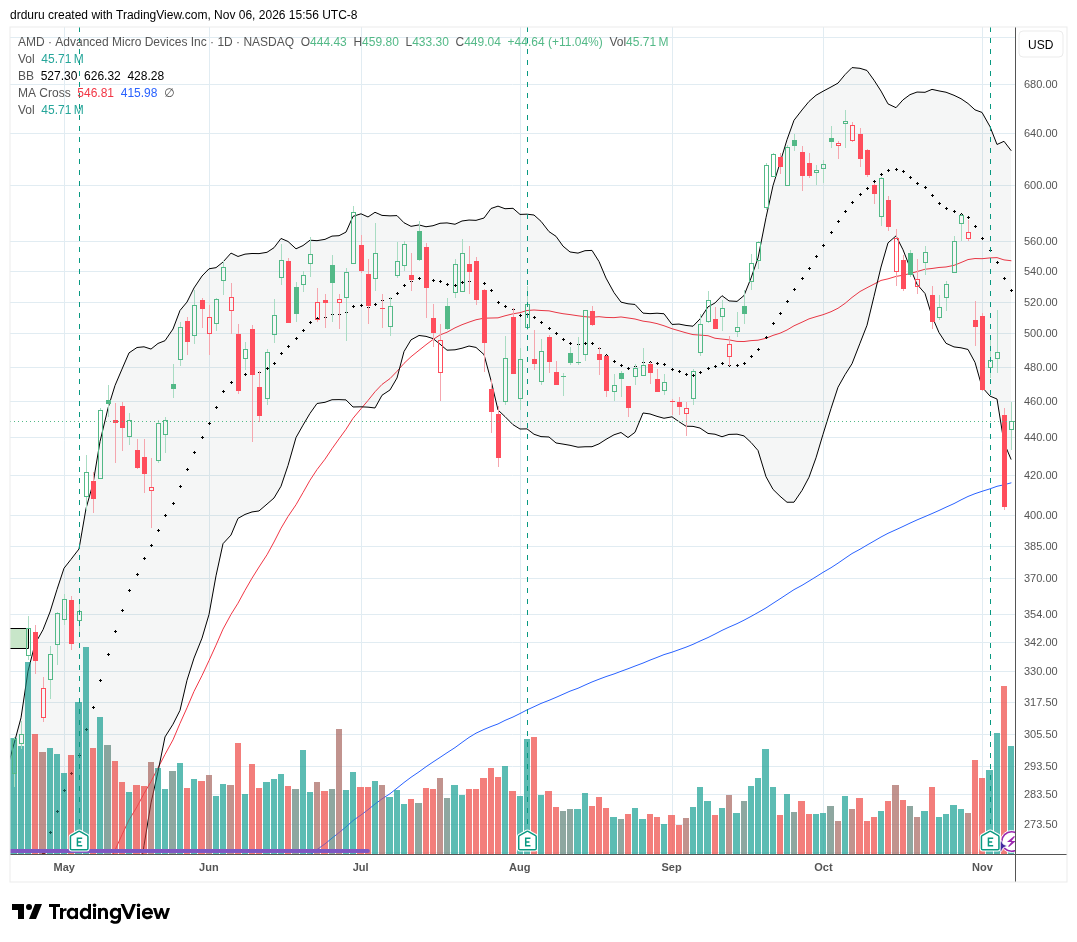
Technical Status: Advanced Micro Devices, Inc. (AMD) lost its tepid post-earnings gains to the AI sell-off. Buyers belatedly defended 200DMA support with a gap higher on Friday’s 11.0% surge.
Trade Commentary: AMD reported third-quarter earnings on November 3, including revenue of $13.4 billion, an increase of 45% year over year. Data Center segment revenue increased 97% from the prior-year period to approximately $8.5 billion. The company reported GAAP operating income of $2.8 billion and diluted earnings per share of $1.46. CEO Lisa Su declared that her company’s data center business will double next year. The midterm election results added a major question mark at the end of that confidence and set up a major new source of volatility for AMD. AMD stands to benefit from any post-scandal troubles at NVDA. The stock is on my buy and accumulate list given its recovery from the 200DMA breakdown. My initial profit target is at the downtrending 20DMA.
Marvell Technology, Inc. (MRVL)
Description: Marvell Technology, Inc. designs semiconductor solutions for data infrastructure, including custom computing, networking and high-speed connectivity products.
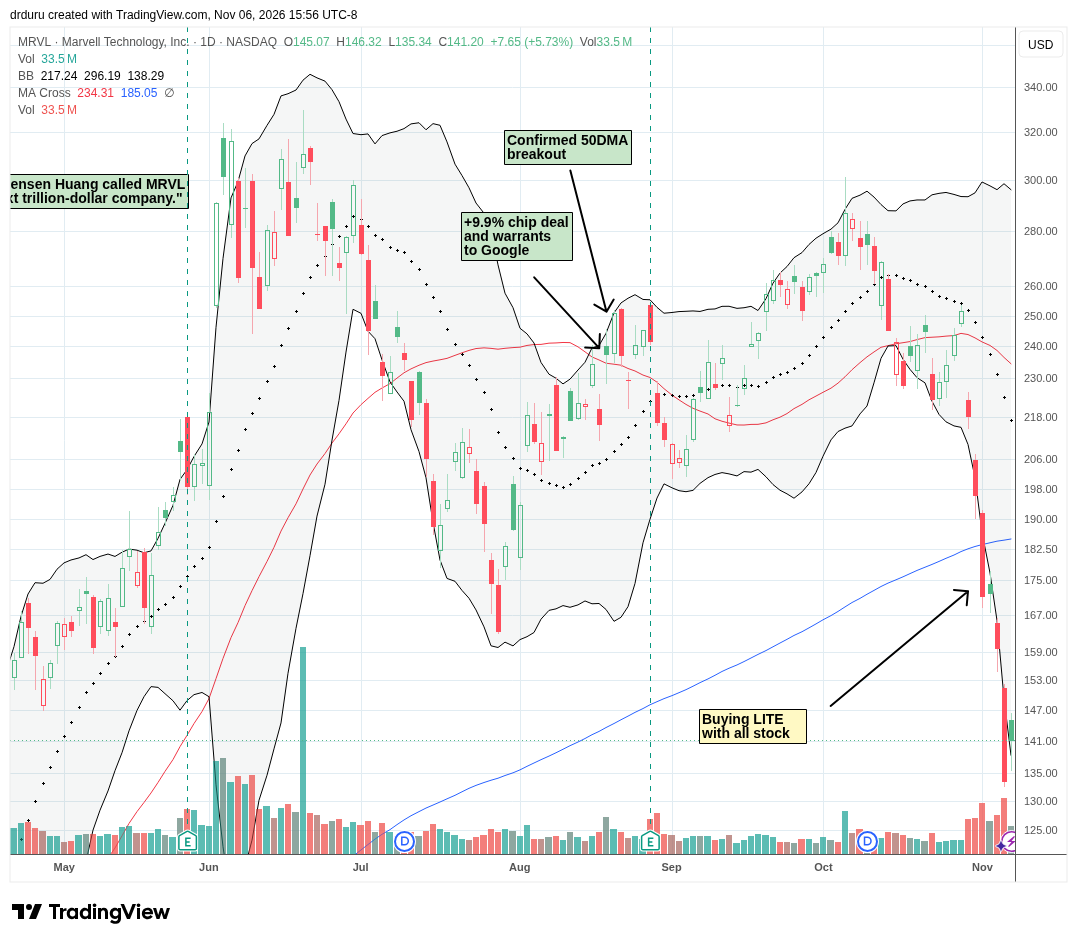
Technical Status: Marvell Technology, Inc. (MRVL) plunged deeper into its bear market with Thursday’s 16.4% loss and 7-month low.
Trade Commentary: On November 2, Marvell and Lumentum (LITE) announced a definitive agreement under which Marvell would acquire Lumentum in an all-stock transaction. The proposed exchange ratio is 4.5 Marvell shares for each Lumentum share. The proposed transaction would combine Marvell’s semiconductor and connectivity portfolio with Lumentum’s optical components and photonics technology. The timing was awful coming in the middle of accelerating weakness in the AI trade. MRVL promptly lost 12.7% and lost 200DMA support. The steep losses continued into Thursday’s 16.4% crash. MRVL is now down 55.4% from its all-time closing high recorded two days after Jensen called MRVL the next trillion dollar company. If the market starts questioning Jensen’s judgment, MRVL could have a lot lower to go. The stock is STILL up 60% for the year!
Vishay Intertechnology, Inc. (VSH)
Description: Vishay Intertechnology, Inc. manufactures discrete semiconductors and passive electronic components for industrial, automotive, computing and other applications.
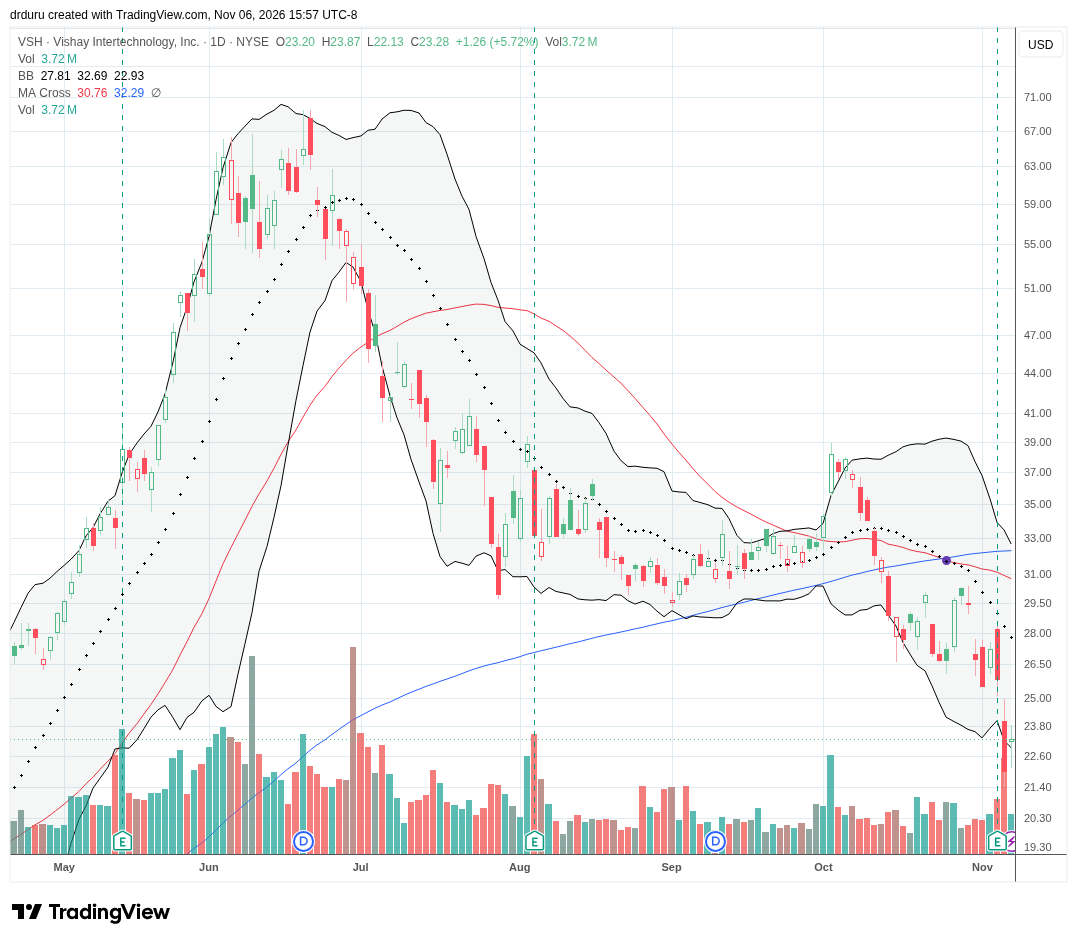
Technical Status: Vishay Intertechnology, Inc. (VSH) plunged deeper into its bear market with Thursday’s post-earnings 14.8% loss and 7-month low.
Trade Commentary: Vishay reported third-quarter results on November 4, with revenue of $978.9 million and a gross margin of 25.5%. Diluted earnings per share were $0.37, while the company reported a book-to-bill ratio of 1.29. Vishay also reported a quarter-end backlog equivalent to 6.6 months of shipments. The timing coincided with Thursday’s selloff and the stock lost 14.8% post-earnings. While I suspect the selling was overdone, the overhead resistance looks so ominous that I rate the stock a no touch until it recovers above its 200DMA.
VanEck Semiconductor ETF (SMH)
Description: The VanEck Semiconductor ETF is an exchange-traded fund that tracks an index of publicly traded semiconductor companies.
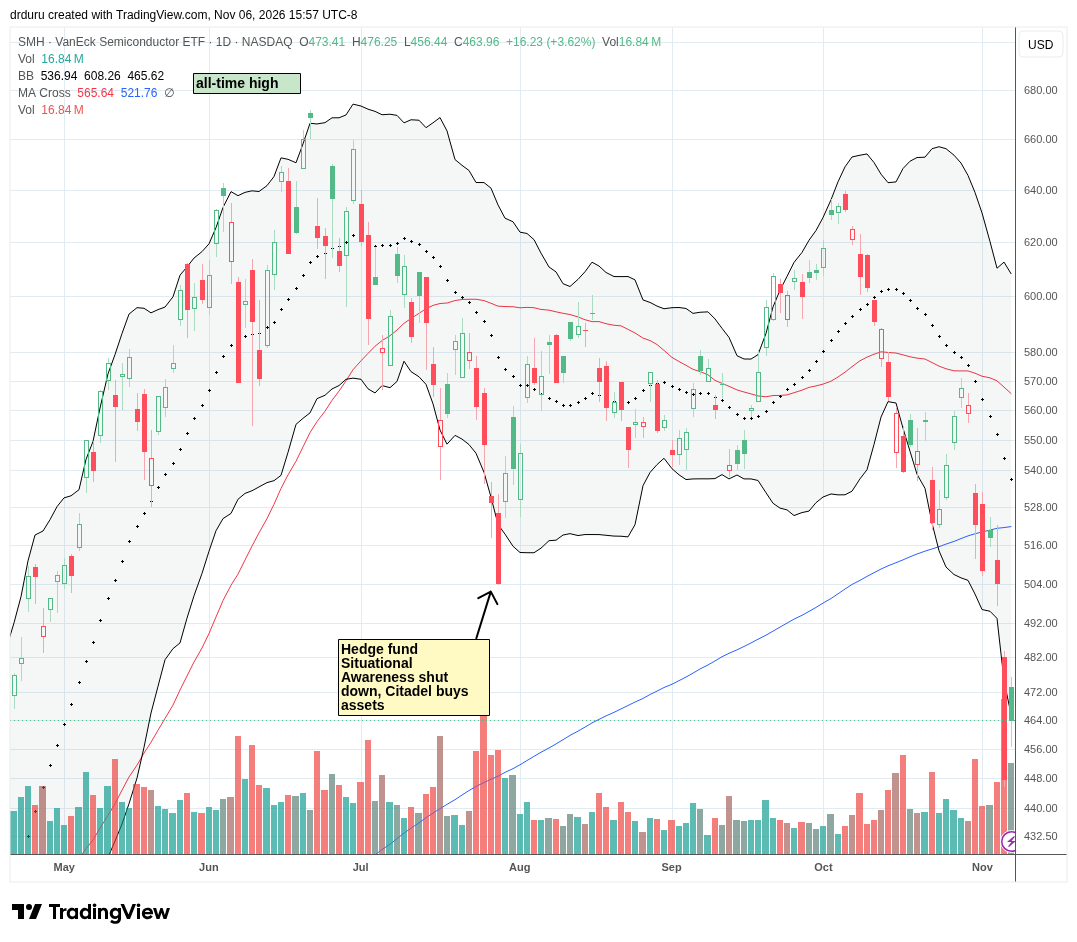
Technical Status: The VanEck Semiconductor ETF (SMH) crashed 11.2% on Thursday and closed at a 7-month low.
Trade Commentary: The double-top in SMH stretching between June and October looks even more ominous after last week’s collapse. I like SMH for a short-term trade back to the Situational Awareness low and a stop loss below Thursday’s low.
Roundhill Memory ETF (DRAM)
Description: The Roundhill Memory ETF is an exchange-traded fund providing exposure to companies involved in computer memory and storage technologies, including DRAM, NAND and high-bandwidth memory.
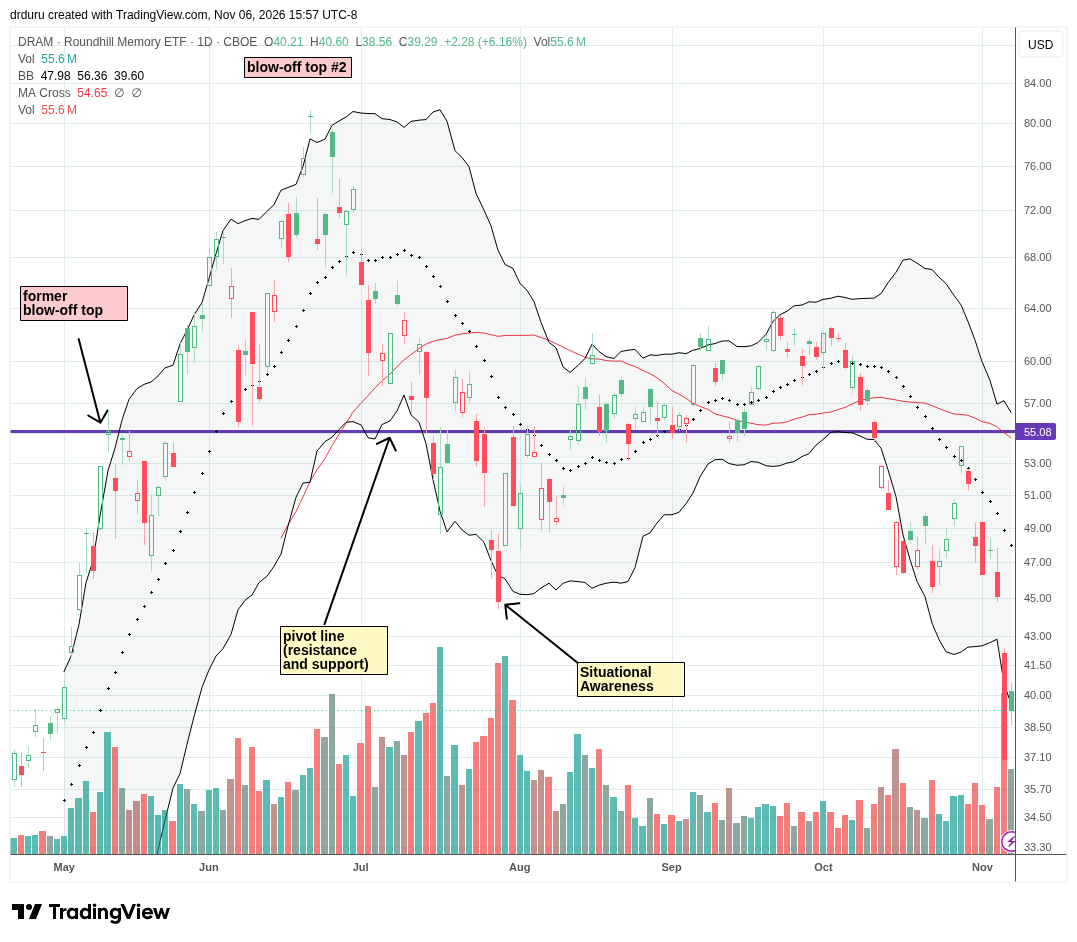
Technical Status: The Roundhill Memory ETF (DRAM) crashed 18.0% on Thursday and closed at a 7-month low.
Trade Commentary: Like SMH, I am willing to try a trade in DRAM back to the Situational Awareness low from July. A rebound back to that former support would also bring me close to even on shares I bought trying to get “cute at support” from the October lows and the Situational Awareness low.
Networking and Optical Communications
Arista Networks, Inc. (ANET)
Description: Arista Networks, Inc. develops networking hardware and software for cloud data centers, AI infrastructure, enterprise networks and routing environments.
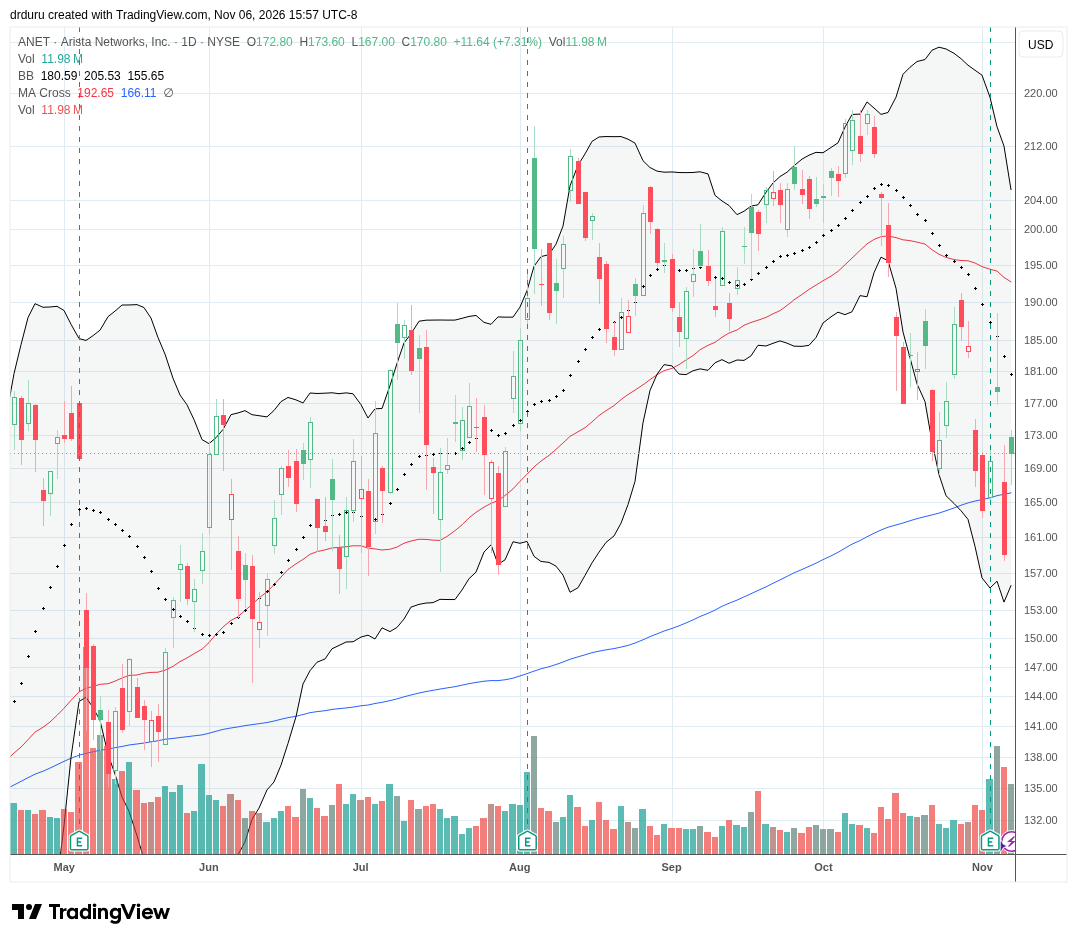
Technical Status: Arista Networks, Inc. (ANET) gained 5.0% post-earnings but plunged the next day below its 200DMA thanks to the AI selloff. Buyers came to the rescue on Friday’s rebound.
Trade Commentary: Arista reported third-quarter financial results on November 3 with revenue of $3.66 billion, an increase of 58.5% year over year. GAAP diluted earnings per share were $1.22. The company also described open standards-based rack-scale architectures for AI networks developed in collaboration with AMD, Arm, Broadcom, d-Matrix, Meta, Microsoft and Qualcomm. I am clinging to my position while recognizing I should have stopped out once the uptrend ended with mid-October’s 50DMA breakdown. I will take my lumps if ANET closes below last week’s low.
Applied Optoelectronics, Inc. (AAOI)
Description: Applied Optoelectronics, Inc. manufactures optical networking products and components used in data centers, telecommunications and broadband networks.
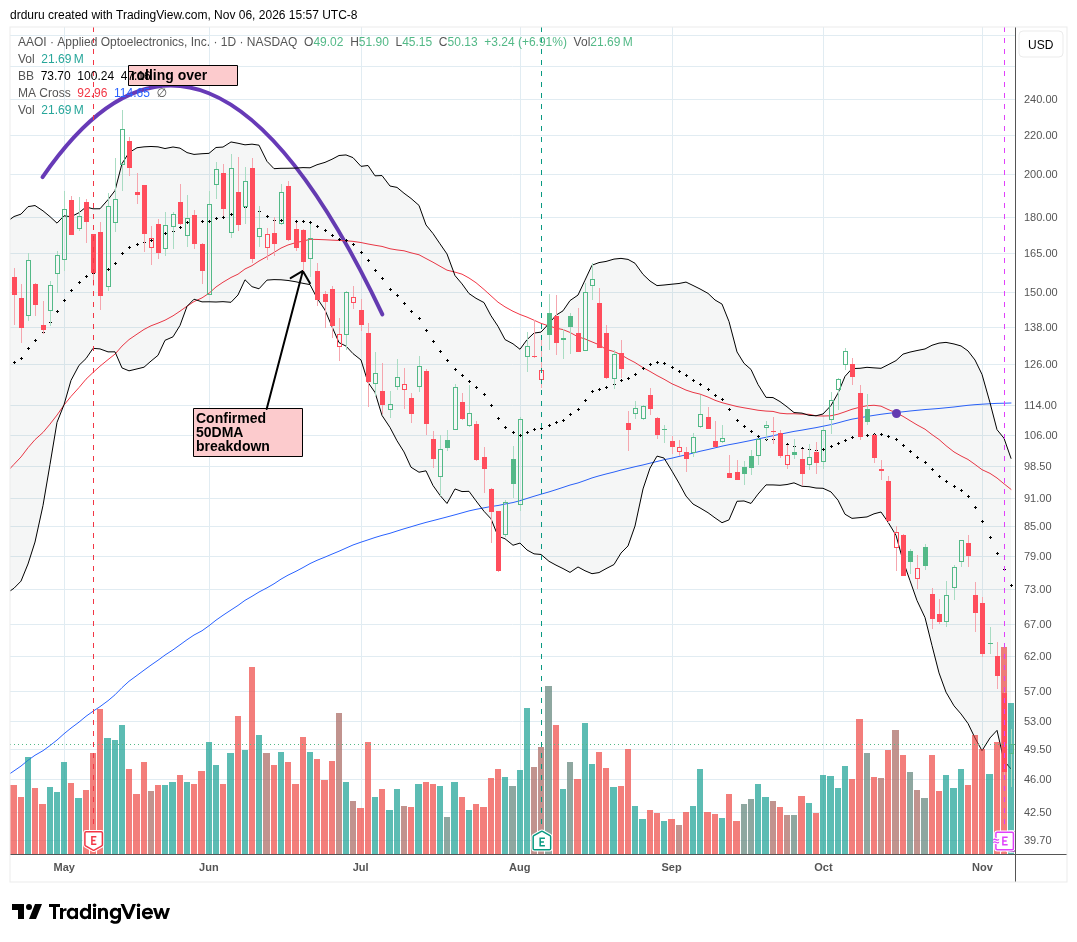
Technical Status: Applied Optoelectronics, Inc. (AAOI) crashed 20.9% on Thursday to a 9-month low, further confirming May’s topping action. AAOI is still up 43.4% year-to-date despite trading 77.7% below its all-time high.
Trade Commentary: Applied Optoelectronics reported third-quarter financial results on November 5, with revenue of $269.9 million compared with $118.6 million in the prior-year period, more than doubling. The company reported GAAP net income of approximately $6.3 million compared with a net loss in the comparable 2025 quarter. Management also disclosed that the company had recently secured a multiyear strategic agreement with a Tier 1 hyperscale data center customer. The release discussed production expansion for 800G and 1.6T optical products.
AAOI is one of the poster children for the topping AI trade. Thursday’s plunge took the stock to a 9-month low. On Friday sellers took it even lower before buyers delivered a 2.0% gain. I like trading a rebound in AAOI after it moves above Thursday’s intraday high.
Corning Incorporated (GLW)
Description: Corning Incorporated manufactures specialty glass, ceramics and optical communications products for telecommunications, electronics and industrial markets.
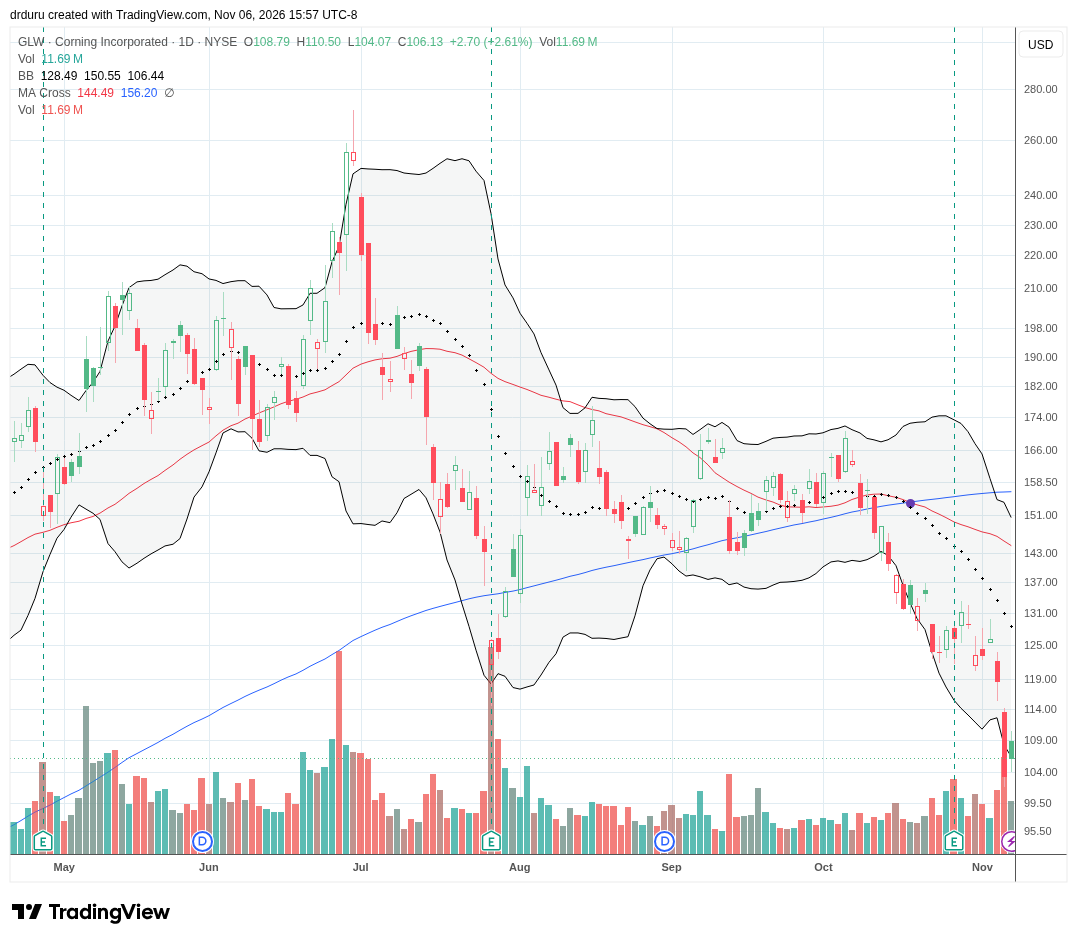
Technical Status: Corning Incorporated (GLW) deepened its bear market with a 12.9% plunge on Thursday and a 9-month low.
Trade Commentary: GLW’s sell-off seems overdone given the stock enjoyed a 3.9% post-earnings gain the week prior. GLW is 58.6% below its all-time high and still up 21.2% year-to-date. While GLW generated a blow-off top at its all-time highs, I am willing to bet that the stock has plenty of sharp rallies ahead of it. I like accumulating the stock down to a complete reversal of 2026’s gains.
Cloud Infrastructure and Hyperscale Computing
CoreWeave, Inc. (CRWV)
Description: CoreWeave, Inc. provides cloud infrastructure and GPU-accelerated computing capacity for artificial intelligence and other compute-intensive workloads.
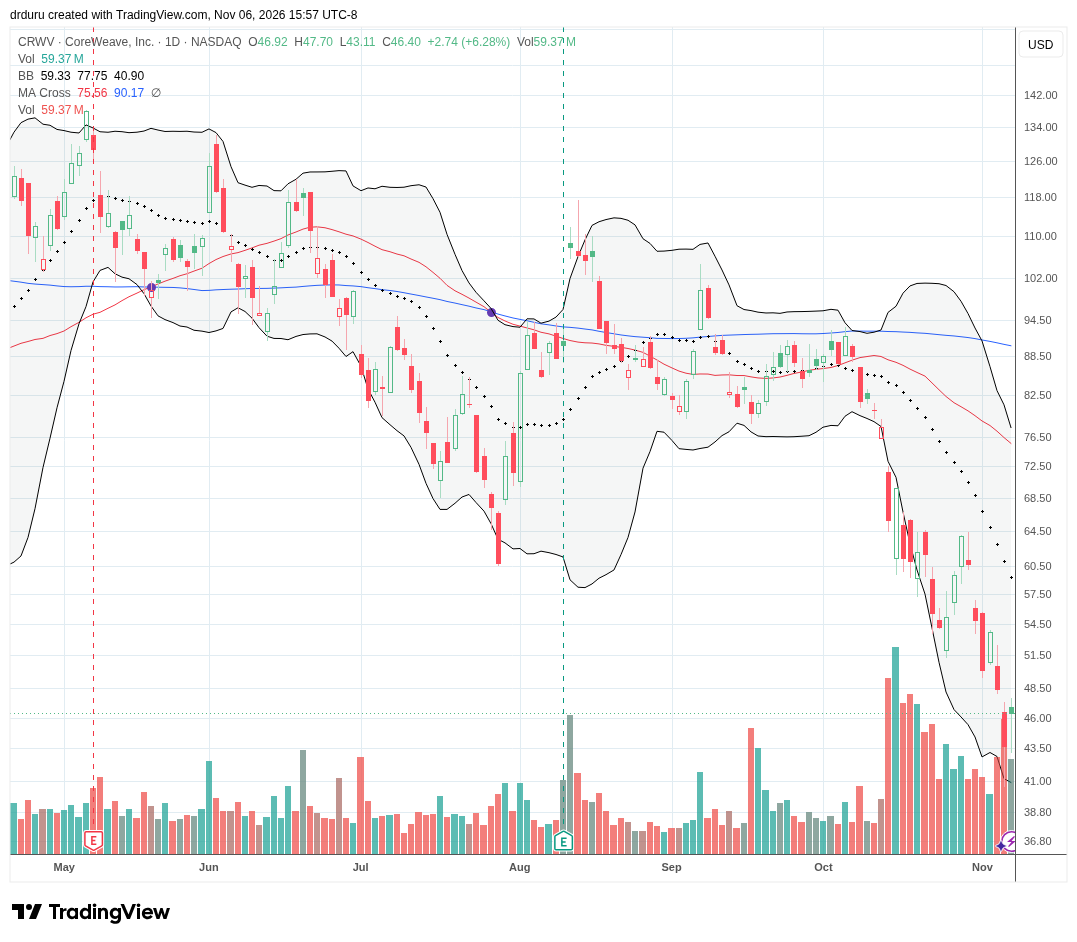
Technical Status: CoreWeave, Inc. (CRWV) extended its 17-month losing streak with Thursday’s 9.8% pullback and a 19-month low.
Trade Commentary: With earnings coming up this week, I have zero interest in trading CRWV. I will be watching for the company to mount a formal and thorough defense against the growing concerns about the company’s debt-load and demand for its cloud services. In a telling outreach effort, CRWV sent a letter to the Democratic governor-elect of Texas reassuring Gina Hinojosa about their plans for responsible development of data centers.
Oracle Corporation (ORCL)
Description: Oracle Corporation provides enterprise database software, business applications and cloud computing infrastructure.
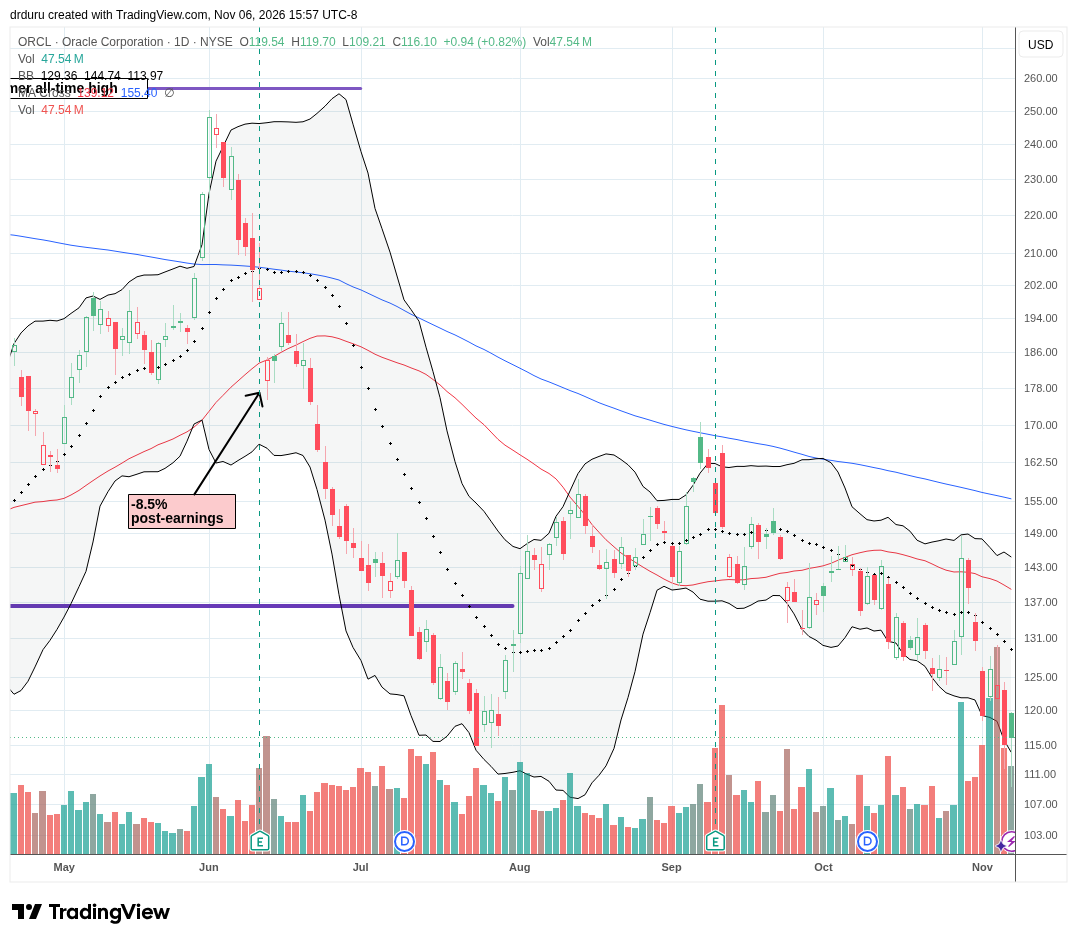
Technical Status: Oracle Corporation (ORCL) slid its way into a test of the Situational Low in July.
Trade Commentary: Oracle announced the pricing of concurrent public stock and debt offerings totaling approximately $20 billion on November 2. The common stock offering covered 86,206,897 shares priced at $116 per share, while the senior notes offering totaled $10 billion across five maturities. Oracle stated that net proceeds could be used for general corporate purposes including capital expenditures, debt repayment, investments and other corporate activities.
ORCL delivered an early warning about the AI trade when it suffered a post-earnings blow-off top over a year ago. That warning flashed hyper-red with May’s sharp run-up that stopped short of challenging the former all-time high. So when the stock market reacted poorly to Oracle’s latest financing plans, I prepared to exit my stock and even bought a put spread. I took profits on the put spread and sold the stock in the middle of Thursday’s sell-off. I have no interest in returning to ORCL anytime soon. There are much easier prospects out there in the AI trade.
Amazon.com, Inc. (AMZN)
Description: Amazon.com, Inc. operates online and physical retail businesses, digital services and the Amazon Web Services cloud computing platform.
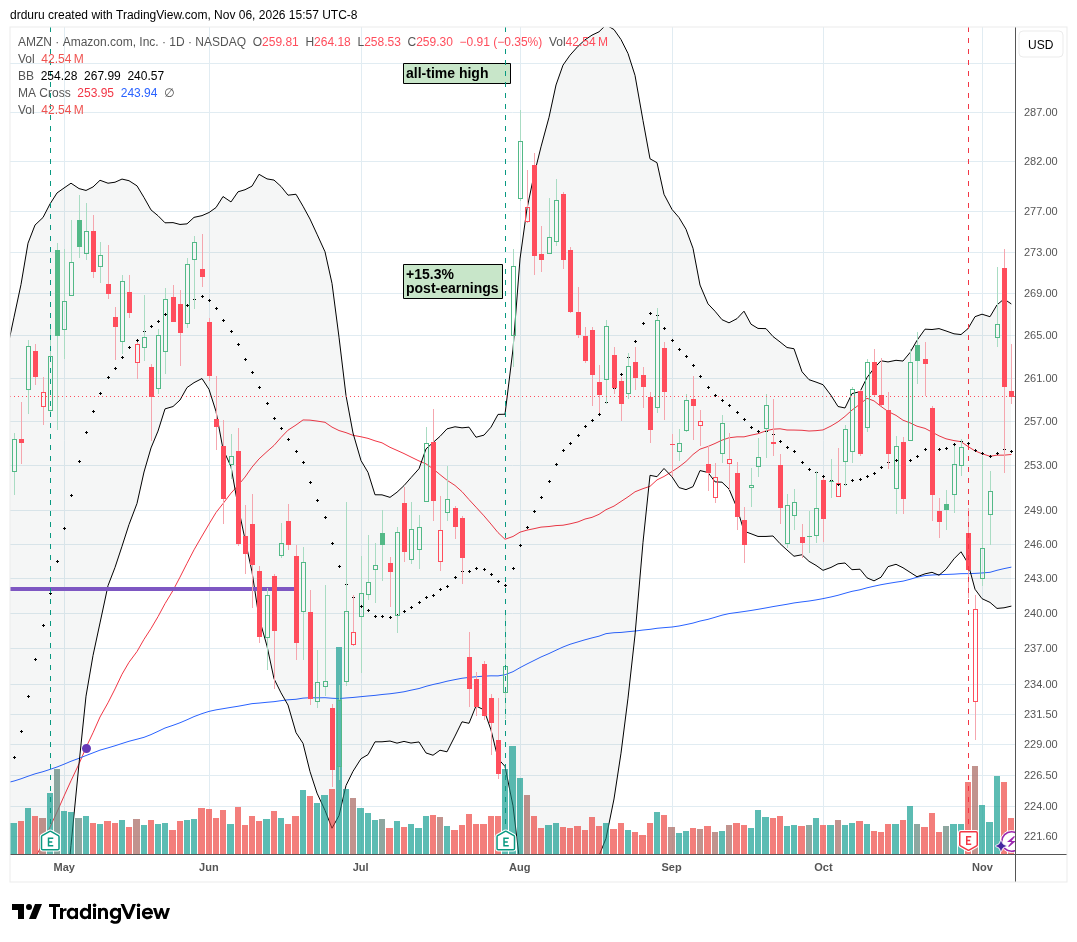
Technical Status: Amazon.com, Inc. (AMZN) defended 50DMA support and limited losses on Thursday to 2.2%.
Trade Commentary: AMZN was a rare big cap tech bright spot last week as it continued a dramatic recovery from its post-earnings loss the prior week. While the stock reversed sharply on Thursday, it held 50DMA support. Accordingly, I put the stock on my buy list for this coming week.
Data Center Cooling and Building Systems
Vertiv Holdings Co (VRT)
Description: Vertiv Holdings Co designs and supplies power management, cooling and infrastructure systems for data centers and other critical facilities.
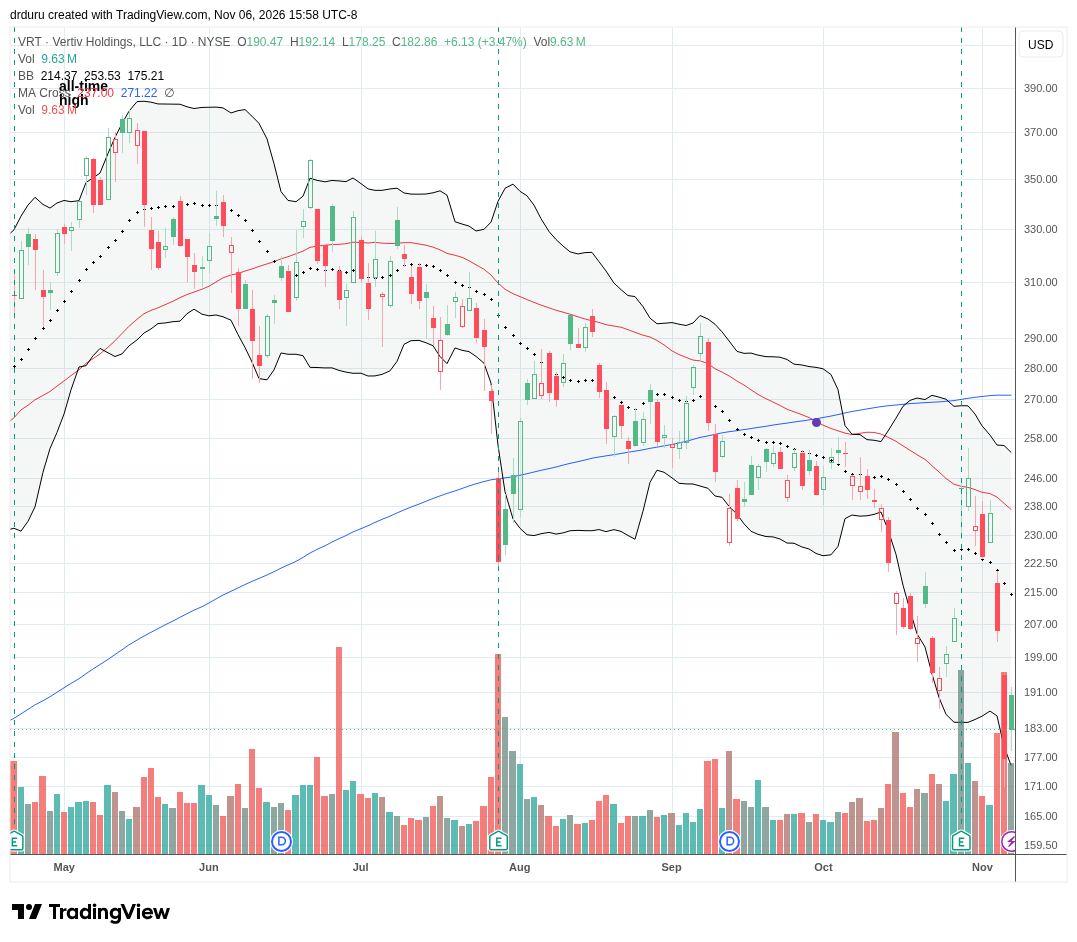
Technical Status: Vertiv Holdings Co (VRT) maintained its downtrend after failing at 50DMA resistance, reversing its 16.5% post-earnings gain, and setting a 10-month low.
Trade Commentary: VRT remains my favorite AI-related stock, but its position in the center of the data center firestorm means that its months-long downtrend is likely going to continue for months to come. Thus, I am content to wait for the stock to convincingly trade above 50DMA resistance or buy if it drops quickly to its former 2025 all-time high (marked by the purple line below).
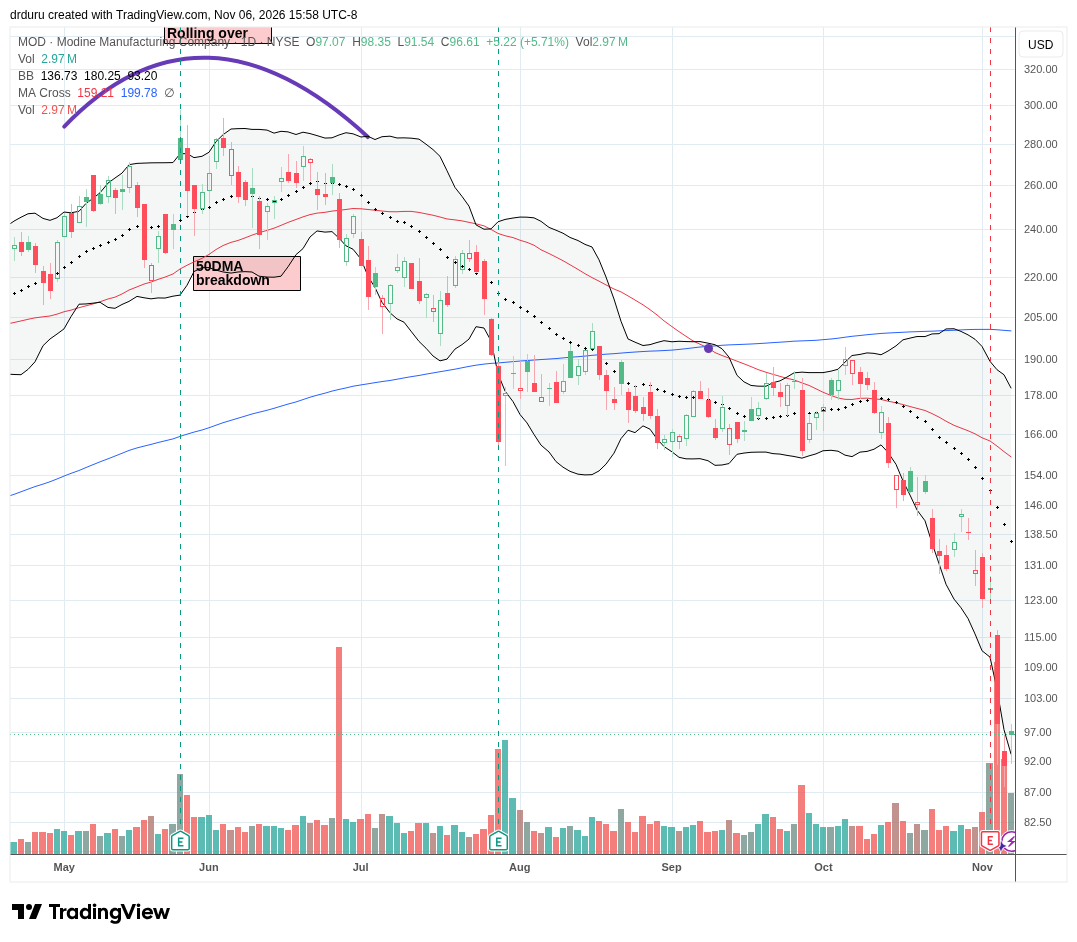
Modine Manufacturing Company (MOD)
Description: Modine Manufacturing Company develops thermal management equipment and systems for data centers, commercial HVAC and industrial applications.
Technical Status: Modine Manufacturing Company (MOD) plunged 21.4% post-earnings and dropped to a 14-month low before a slight rebound.
Trade Commentary: Modine reported second-quarter fiscal 2027 financial results on November 3. Net sales increased 35% year over year to $994.4 million, while adjusted EBITDA increased 31% to $136.2 million. The company reported revenue growth of 95% in its Data Centers segment and 23% in Commercial HVAC. Modine also updated its full-year revenue outlook for its core business. Skeptical and cautious questions about earnings combined with Thursday’s evacuation from data center related stocks sent MOD hurtling lower. Like so many AI-related stocks, the rolling over I pointed out across May and June looks even more prominent now!
Johnson Controls International plc (JCI)
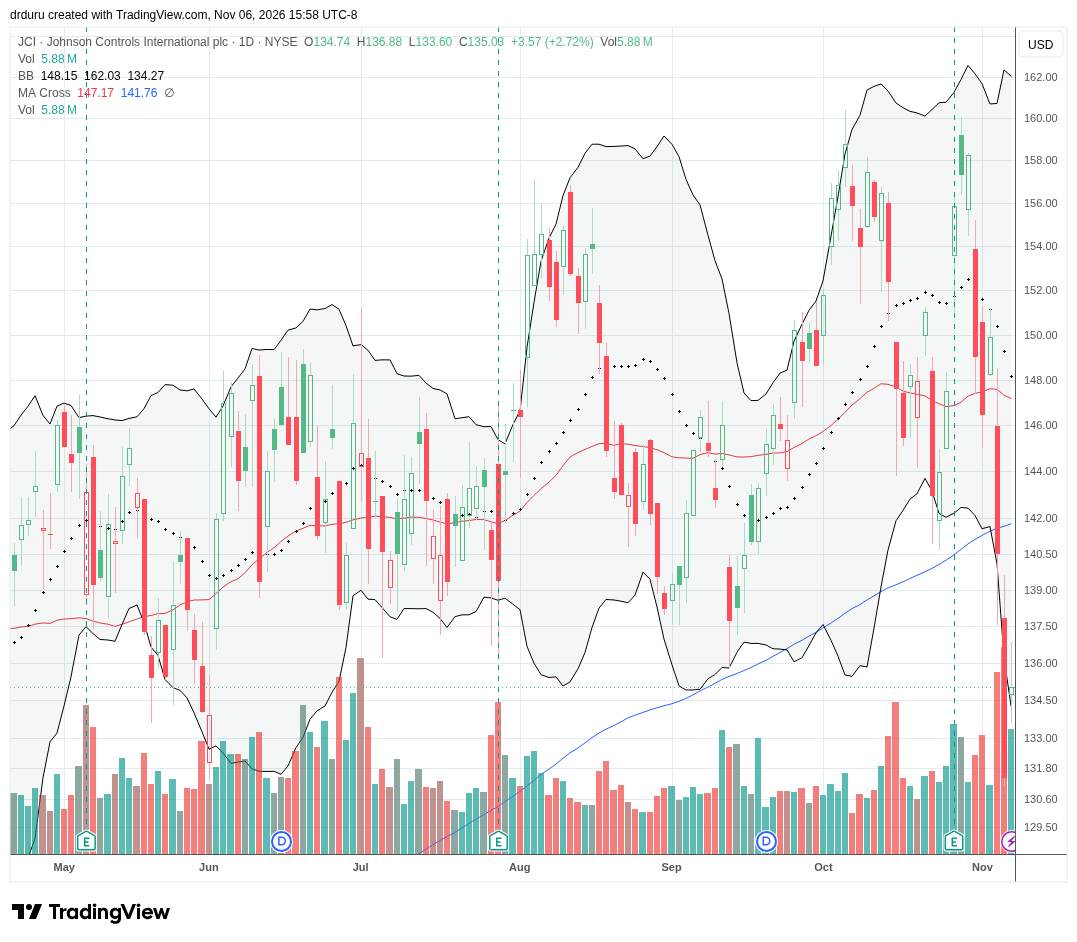
Description: Johnson Controls International plc provides building management systems, heating and cooling equipment, fire protection and security technologies.
Technical Status: Johnson Controls International plc (JCI) confirmed a 200DMA breakdown with a 6.5% pullback on Thursday.
Trade Commentary: JCI did not suffer last week nearly as much as MOD. The sharp divergence takes me back to January’s idea for a pairs trade shorting MOD versus going long JCI. That trade did not work well then but would have worked quite well in recent weeks. Given JCI had a very positive post-earnings response last month, even trading back to its all-time high, I am revisiting the pairs trade idea.
Enterprise Software and Cloud Platforms
Palantir Technologies Inc. (PLTR)
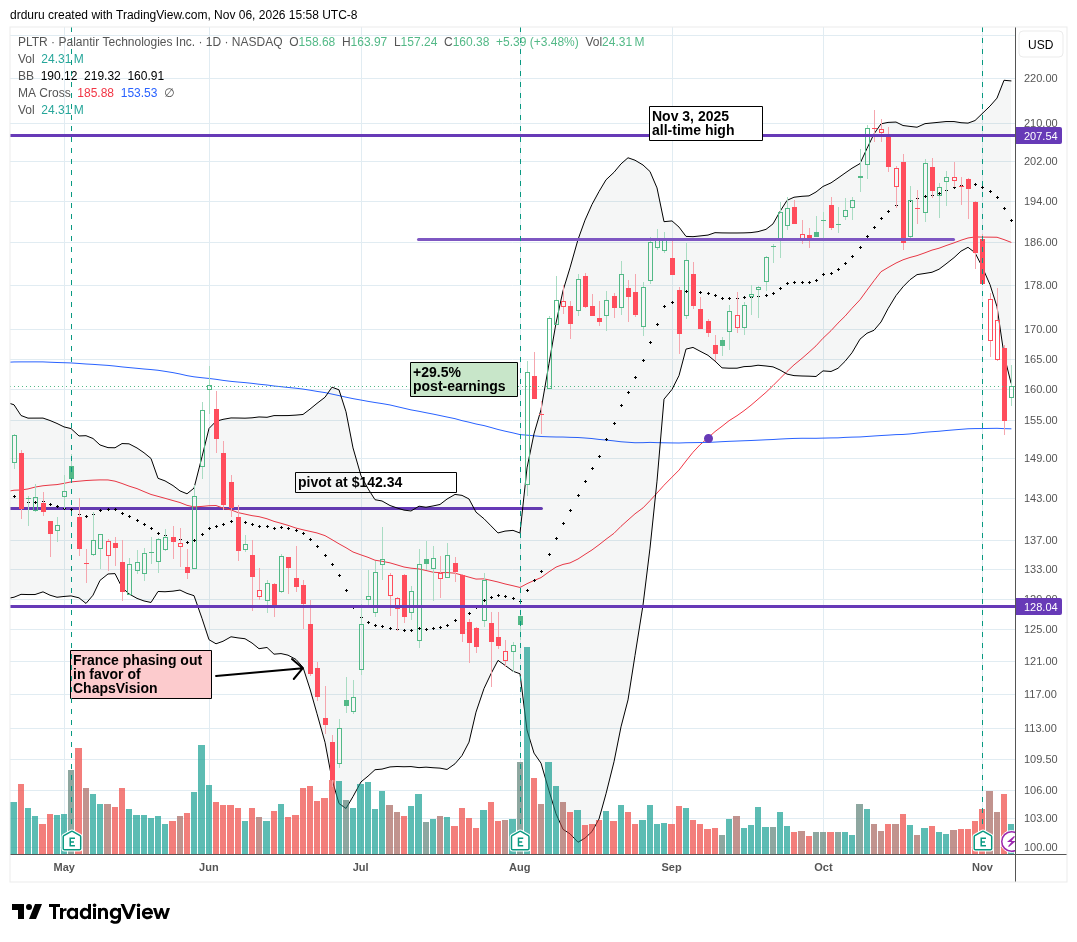
Description: Palantir Technologies Inc. develops software platforms for data integration, analytics and artificial intelligence applications used by commercial and government customers.
Technical Status: Palantir Technologies Inc. (PLTR) confirmed a 50DMA breakdown before earnings and continued selling from there. Its 200DMa held as support in the wake of Thursday’s 9.7% loss.
Trade Commentary: Palantir reported third-quarter financial results on November 2, with revenue increasing 96% year over year to $2.313 billion. U.S. commercial revenue increased 148% to $984 million. The company reported that U.S. commercial revenue exceeded U.S. government revenue for the first time. Palantir also reported 212 deals valued at $1 million or more during the quarter. I finally got back into a PLTR trade after buyers defended 200DMA support; I bought a calendar call spread at the $175 strike.
Datadog, Inc. (DDOG)
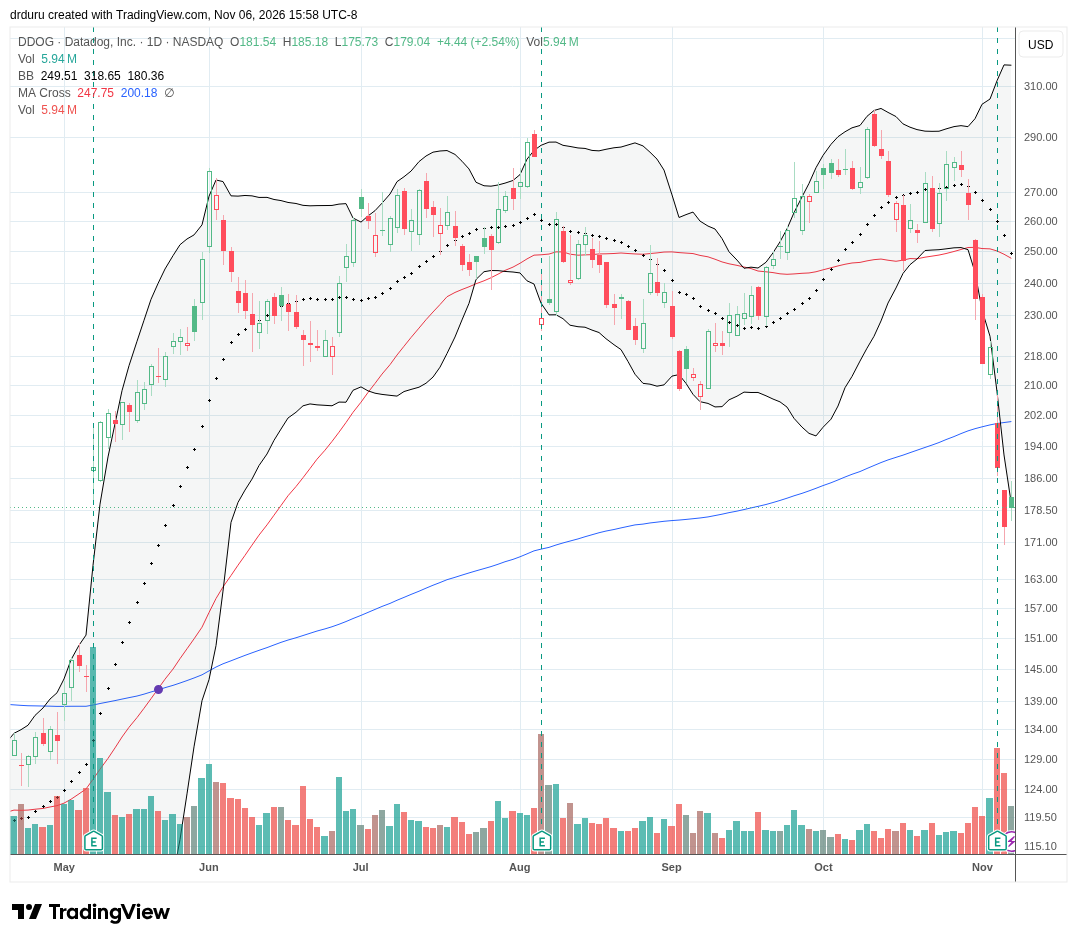
Description: Datadog, Inc. provides cloud-based observability, application monitoring and security software for enterprise technology environments.
Technical Status: Datadog, Inc. (DDOG) is over-extended to the downside with 6 straight days closing below its lower Bollinger Band. A 7.5% post-earnings breakdown on Thursday confirmed a 200DMA breakdown to a 6-month low.
Trade Commentary: Datadog announced third-quarter financial results on November 4, reporting revenue of $1.20 billion, up 35% year over year. GAAP operating income was $75 million, and operating cash flow was $290 million. The company reported approximately 4,860 customers with annual recurring revenue of at least $100,000 as of September 30, compared with approximately 4,060 a year earlier. The release also described Scout 1.0, Datadog’s specialized AI model for investigating production issues. DDOG looks topped out, but given the quality of its business, I am willing to speculate on a rebound toward 50DMA resistance with a stop loss below Thursday’s low.
Fastly, Inc. (FSLY)
Description: Fastly, Inc. operates an edge cloud platform offering content delivery, application security and computing services.
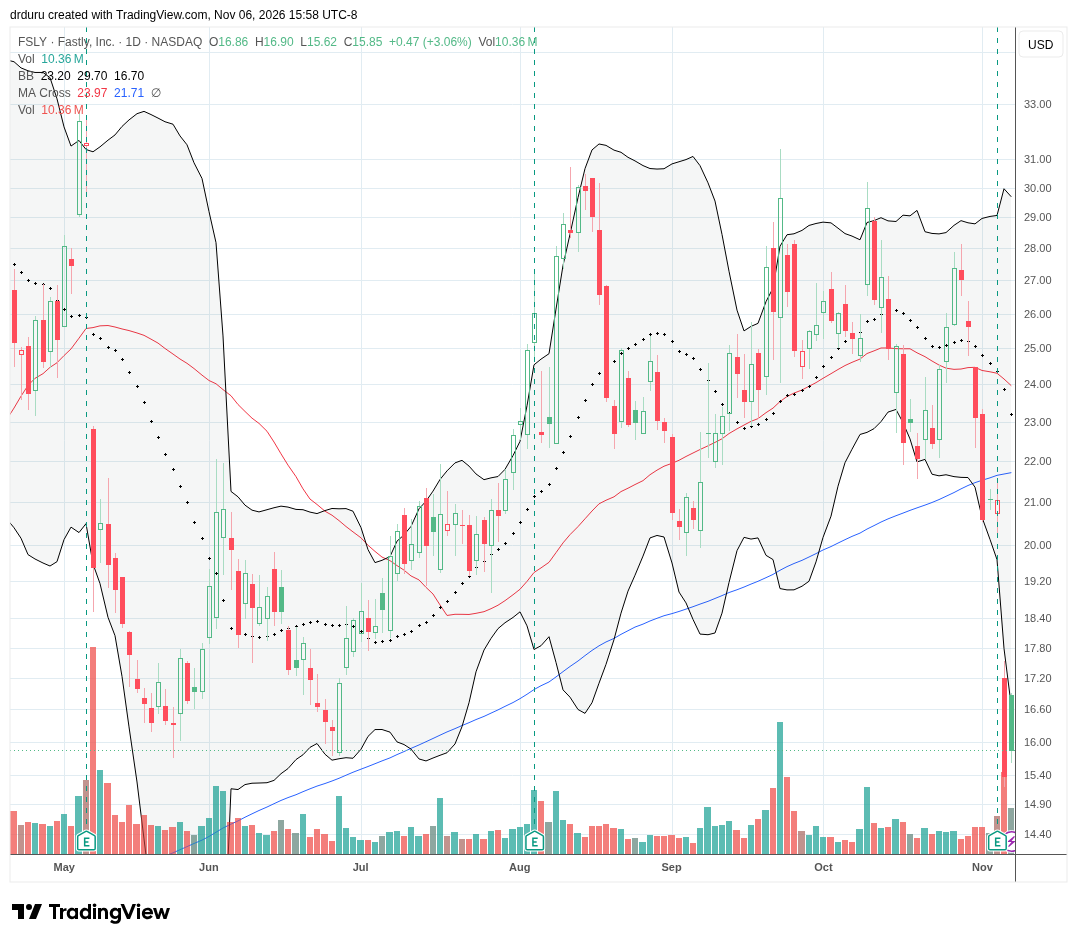
Technical Status: Fastly, Inc. (FSLY) crashed 26.9% post-earnings to a 9-month low that confirmed a 200DMA breakdown.
Trade Commentary: Fastly announced third-quarter financial results on November 4, reporting revenue of $190.2 million, an increase of 20% year over year. GAAP gross margin was 63.3%, compared with 58.4% in the prior-year period. The company reported trailing-12-month net revenue retention of 119%. Analysts panned the results and helped to drive the post-earnings crash on a day where investors were evacuating out of tech stocks and causing exaggerated reactions to bad news. FSLY’s relatively low price/sales ratio makes me comfortable speculating on a relief rally with a stop loss below Thursday’s low.
Freshworks Inc. (FRSH)
Description: Freshworks Inc. develops cloud software for customer service, employee service management and business operations.
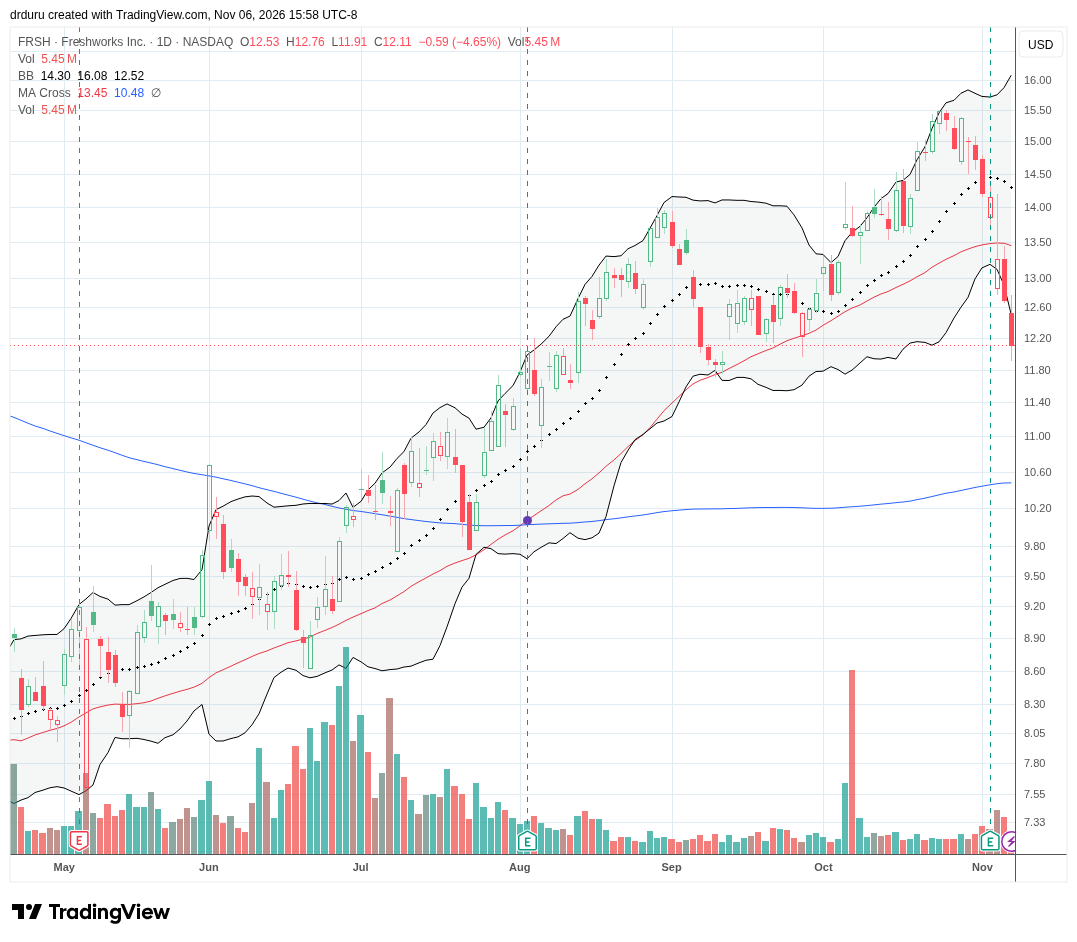
Technical Status: Freshworks Inc. (FRSH) lost 50DMA support with a 6.3% post-earnings loss. Thursday’s tech sell-off accelerated FRSH’s downside along its lower Bollinger Band.
Trade Commentary: Freshworks released third-quarter financial results on November 3, reporting revenue of $245.4 million, an increase of 14% year over year. The company reported GAAP net income of $18.3 million and adjusted free cash flow of $73.9 million. GAAP operating income was $28.2 million, compared with an operating loss in the prior-year quarter. I was late in preserving my remaining profits in FRSH. I should have exited on the confirmation of the 50DMA breakdown on Thursday. Instead, I reluctantly exited on Friday. FRSH delivered one of my most consistent uptrends this year, so it was hard to stick to my rules and let it go!
Enterprise Computing Hardware
Dell Technologies Inc. (DELL)
Description: Dell Technologies Inc. provides personal computers, enterprise servers, data storage equipment and related information technology products and services.
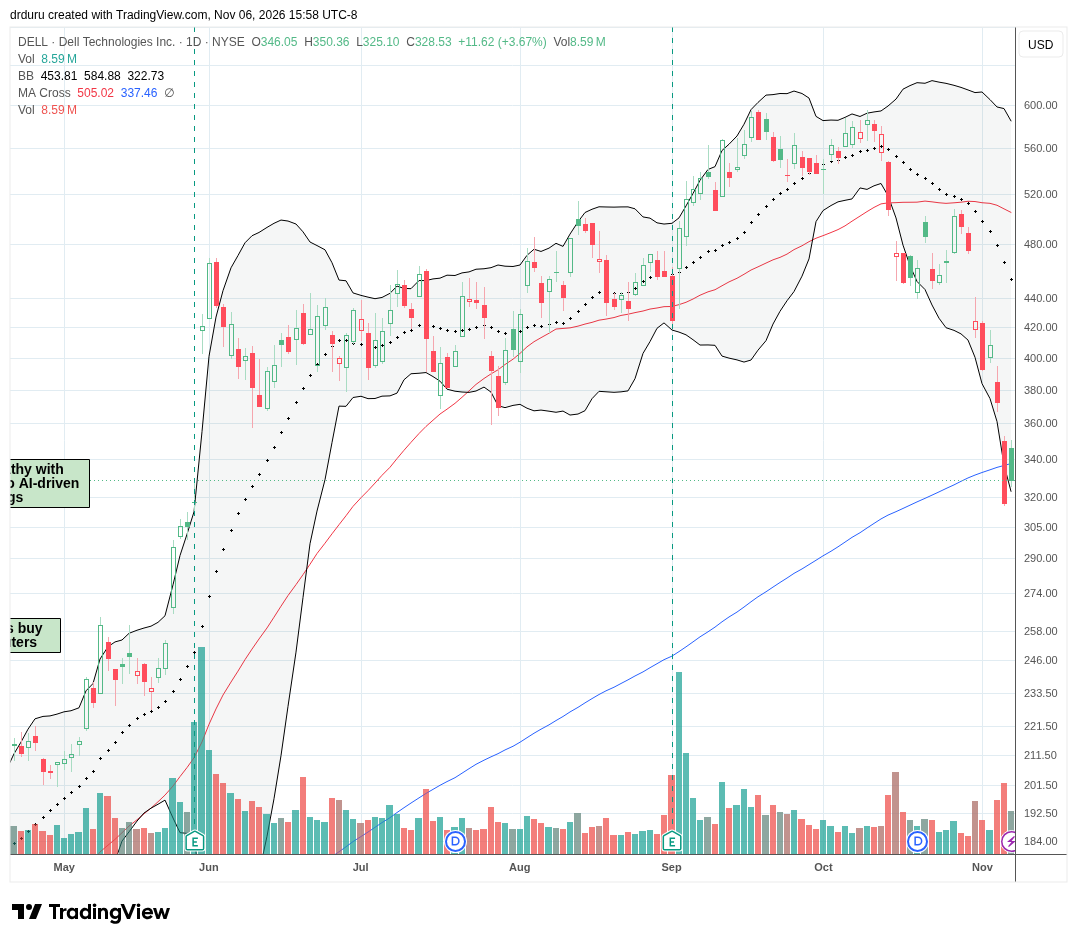
Technical Status: Dell Technologies Inc. (DELL) suffered a 200DMA breakdown with a 14.9% loss on Thursday.
Trade Commentary: I was slow to realize the implications of INTC’s poor earnings. I first assumed INTC’s problems were company-specific. However, reported PC weakness took DELL down 10.8% with a further confirmation of 50DMA resistance. DELL’s inability to recover 200DMA support on Friday puts the stock on short list.
Hewlett Packard Enterprise Company (HPE)
Description: Hewlett Packard Enterprise Company supplies enterprise servers, networking equipment, hybrid cloud infrastructure and information technology services.
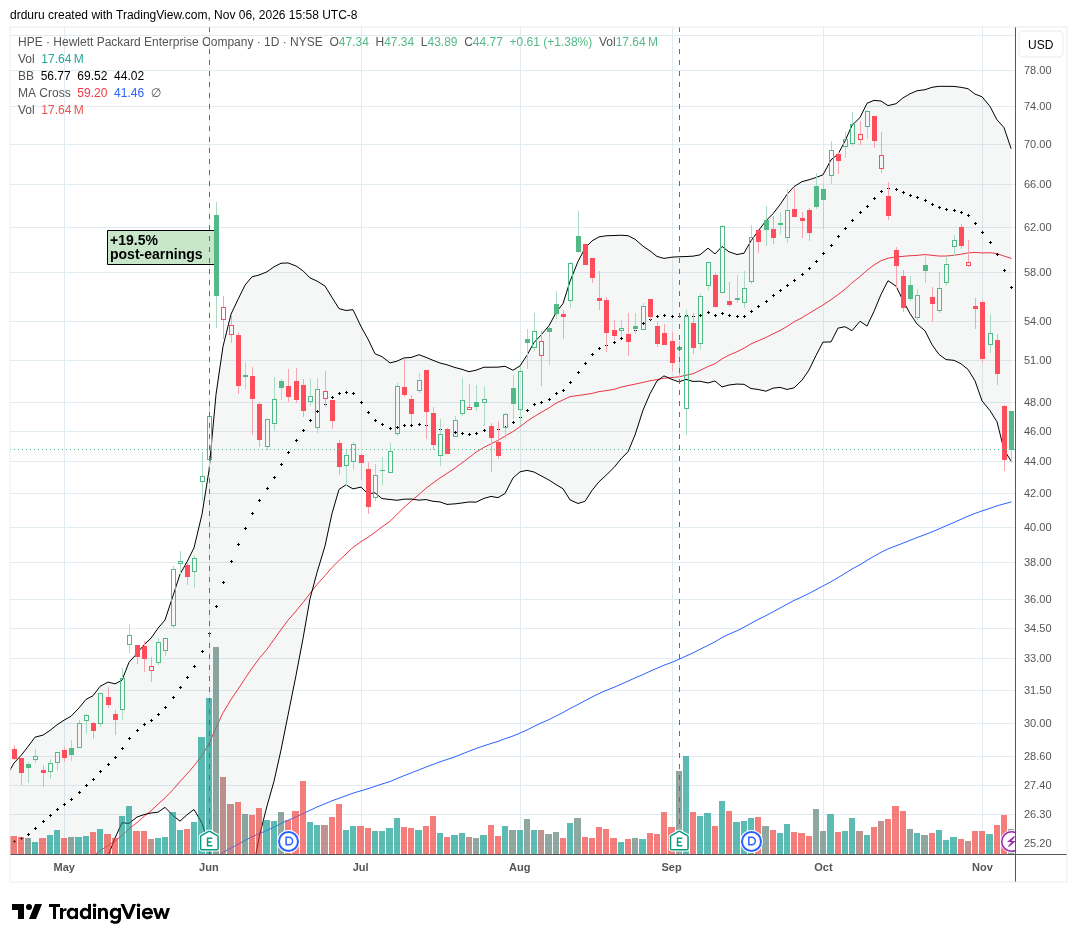
Technical Status: Hewlett Packard Enterprise Company (HPE) fell to a 4-month low as selling continued after INTC’s post-earnings collapse.
Trade Commentary: I was not as slow in recognizing HPE’s vulnerability in the wake of INTC’s results. I bought puts on Wednesday and took profits the next day. However, I exited in the early part of Thursday’s selling. An 11.8% collapse was not on my bingo card!
Digital Engineering and Technology Research
EPAM Systems, Inc. (EPAM)
Description: EPAM Systems, Inc. provides software engineering, digital transformation and technology consulting services to businesses worldwide.
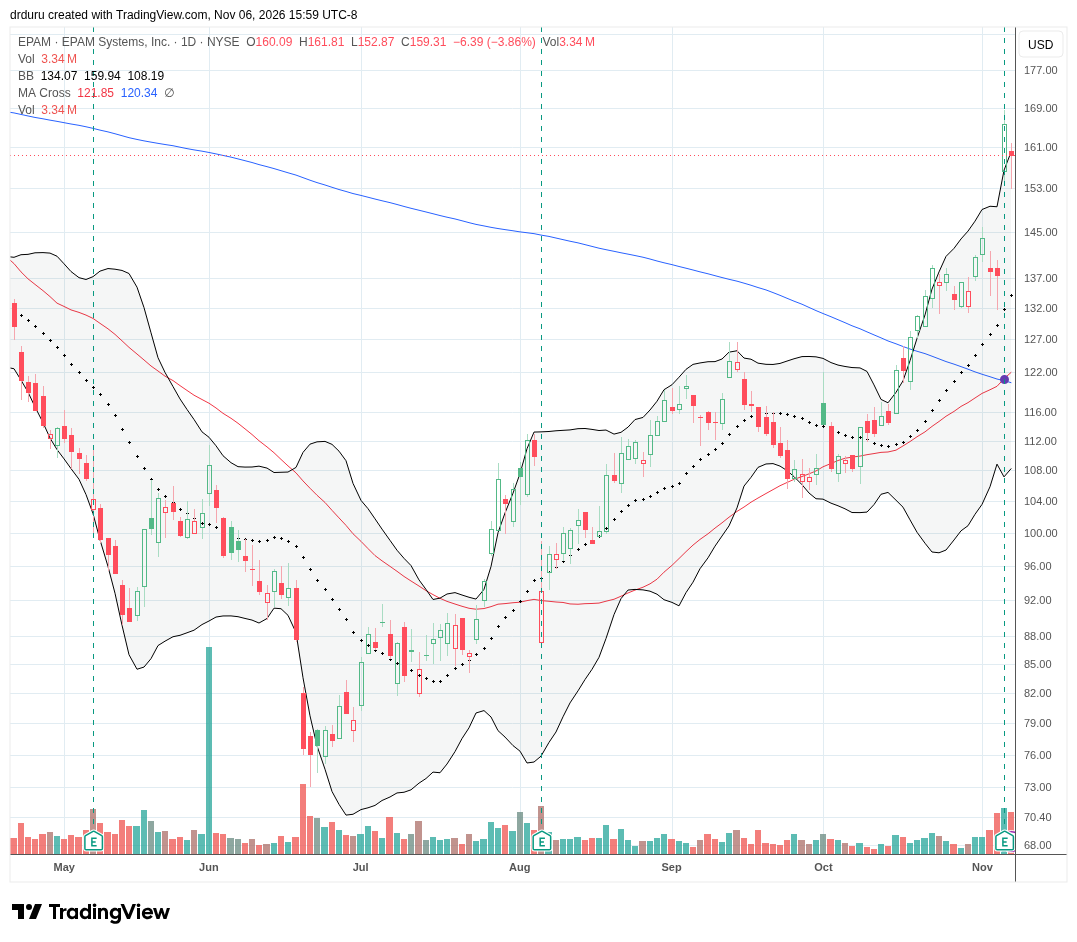
Technical Status: EPAM Systems, Inc. (EPAM) surged 20.6% post-earnings and finished reversing February’s post-earnings gap down.
Trade Commentary: EPAM reported third-quarter financial results on November 5, including revenue of approximately $1.426 billion, an increase of 2.3% year over year. The company also announced an additional $1.5 billion authorization for share repurchases. The rally seems outsized for such small revenue growth, but the buyback is encouraging. I like the stock’s 200DMA breakout last month, so it is a buy-the-dips stock for me.
Gartner, Inc. (IT)
Description: Gartner, Inc. provides business and technology research, advisory services and conferences to organizations worldwide.
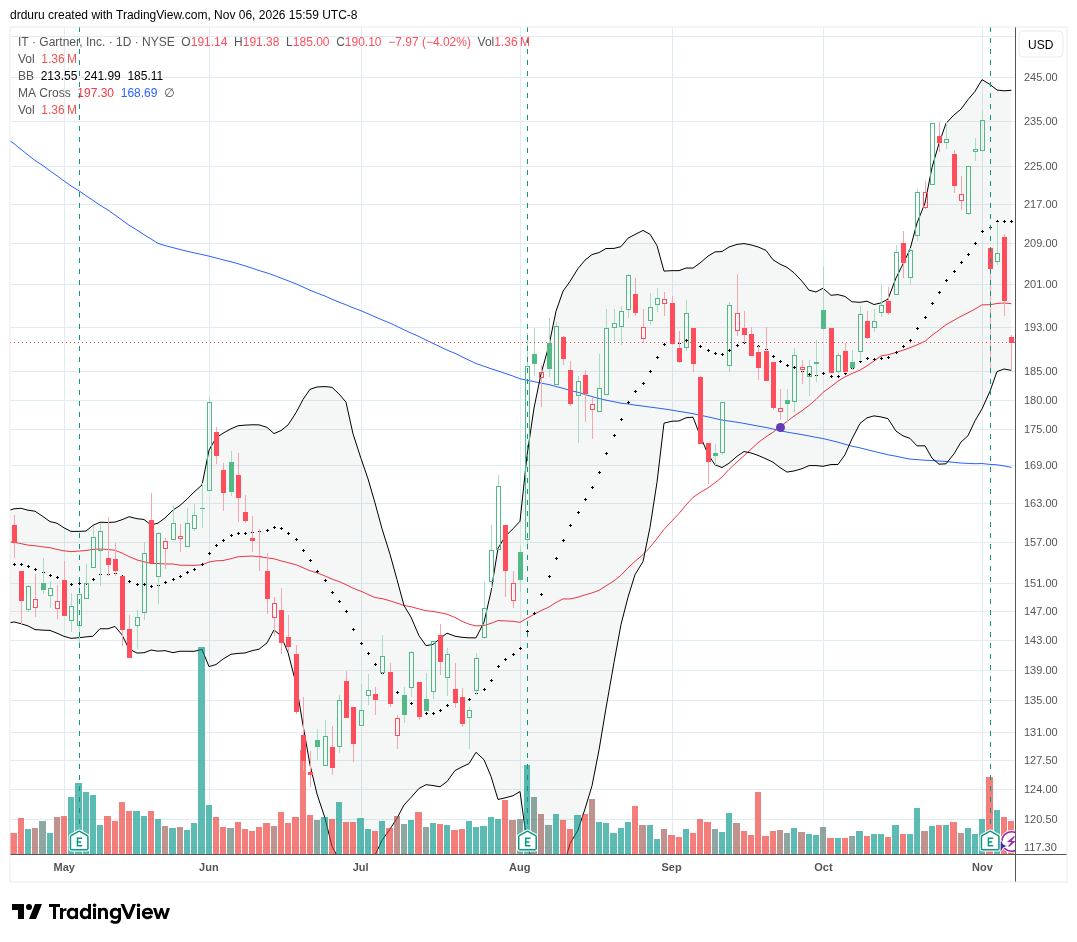
Technical Status: Gartner, Inc. (IT) lost 13.2% post-earnings and held 50DMA support despite Friday’s 4.1% loss.
Trade Commentary: Gartner reported third-quarter financial results on November 3, including revenue of approximately $1.5 billion, a decline of 1.3% as reported from the prior-year quarter. Foreign exchange-neutral contract value was $5.3 billion, up 2.5% year over year. The company reported diluted earnings per share of $3.35 and adjusted diluted earnings per share of $3.59. Gartner also raised its 2026 adjusted EPS outlook. However, the stock still fell as analysts panned the results as weak. This kind of pullback once again validates my approach to risk management which had me lock in profits after IT traded well above its upper Bollinger Band for two weeks. As planned I am looking to get back into IT, and a test of 200DMA support could provide a good risk/reward entry.
Electric Power and Solar Energy
Vistra Corp. (VST)
Description: Vistra Corp. is an electricity generation and retail energy company operating nuclear, natural gas and other power generation assets.
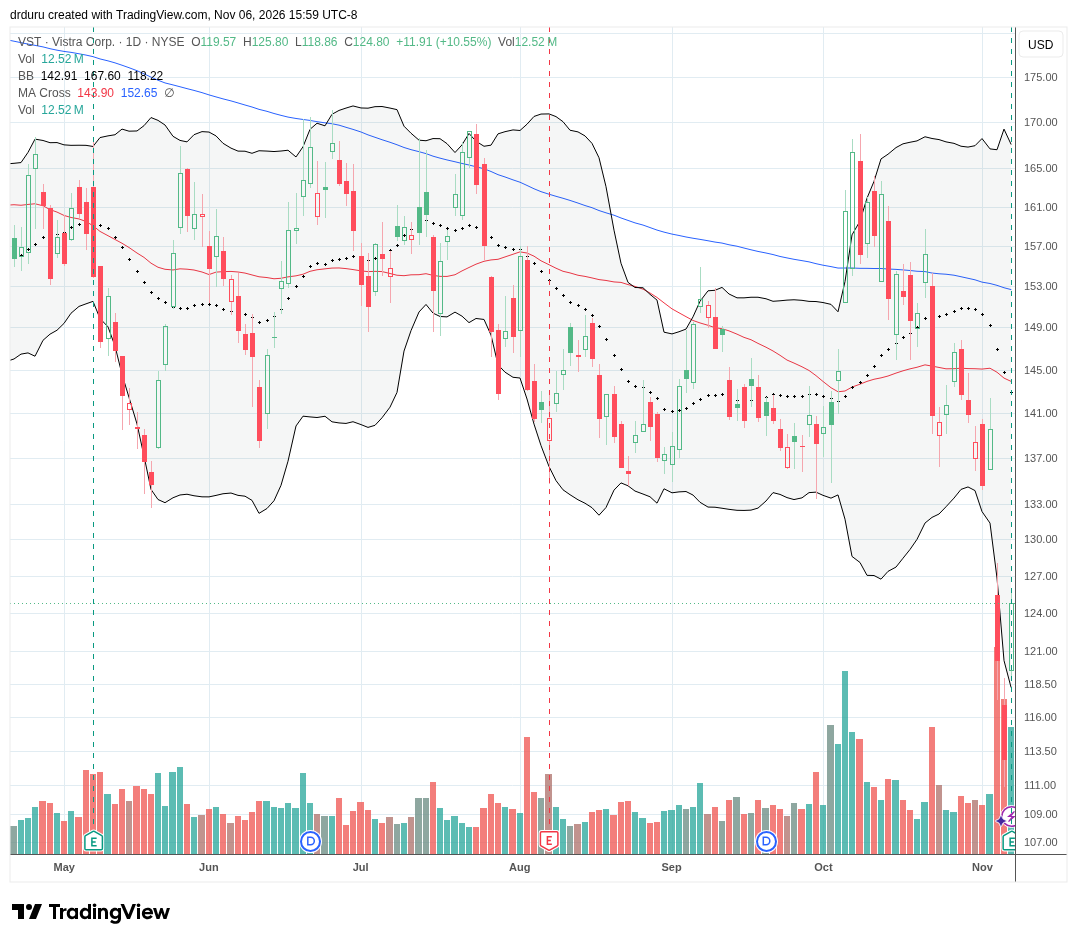
Technical Status: Vistra Corp. (VST) has drifted lower for over a year after setting an all-time high. A 10.6% post-earnings jump reversed some of the post-election damage.
Trade Commentary: Vistra reported third-quarter results on November 6, including GAAP net income of $1.14 billion. Ongoing Operations Adjusted EBITDA totaled $2.378 billion, an increase of more than 50% from the prior-year quarter. Vistra also updated its 2026 Ongoing Operations Adjusted EBITDA guidance to a range of $7.1 billion to $7.5 billion. I checked in on VST given its position in powering data centers. VST’s long downtrend surprised me. I do not have an interest in buying this one as the stock looks like it will offer a lot of frustrating chop.
Invesco Solar ETF (TAN)
Description: The Invesco Solar ETF is an exchange-traded fund providing index-based exposure to companies involved in the global solar energy industry.
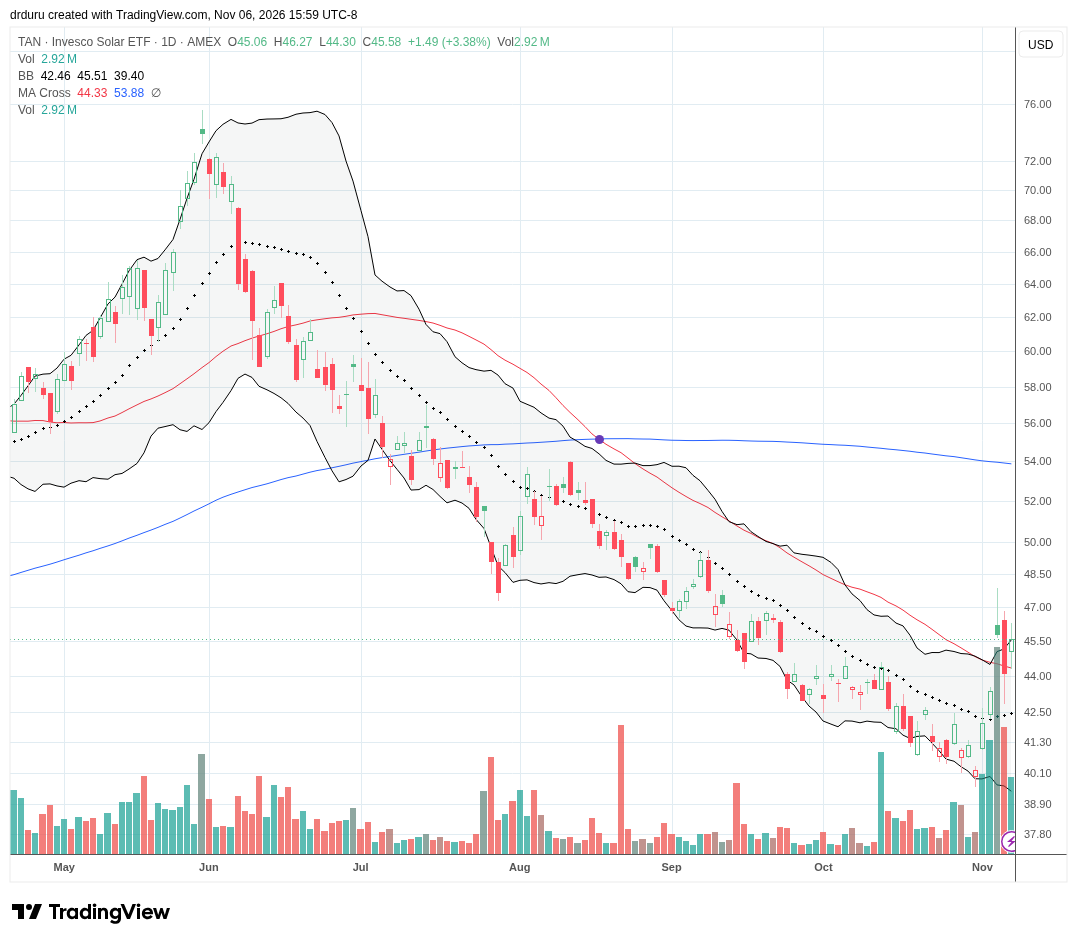
Technical Status: A downtrend since May’s all-time high came to an end for Invesco Solar ETF (TAN) after a post-election 5.6% jump above 50DMA resistance.
Trade Commentary: Given the Democratic tsunami in the midterm elections, I of course had to check in on green and alternative energy plays. TAN neatly hurdled over 50DMA resistance on the first day after the election and sellers on Thursday failed to keep the stock down on Friday. I already own FSLR, but I was surprised to see just how poorly TAN has done since its blow-off top in late May. I added to my FSLR shares.
Infrastructure Construction and Industrial Equipment
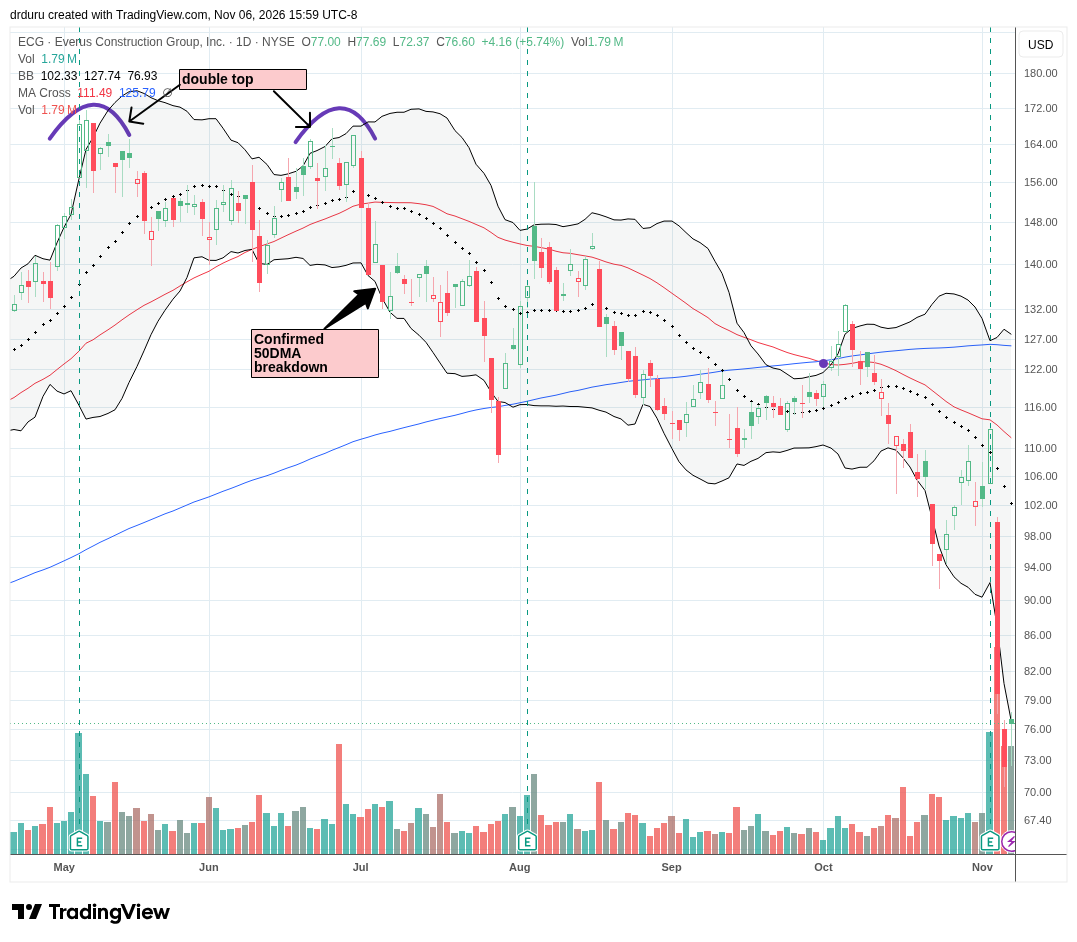
Everus Construction Group, Inc. (ECG)
Description: Everus Construction Group, Inc. provides electrical and mechanical construction services and utility transmission and distribution infrastructure work.
Technical Status: Everus Construction Group, Inc. (ECG) plunged 29.3% post-earnings and closed at a 15-month low on Thursday.
Trade Commentary: Everus reported third-quarter financial results on November 3, with revenue of $1.38 billion, an increase of 40.3% year over year. The company reported net income of $91.9 million and quarter-end backlog of $5.48 billion. Everus increased its full-year revenue guidance to a range of $5.0 billion to $5.1 billion. ECG crashed despite the strong earnings. I suspect the election results drove much of the exaggerated selling, so I bought shares on Thursday. Last week’s collapse validated my July exit from ECG in the immediate wake of the stock’s topping pattern and confirmed 50DMA breakdown.
MasTec, Inc. (MTZ)
Description: MasTec, Inc. provides engineering and construction services for power, communications, energy and other infrastructure projects.
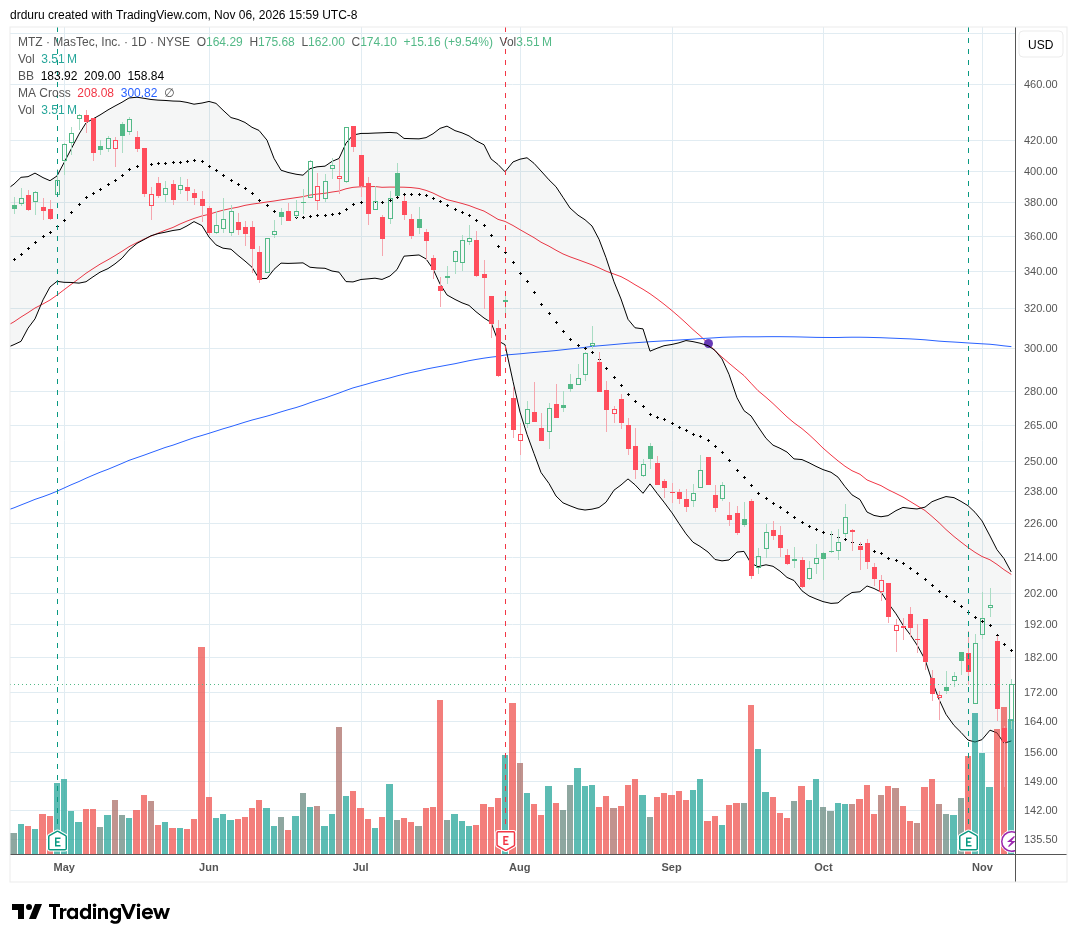
Technical Status: MasTec, Inc. (MTZ) lost out in the post-election selling starting with Wednesday’s 15.4% loss followed by a 5.2% drop to an 18-month low. The stock roared back to life with Friday’s 9.5% gain.
Trade Commentary: MTZ caught my attention as a long-suffering industrial/infrastructure stock trading at extremely low levels. I decided to buy shares after seeing news that the company would eschew acquisitions in favor of buying back shares. MTZ is an example where I make an exception in favor of a longer-term thesis on multi-year cycle of infrastructure build-outs.
Caterpillar Inc. (CAT)
Description: Caterpillar Inc. manufactures construction and mining machinery, engines, turbines and related industrial equipment.
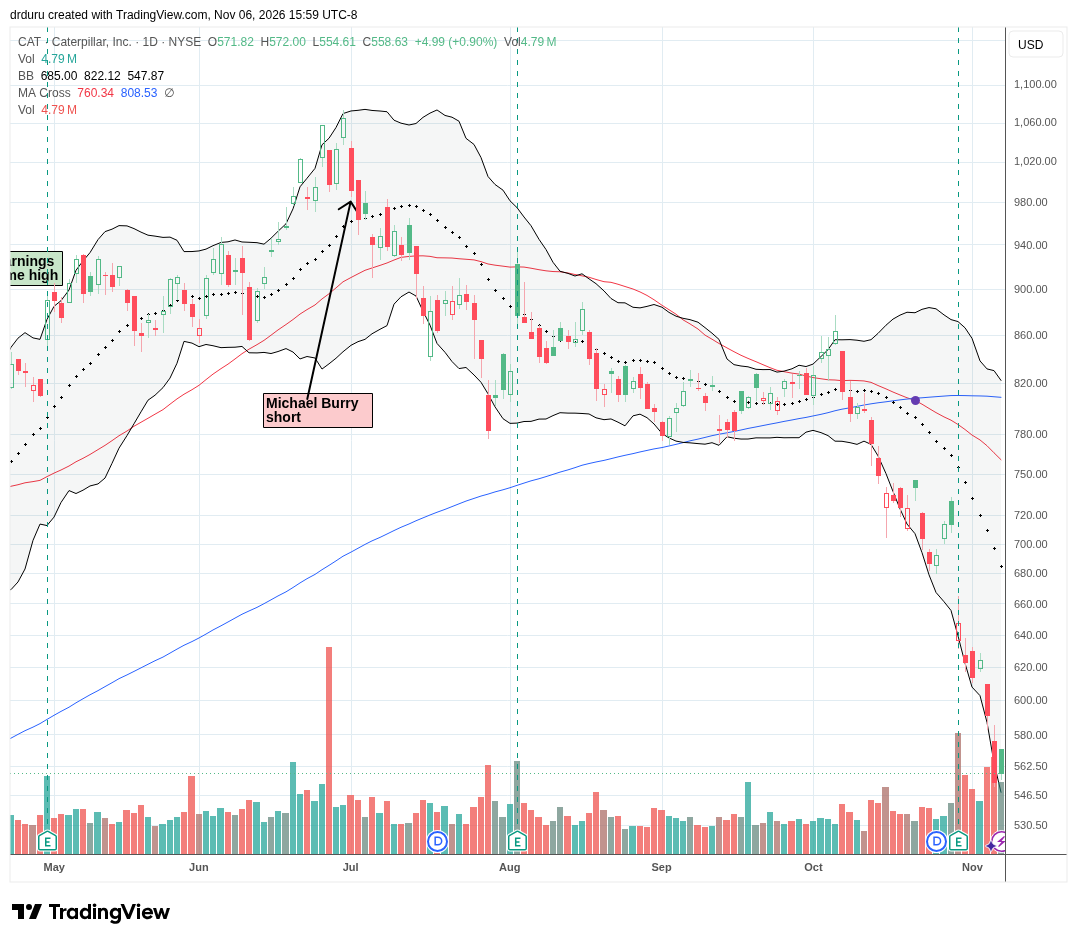
Technical Status: Caterpillar Inc. (CAT) fell to a 52-week low as October’s steep sell-off extended into a 9.3% post-earnings loss and Thursday’s 6.4% pullback.
Trade Commentary: I continue to marvel at CAT’s swift fall from grace. Since October’s false 50DMA breakout, CAT has sold off nearly every day with the lower Bollinger Band guiding the stock steeply downward. At one point on Thursday, CAT was negative for the year! I am interested in speculating on a rebound after the stock manages a close above $585, the intraday high from Thursday.
Oil Refining and Energy Commodities
Valero Energy Corporation (VLO)
Description: Valero Energy Corporation operates petroleum refineries and produces transportation fuels, renewable diesel and ethanol.
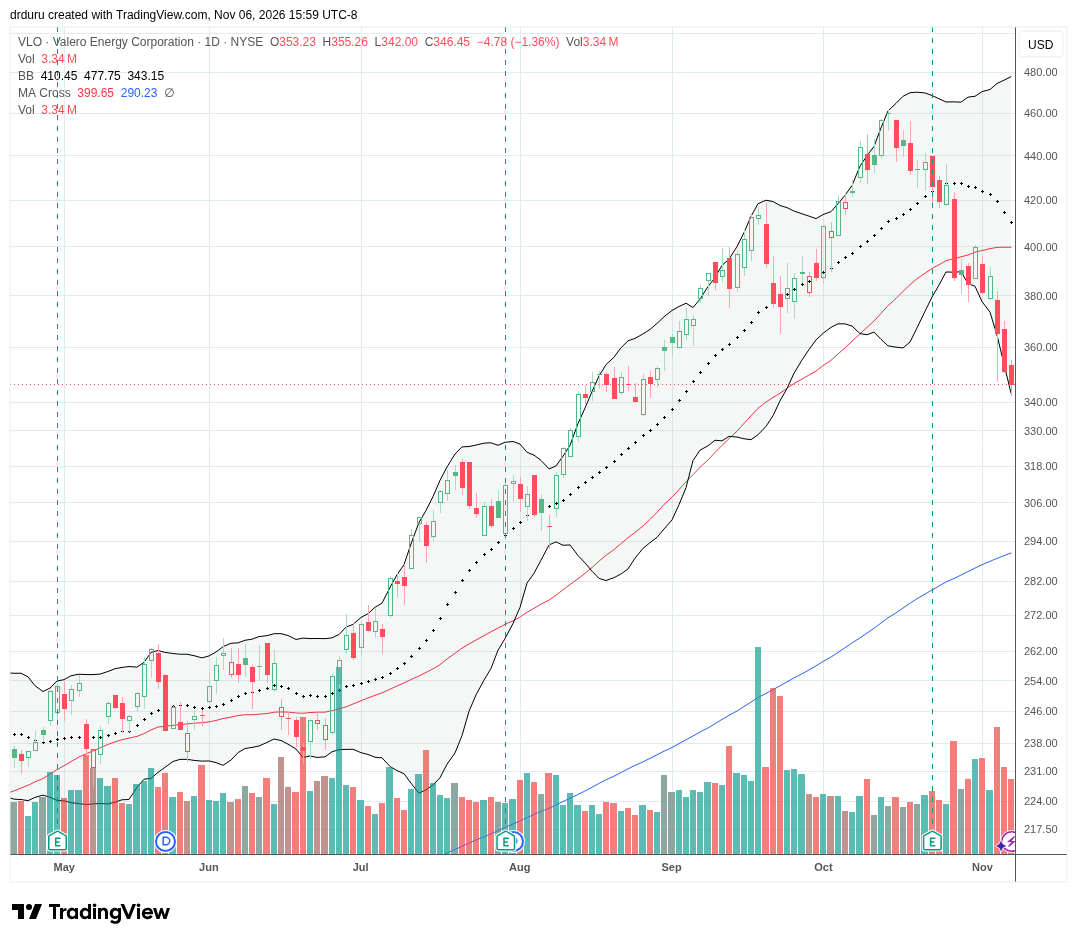
Technical Status: Valero Energy Corporation (VLO) dropped by 9.2% as it broke down below its 50DMA post-earnings, and continued to tumble while hugging its lower Bollinger Band.
Trade Commentary: The oil refiners have done quite well for quite some time. VLO looks like it has topped out with November’s high-volume continuation selling from a 50DMA breakdown. I am considering fading the stock on a rally toward its 50DMa resistance.
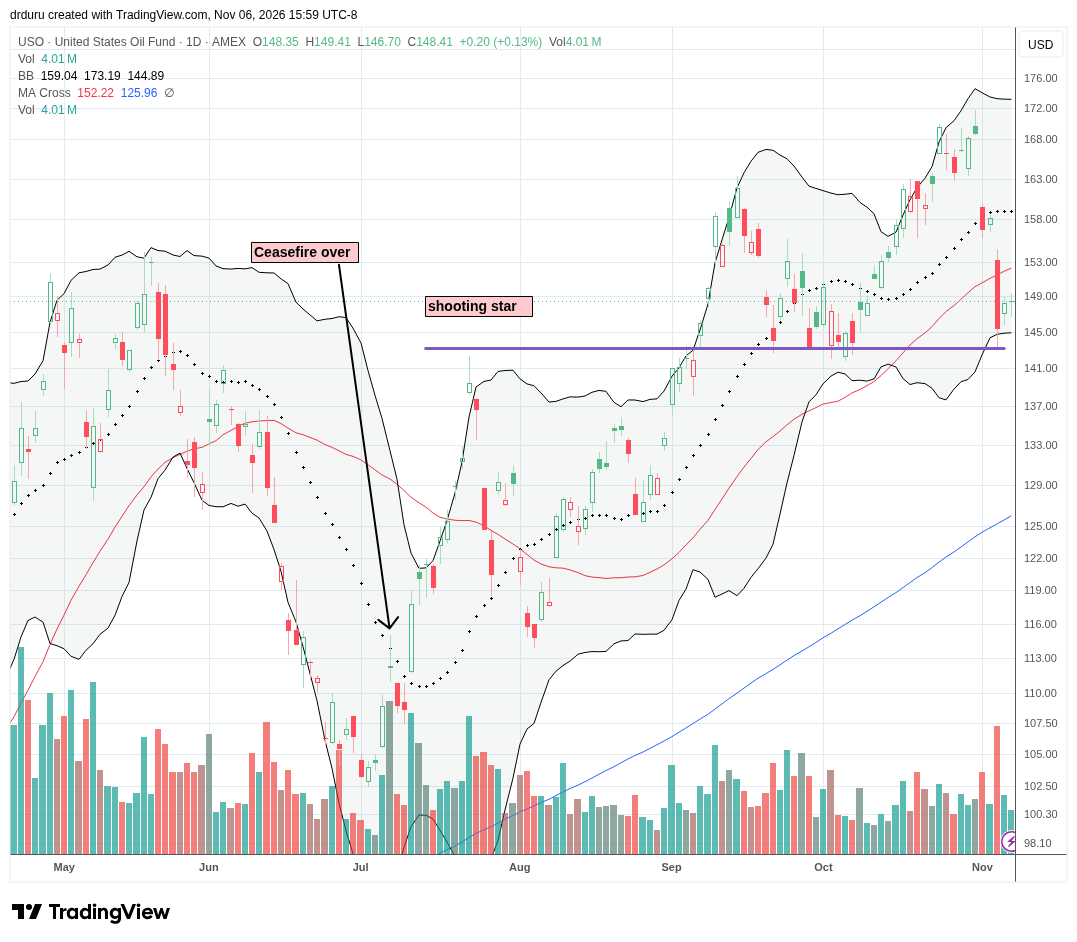
United States Oil Fund, LP (USO)
Description: United States Oil Fund, LP is an exchange-traded commodity pool that primarily uses crude oil futures contracts to pursue exposure to daily movements in the price of light, sweet crude oil.
Technical Status: The United States Oil Fund, LP (USO) sliced through 50DMA support with a post-election 8.1% loss. Buyers defended support around the October lows.
Trade Commentary: I heard a few narratives attempting to explain why oil fell so far and fast in the wake of the election. It barely made sense, but the steep loss aligns with my earlier expectation that oil would suffer large losses whenever the market stopped believing in ever higher prices. At the time I stated that I hoped to have puts in place when the moment came, assuming that my existing November $145/$135 put spread would not make the journey. Ironically, last week’s plunge was enough for me to lock in profits. Unlike some of the late September and early October trading action, I did not wait to see whether support would hold. And it did indeed hold AGAIN.
Financial Services and Payments
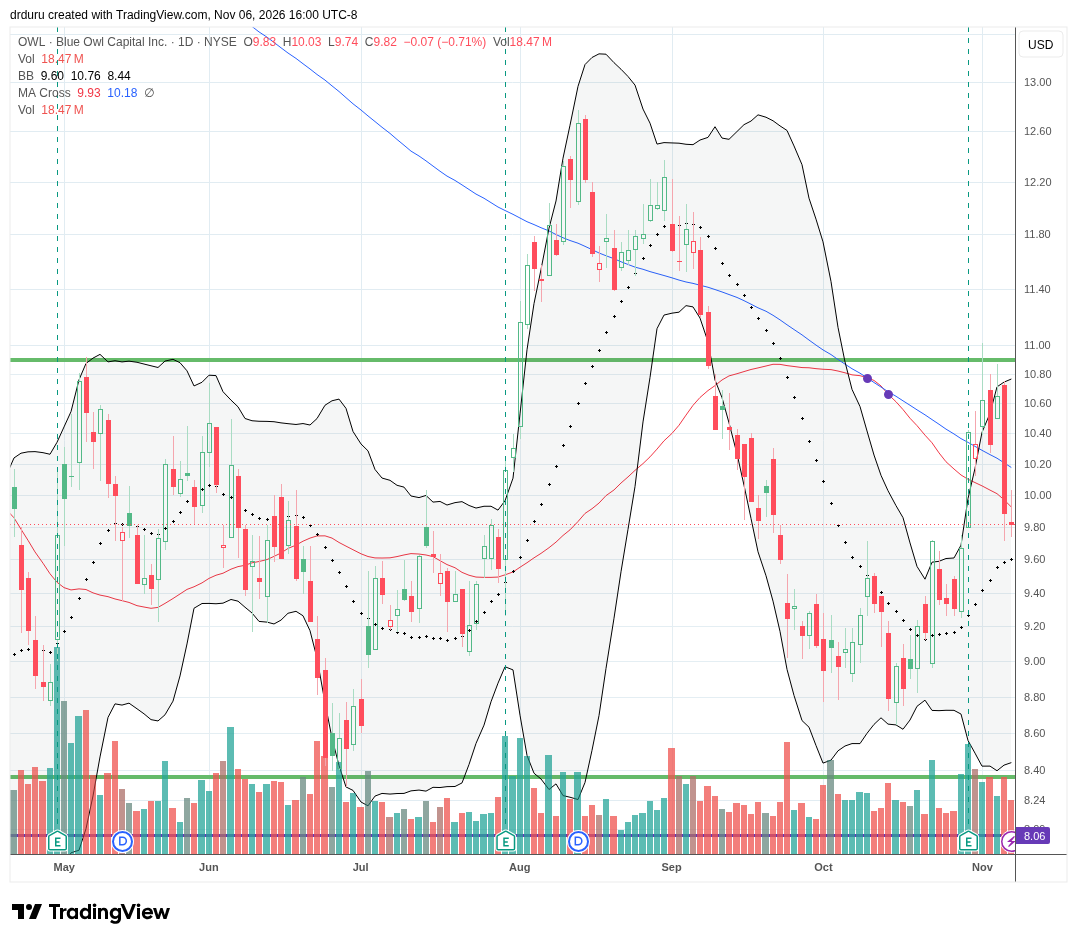
Blue Owl Capital Inc. (OWL)
Description: Blue Owl Capital Inc. is an alternative asset management company providing investment strategies across credit, real assets and strategic capital.
Technical Status: Blue Owl Capital Inc. (OWL) failed to maintain its 50DMA and 200DMA post-earnings breakout, suffering from a 7% drop.
Trade Commentary: OWL’s recent rebound surprised me, but I assume relief in the bond market helped most rate-sensitive stocks like OWL. That momentum looks over with the failure at the May high. I may return to the stock if it falls to recent support around $8.80. Otherwise, I am quite content with my earlier risk management decision to put in a trailing stop that helped me preserve profits.
Block, Inc. (XYZ)
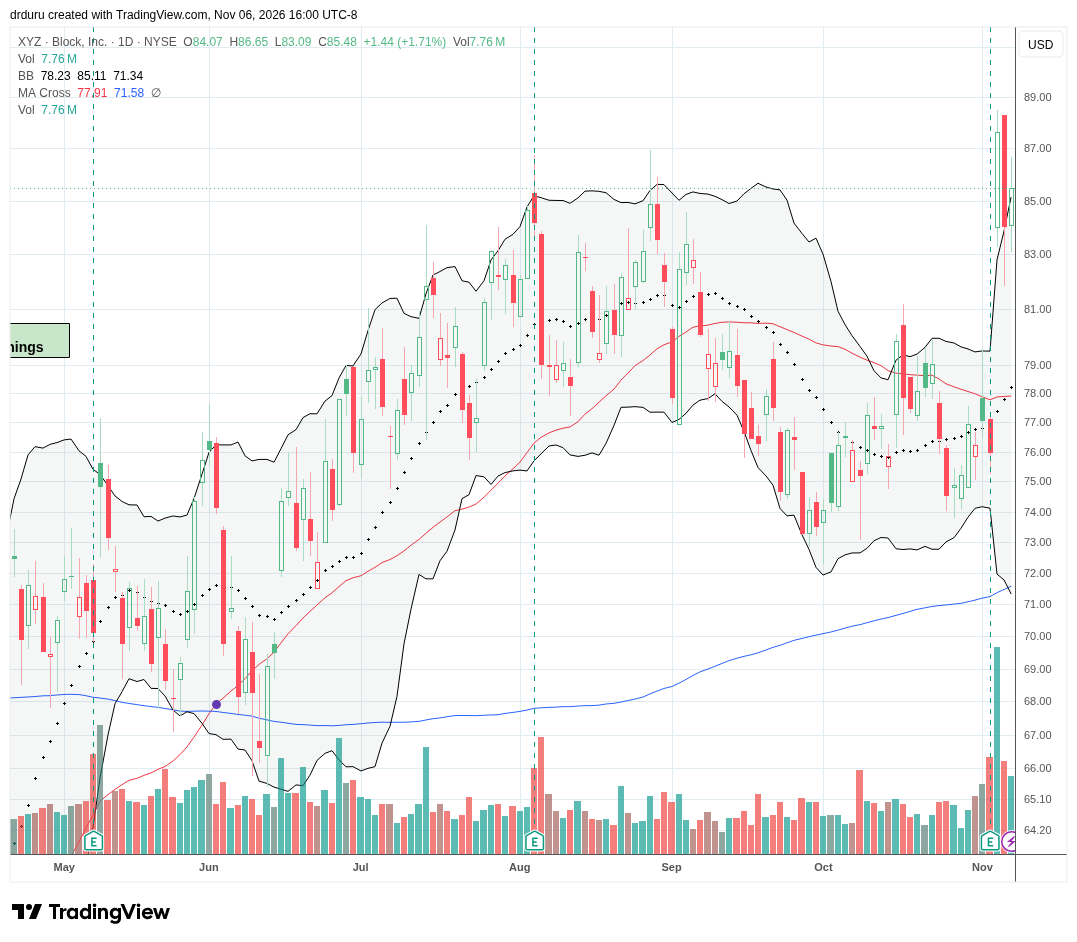
Description: Block, Inc. develops financial technology products and payment services through businesses including Square and Cash App.
Technical Status: Block, Inc. (XYZ) jumped above its 50DMA post-earnings, surging by 15.3% and setting a high for the year before Thursday’s sell-off delivered a sharp reversal.
Trade Commentary: Block published its third-quarter shareholder letter on November 3, reporting gross profit growth of 22% year over year. The company also reported a 92% increase in adjusted operating income and a 109% increase in adjusted diluted earnings per share. Block raised its full-year guidance for these measures and discussed the availability of its Squaremates automation tools to Square sellers in the United States. XYZ leaves a lot of egg on my face for my earlier claims that the company’s AI-related layoffs masks deeper problems at the company. Last week’s post-earnings breakout leaves such bearish interpretations behind.
Financial Select Sector SPDR Fund (XLF)
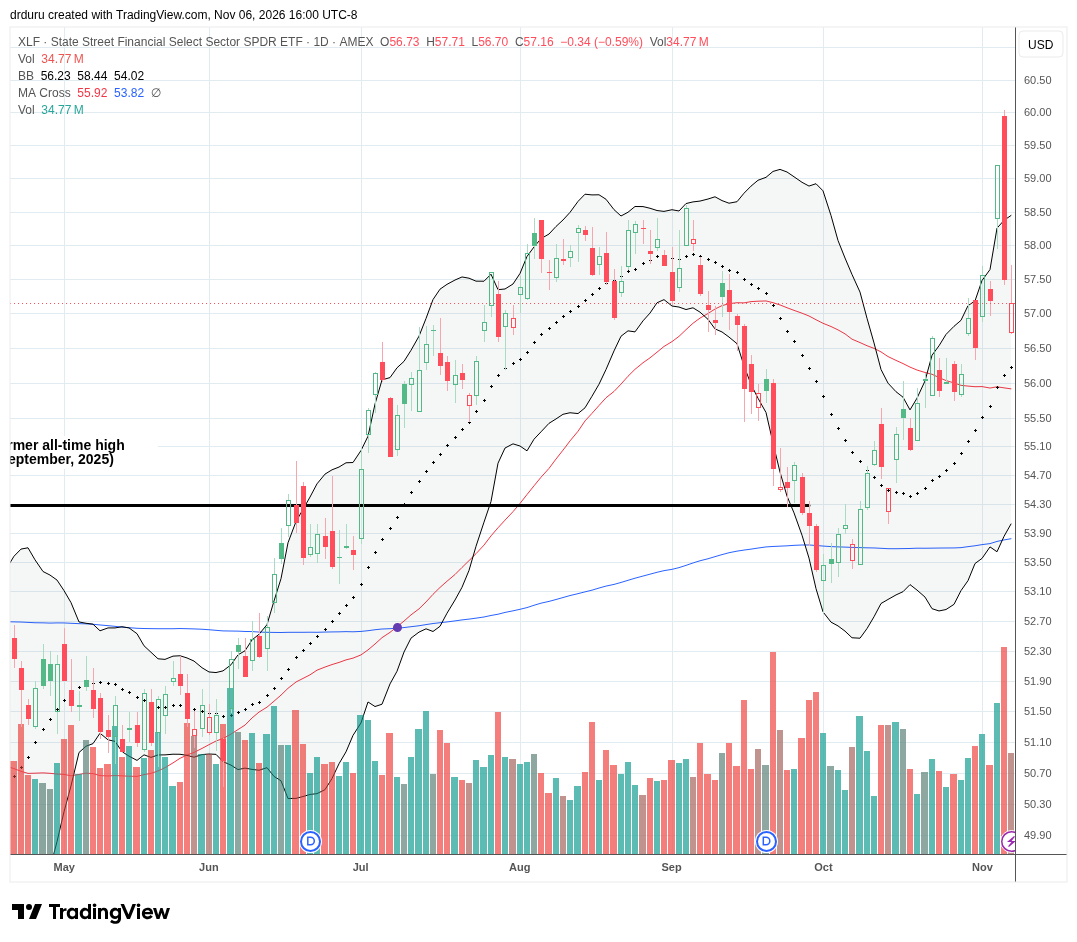
Description: The Financial Select Sector SPDR Fund is an exchange-traded fund tracking an index of financial sector companies in the S&P 500.
Technical Status: Financial Select Sector SPDR Fund (XLF) set a new all time high before suddenly reversing its uptrend with a bearish engulfing topping pattern.
Trade Commentary: Thursday’s 2.9% loss generated a bearish engulfing topping pattern that brought a swift end to XLF’s breakout to an all-time high. XLF was also a contributor to October’s near steady rise in market breadth. A pullback in financials would add a bearish taint to market action. A 50DMA breakdown looms.
Consumer Digital Platforms
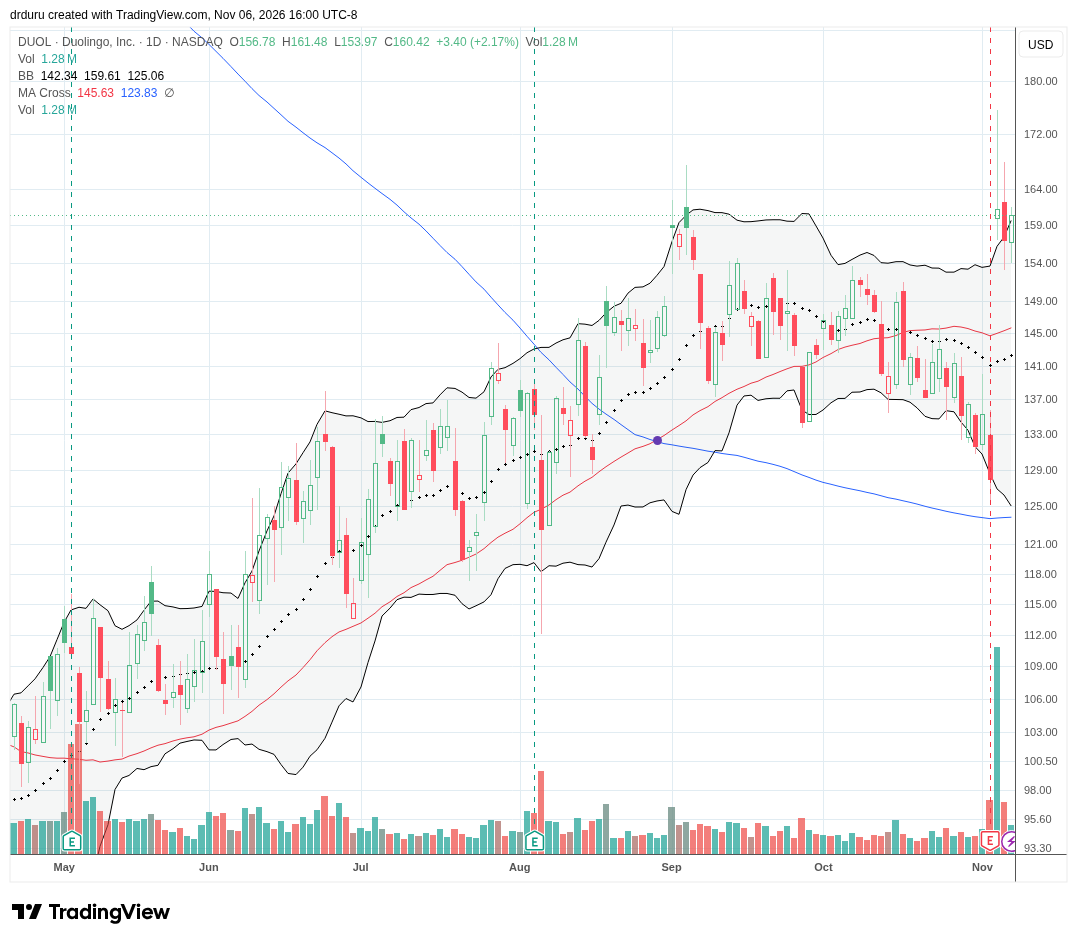
Duolingo, Inc. (DUOL)
Description: Duolingo, Inc. operates a digital education platform offering language learning and other educational courses through mobile and web applications.
Technical Status: Duolingo, Inc. (DUOL) jumped 26% post-earnings and broke out above its 50DMA. The stock has stalled right at the previous high.
Trade Commentary: Duolingo announced third-quarter financial results on November 3. The company reported that daily active users increased 29% from the prior-year quarter. DUOL has a heavy short interest at 17.4% of float, so it can experience large moves anytime. Earnings provided the catalyst this time around.
DraftKings Inc. (DKNG)
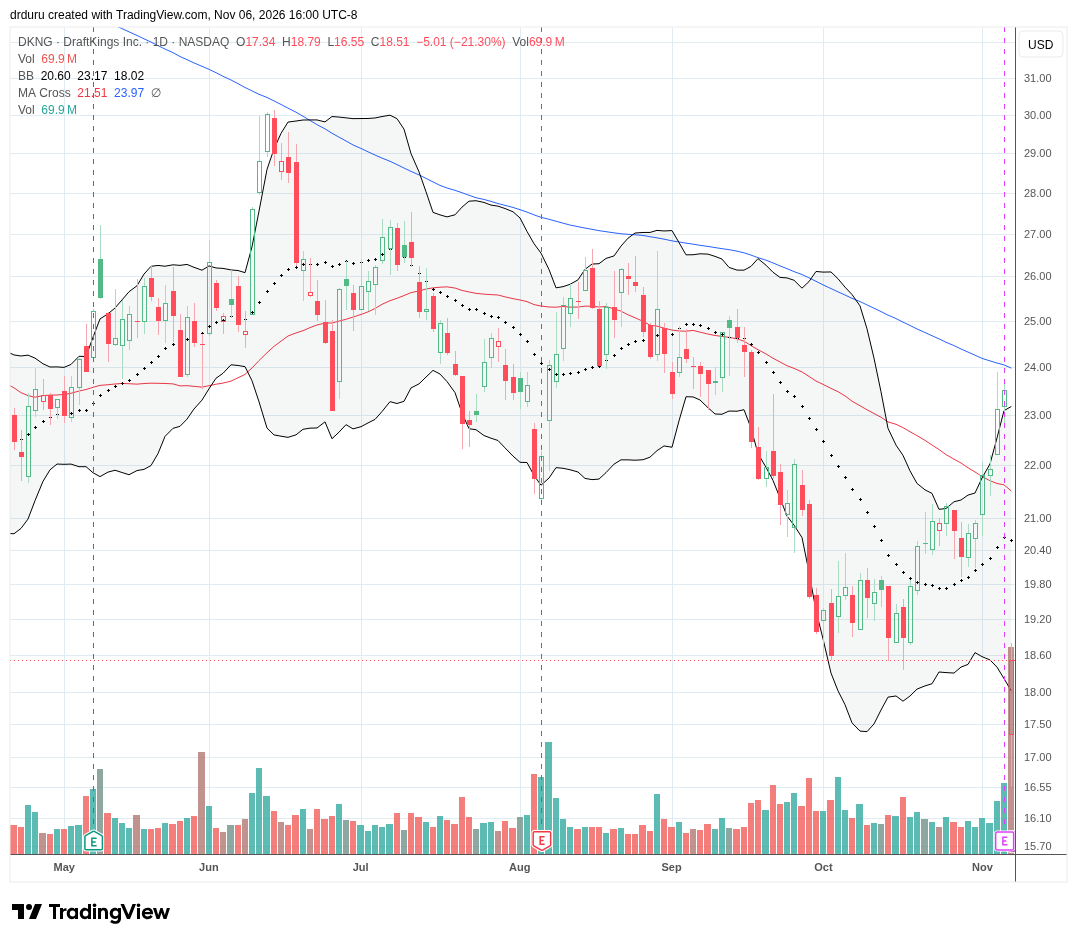
Description: DraftKings Inc. operates digital sports betting, online gaming, daily fantasy sports and prediction market products.
Technical Status: DraftKings Inc. (DKNG) broke out above its 50DMA, looking to test 200DMA resistance, but instead plummeted 21.3% post-earnings.
Trade Commentary: DraftKings reported third-quarter financial results on November 5, including revenue of $1.329 billion, an increase of 16% year over year. The company reported approximately 4.1 million monthly unique payers during the quarter, up 13% from a year earlier. DraftKings also introduced fiscal 2027 revenue guidance of $7.35 billion to $7.75 billion. DKNG has suffered quite a reversal in fortunes, sped along by the prediction markets. The near 2-1/2 year low put an exclamation mark on the stock’s slow topping pattern that stretched from 2024 to 2025. I have no interest in buying DKNG.
Retail and Restaurants
Costco Wholesale Corporation (COST)
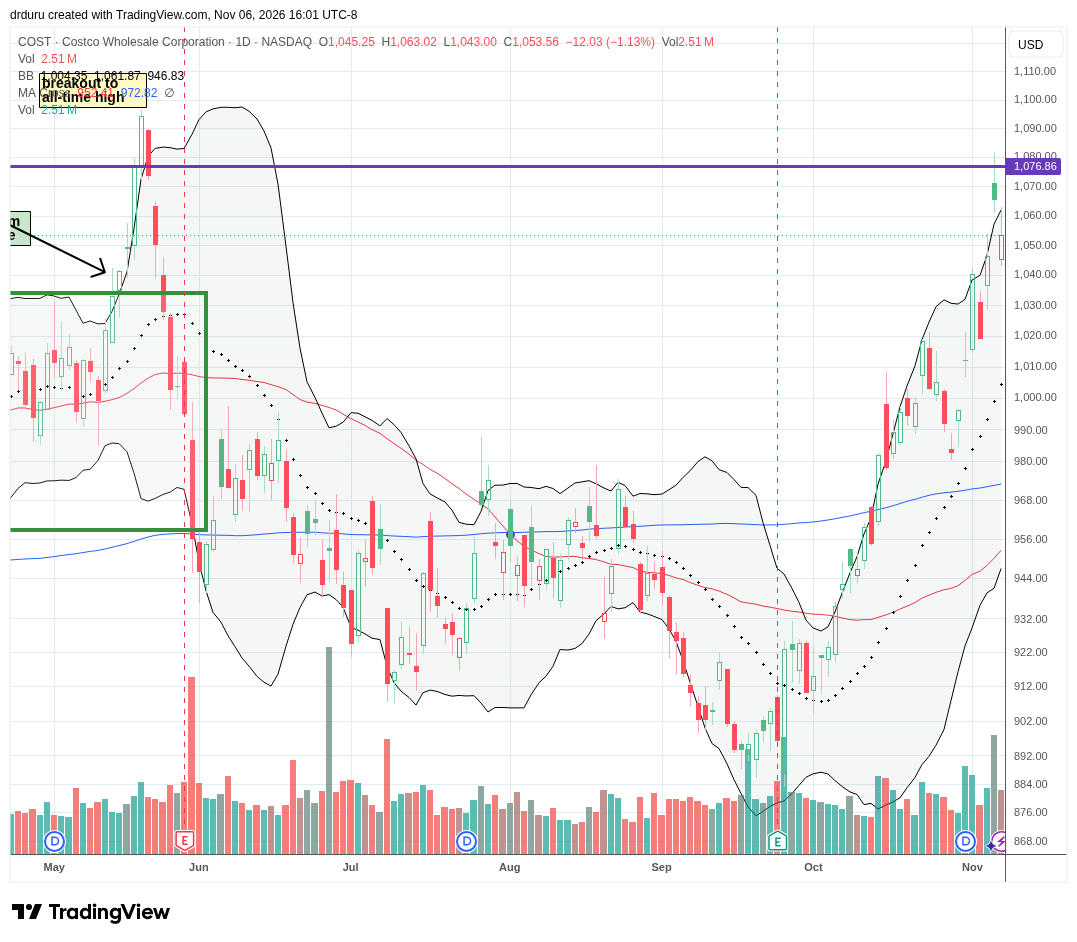
Description: Costco Wholesale Corporation operates membership-based warehouse retail stores and related e-commerce businesses.
Technical Status: Costco Wholesale Corporation (COST) continued its post-earnings momentum as it increased alongside its upper Bollinger Band, approaching its May high.
Trade Commentary: Costco reported October sales results on November 4, covering the four-week retail period ended November 1. Net sales increased 12.6% year over year to $24.50 billion. Total comparable sales increased 11.1%, while comparable sales excluding changes in gasoline prices and foreign exchange increased 7.3%. Digitally enabled sales increased 22.5% as reported. COST joined October’s rally away from high tech and provided validation to my decision to keep holding the stock. However, Friday’s pullback left behind a kind of evening star top right under the all-time high. I went into risk management mode and took an early exit on the stock. I will look to return on the next COST pullback. COST’s astronomical valuation prevents me from chasing the stock higher.
Dollar Tree, Inc. (DLTR)
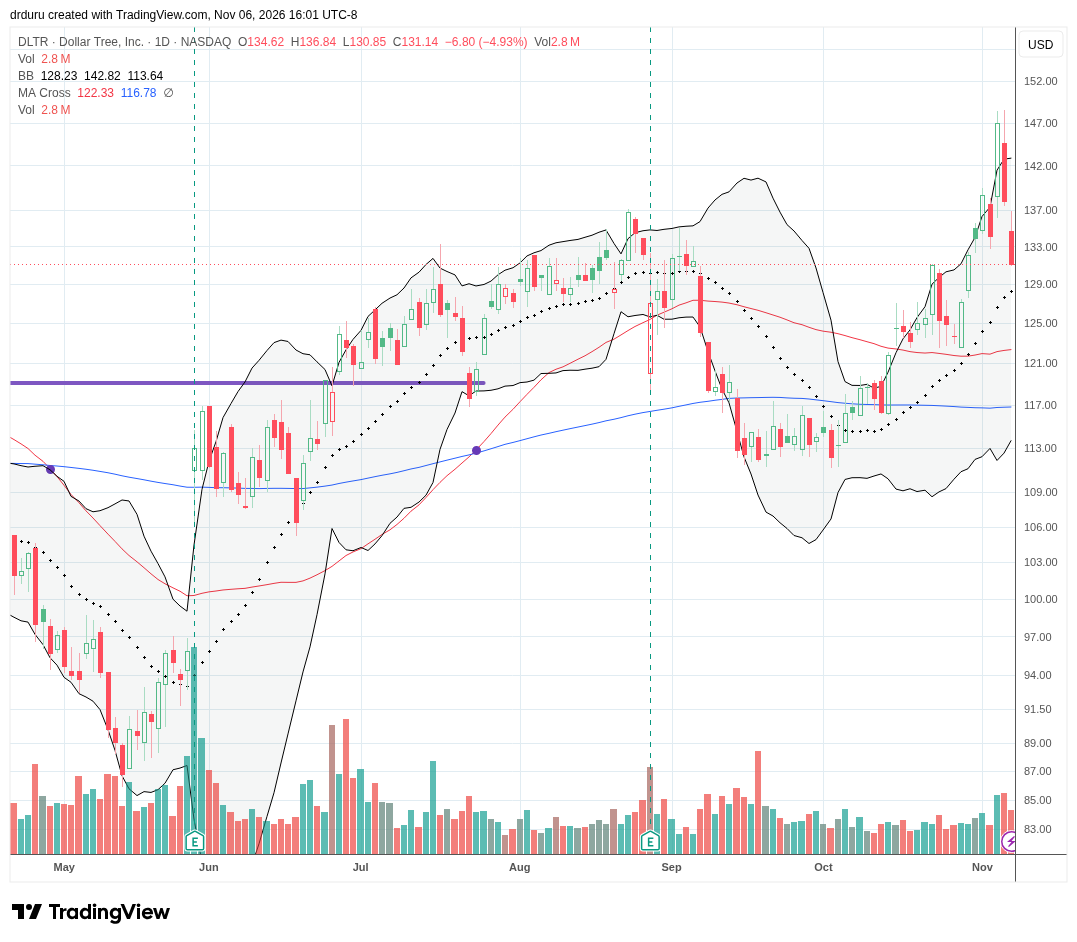
Description: Dollar Tree, Inc. operates discount retail stores selling household goods, food, seasonal merchandise and everyday consumer products.
Technical Status: Dollar Tree, Inc. (DLTR) reached a new high for the year, only to reverse sharply the next day. Friday’s selling confirmed a type of blow-off top.
Trade Commentary: I found no company-specific news to explain DLTR’s initial surge last week. However, DLTR seemed to follow the path of other stocks, like those in XLF, which suffered a conclusive end to the continuation rally from October’s rotation out of tech. I hope to consider DLTR for a buy on a drop to 50DMA support.
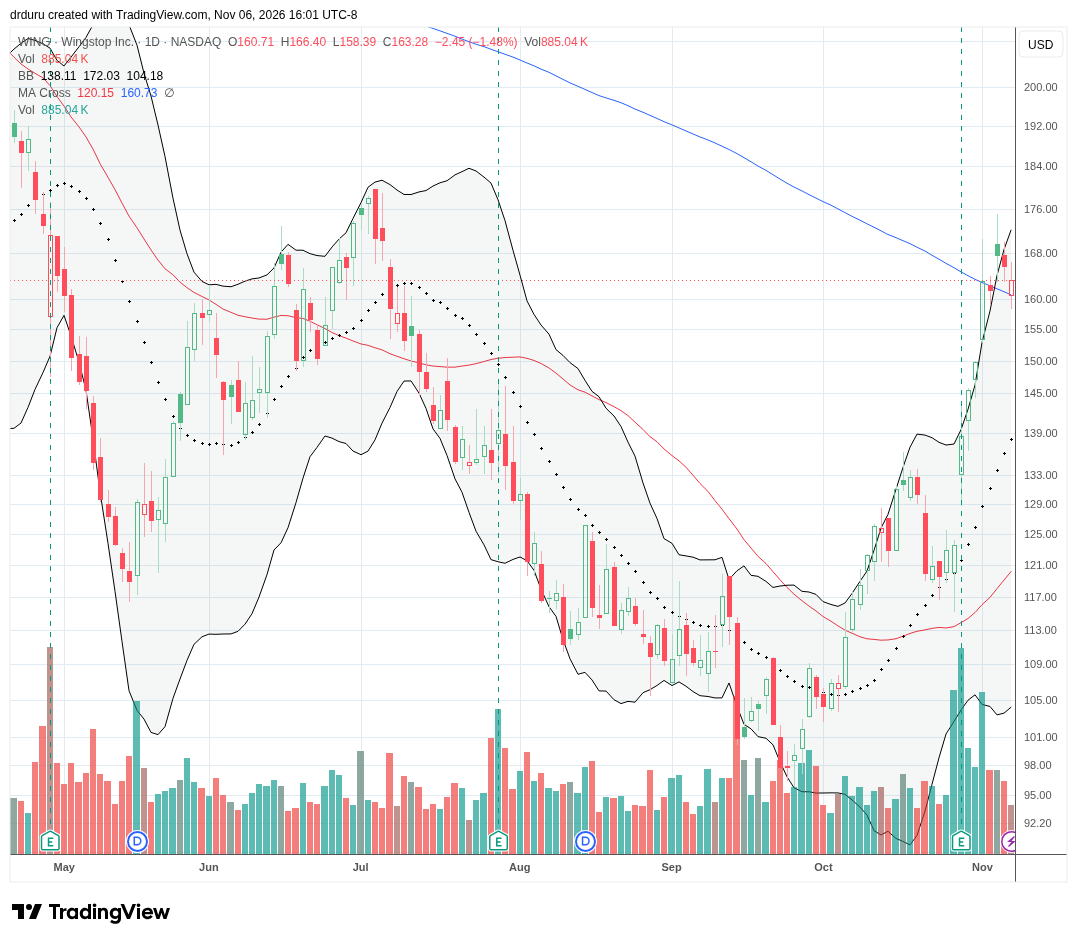
Wingstop Inc. (WING)
Description: Wingstop Inc. operates and franchises quick-service restaurants specializing in chicken wings and related menu items.
Technical Status: Wingstop Inc. (WING) leapt off its 20DMA for 12.1% post-earnings gain. The momentum continued with a 200DMA breakout.
Trade Commentary: At one point last week, WING was up over 70% since the start of October. The stock was a major beneficiary of the bullish divergence in market breadth, yet I failed to ride the stock all the way up because I wanted to lock in profits ahead of earnings. If the stock hurdles its July high, then it will confirm a bearish to bullish reversal is underway.
Healthcare Services
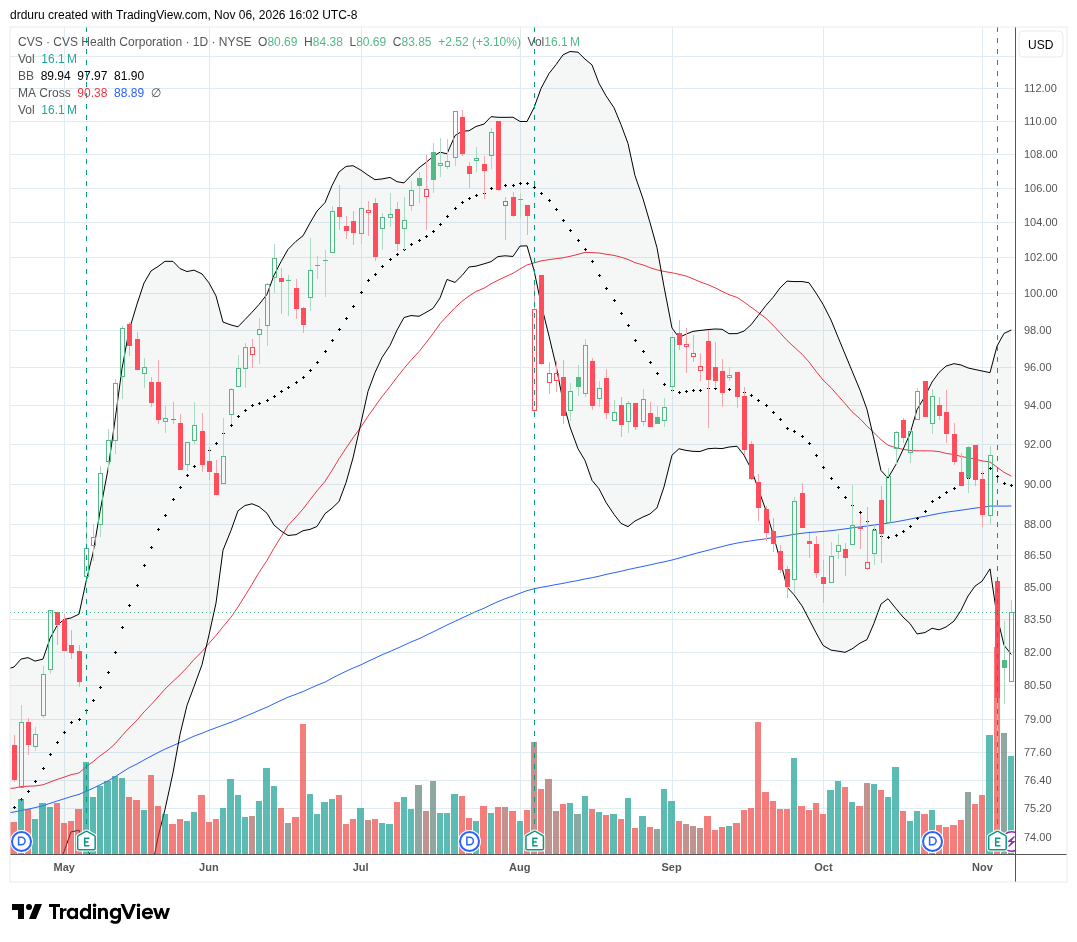
CVS Health Corporation (CVS)
Description: CVS Health Corporation operates health insurance, pharmacy benefit management, retail pharmacy and healthcare service businesses.
Technical Status: CVS Health Corporation (CVS) broke down below both its 50DMA and 200DMA, and then plummeted 12.5% post-earnings.
Trade Commentary: CVS Health reported third-quarter financial results on November 4, including revenue of $108.4 billion, an increase of 5.4% year over year. Adjusted earnings per share were $2.09, compared with $1.60 in the prior-year period. The company increased its full-year 2026 adjusted earnings-per-share guidance to at least $8.20 and raised its operating cash flow guidance to at least $15.5 billion. A rotation toward “defensive’ healthcare did not help CVS. The company’s plans to split out the pharmacy business appeared to concern investors. Now CVS trades well below its 200DMA and in bearish territory.
Agricultural Processing and Trading
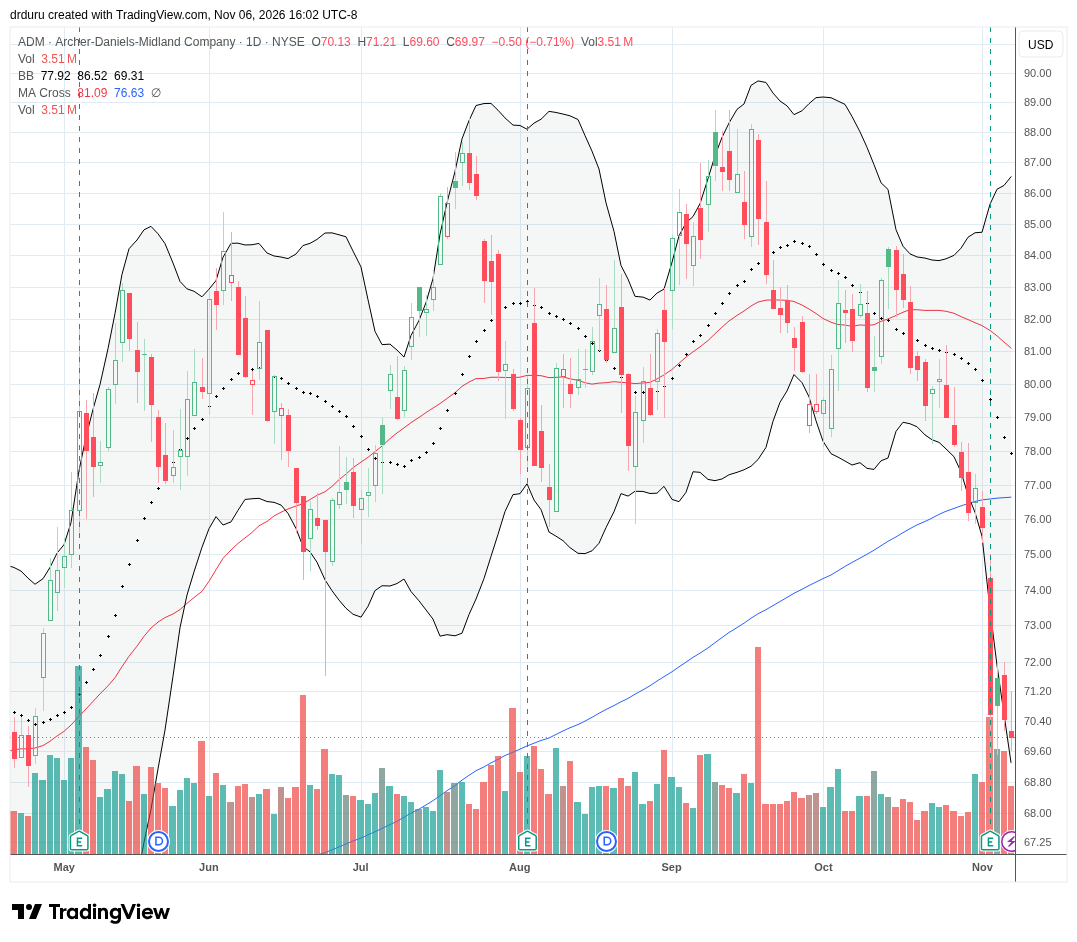
Archer-Daniels-Midland Company (ADM)
Description: Archer-Daniels-Midland Company processes agricultural commodities and supplies ingredients, nutrition products and agricultural trading services.
Technical Status: Archer-Daniels-Midland Company (ADM) broke down below its 200DMA and suffered a 6.8% post-earnings drop almost directly afterwards, returning to levels seen early this year.
Trade Commentary: ADM reported third-quarter financial results on November 3, including GAAP diluted earnings per share of $1.70 and adjusted earnings per share of $1.77. Net earnings totaled $821 million. The company raised its full-year 2026 adjusted earnings-per-share guidance to a range of $5.50 to $5.80, compared with its previous range of $5.15 to $5.60. In January I talked about how content I was to continue holding ADM. The stock gave me so little trouble that I completely missed its topping action ahead of a 200DMA breakdown. The post-earnings plunge convinced me to get out and preserve my remaining profits. ADM was a dividend play, so I was quite reluctant to sell it off.
Consumer Lawn and Garden Products
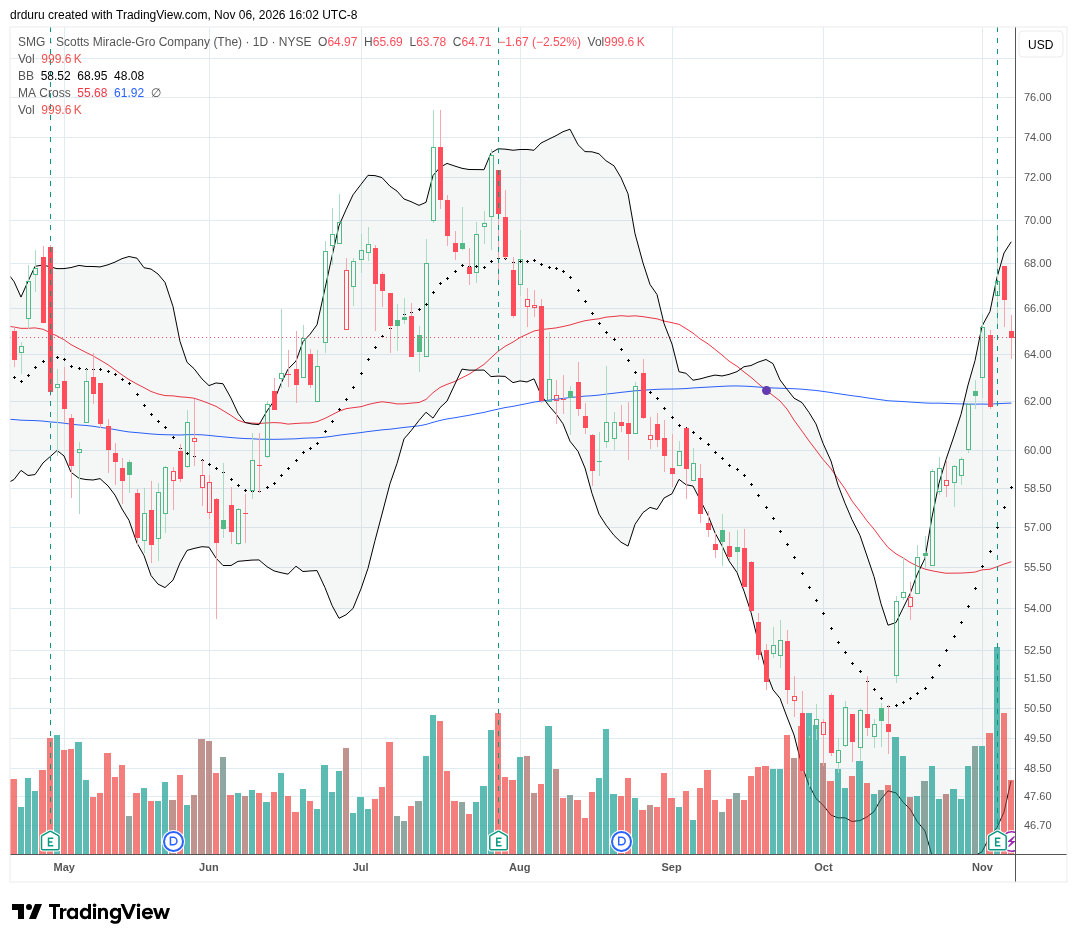
The Scotts Miracle-Gro Company (SMG)
Description: The Scotts Miracle-Gro Company manufactures and markets branded lawn care, gardening and pest control products.
Technical Status: The Scotts Miracle-Gro Company (SMG) broke out above its 50DMA and continued to rise, breaking out above its 200DMA as well and benefiting from an 8.7% post-earnings gains.
Trade Commentary: ScottsMiracle-Gro reported fiscal 2026 fourth-quarter and full-year results on November 4. Full-year net sales increased 1% to $3.29 billion, while GAAP gross margin was 32.3%. Adjusted diluted earnings per share from continuing operations were $4.48. The company issued fiscal 2027 adjusted earnings-per-share guidance of $4.70 to $4.90. The stock’s post-earnings pop further confirmed a 200DMA breakout. Still, I am not interested in buying back into SMG until it can hurdle the last peak around $75.
Specialty Chemicals
Innospec Inc. (IOSP)
Description: Innospec Inc. manufactures specialty chemicals for fuel additives, performance chemicals and oilfield services markets.
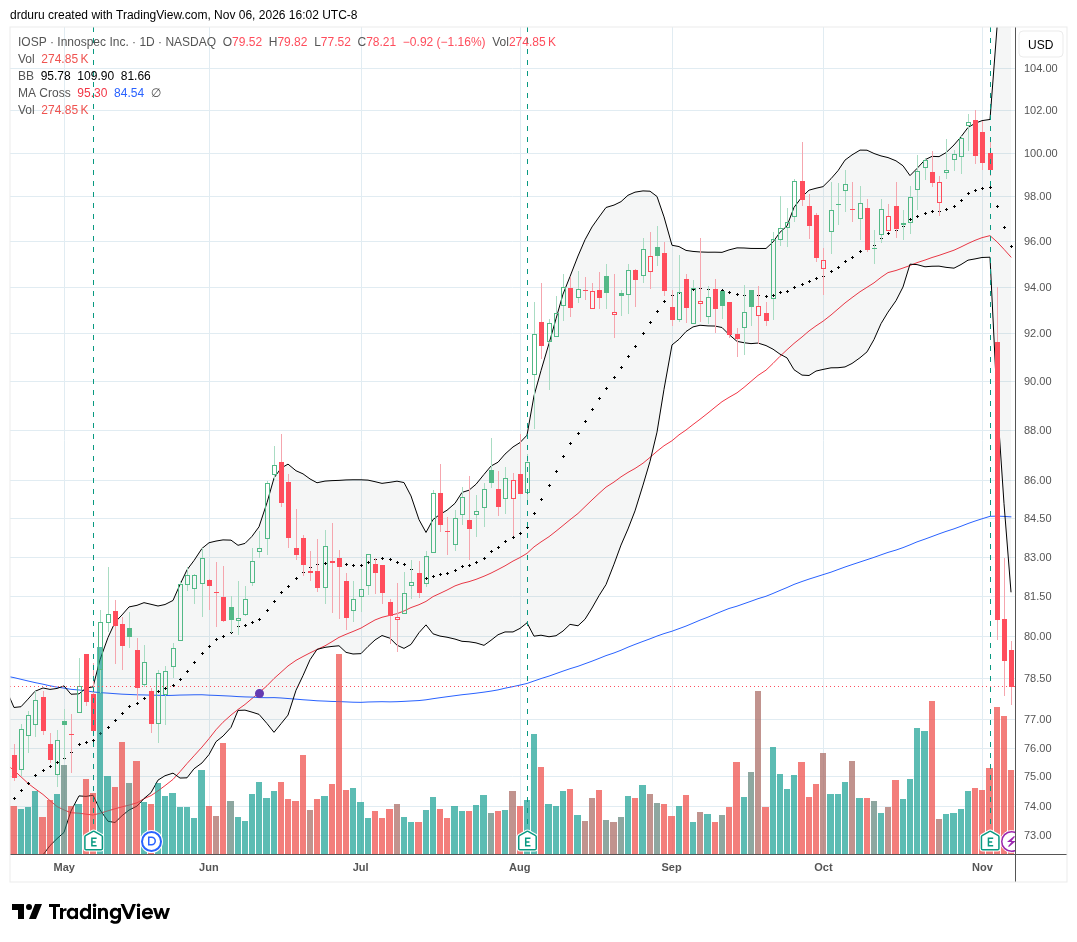
Technical Status: Innospec Inc. (IOSP) suffered a swift 200DMA breakdown after an 18.2% post-earnings plunge.
Trade Commentary: Innospec reported third-quarter financial results on November 3, with revenue of $473.6 million, an increase of 7% year over year. GAAP diluted earnings per share were $1.29, compared with $0.52 in the prior-year quarter. The company’s results could not save it from a major breakdown. I am not interested in buying this stock given its nasty 200DMA breakdown and continued selling. I included the stock here as a stark reminder of how abruptly and fast a strong uptrend can come to an end. Ever since April, the 50DMA and even often the 20DMA held as reliable support. No longer!
Footnotes
Subscribe for free to get email notifications of future posts!
“Above the 50” (AT50) uses the percentage of stocks trading above their respective 50-day moving averages (DMAs) to measure breadth in the stock market. Breadth defines the distribution of participation in a rally or sell-off. As a result, AT50 identifies extremes in market sentiment that are likely to reverse. Above the 50 is my alternative name for “MMFI” which is a symbol TradingView.com and other chart vendors use for this breadth indicator. Learn more about AT50 on my Market Breadth Resource Page. AT200, or MMTH, measures the percentage of stocks trading above their respective 200DMAs.
Active AT50 (MMFI) periods: Day #326 over 20%, Day #14 over 30%, Day #8 over 40% (overperiod), Day #2 under 50% (underperiod), Day #59 under 60%, Day #299 under 70%
Source for charts unless otherwise noted: TradingView.com
Full disclosure: long SPY, long IWM call options, short NVDA put, long DRAM, long ANET, long PLTR calendar call spread, long FSLR, long MTZ
FOLLOW Dr. Duru’s commentary on financial markets via StockTwits, BlueSky, and even Instagram!
*Charting notes: Stock prices are not adjusted for dividends. Candlestick charts use hollow bodies: open candles indicate a close higher than the open, filled candles indicate an open higher than the close.
* Blog notes: I use ChatGPT to help with editing and news discovery.