

Housing Market Intro and Summary
In my previous housing market update, I described the increasing pressure on the housing market. The housing data continued to worsen through mid-October, however housing-related stocks launched a strong rally. Rate relief from declining mortgage rates, accompanied by a rally in the bond market, provided a platform for a countertrend rally that had the appearance of the start of a period of seasonal strength. However, with rate hikes still to come from the Federal Reserve, the renewed investor enthusiasm in builder stocks could crumble as fast as it materialized.
Here is a summary for September’s housing market update:
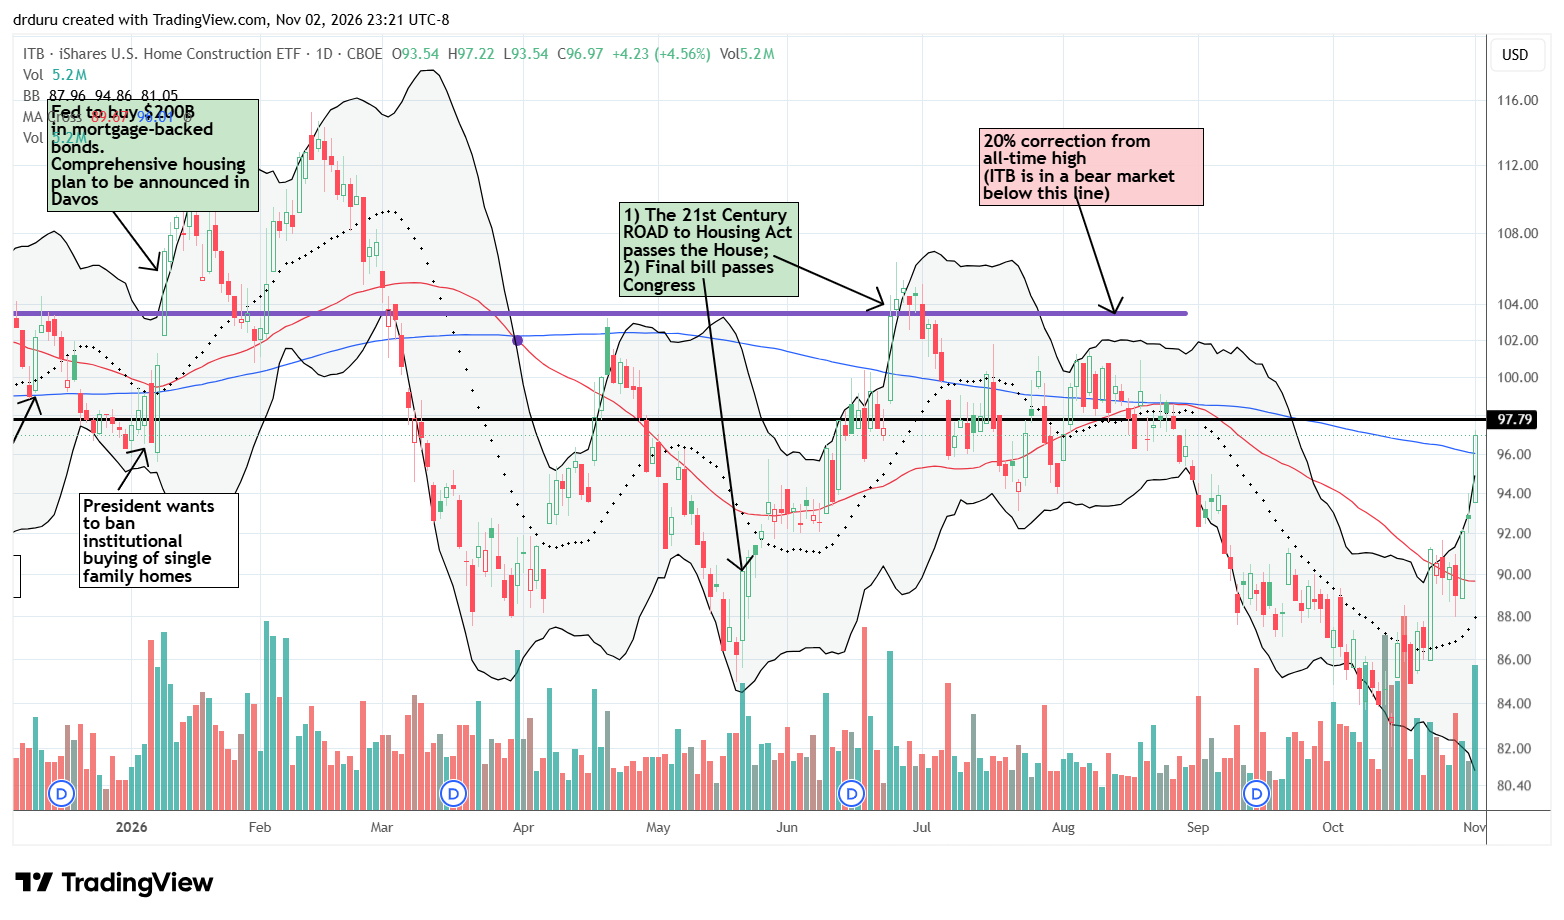
- Rate relief accompanied a 6.6% October gain in the iShares U.S. Home Construction ETF (ITB), while the S&P 500 fell 0.9%.
- ITB advanced another 3.2% to start November, but the ETF remained under pressure from its longer-term bear-market trend.
- Homebuilder confidence fell to 29 in October, a reported 14-year low, while the share of builders cutting prices climbed to 43%.
- Year-over-year, September single-family housing starts increased 2.6%, but new-home sales fell 5.3%, and existing-home sales decline 2.2%
- California’s existing single-family home sales fell 3.4% in September, while the statewide median price increased 1.7% year over year.
- Mortgage rates peaked in early October and provided a glimmer of hope for near-term housing activity and sentiment.
- The NAHB made a case for a change in immigration policy as current enforcement takes a toll on the housing construction labor force.
Housing Stocks
Just when I thought the seasonal trade on home builders had come to an end, the iShares U.S. Construction ETF (ITB) started November in a rare display of strength. ITB’s 6.6% gain in the month of October even outpaced the S&P 500’s 0.9% loss. The ETF of home builders and other housing construction stocks also started November on a strong note with a 3.2% surge, well ahead of the S&P 500’s 0.5% gain. I see ITB benefiting from a rotation away from a topping AI trade and into non-tech, non-AI-related stocks. Still, ITB has a long way to go before it repairs the damage from the last two years or so. For example, ITB remains stuck in a bear market (the conventional definition is 20% from the all-time high, marked by the purple horizontal line below).
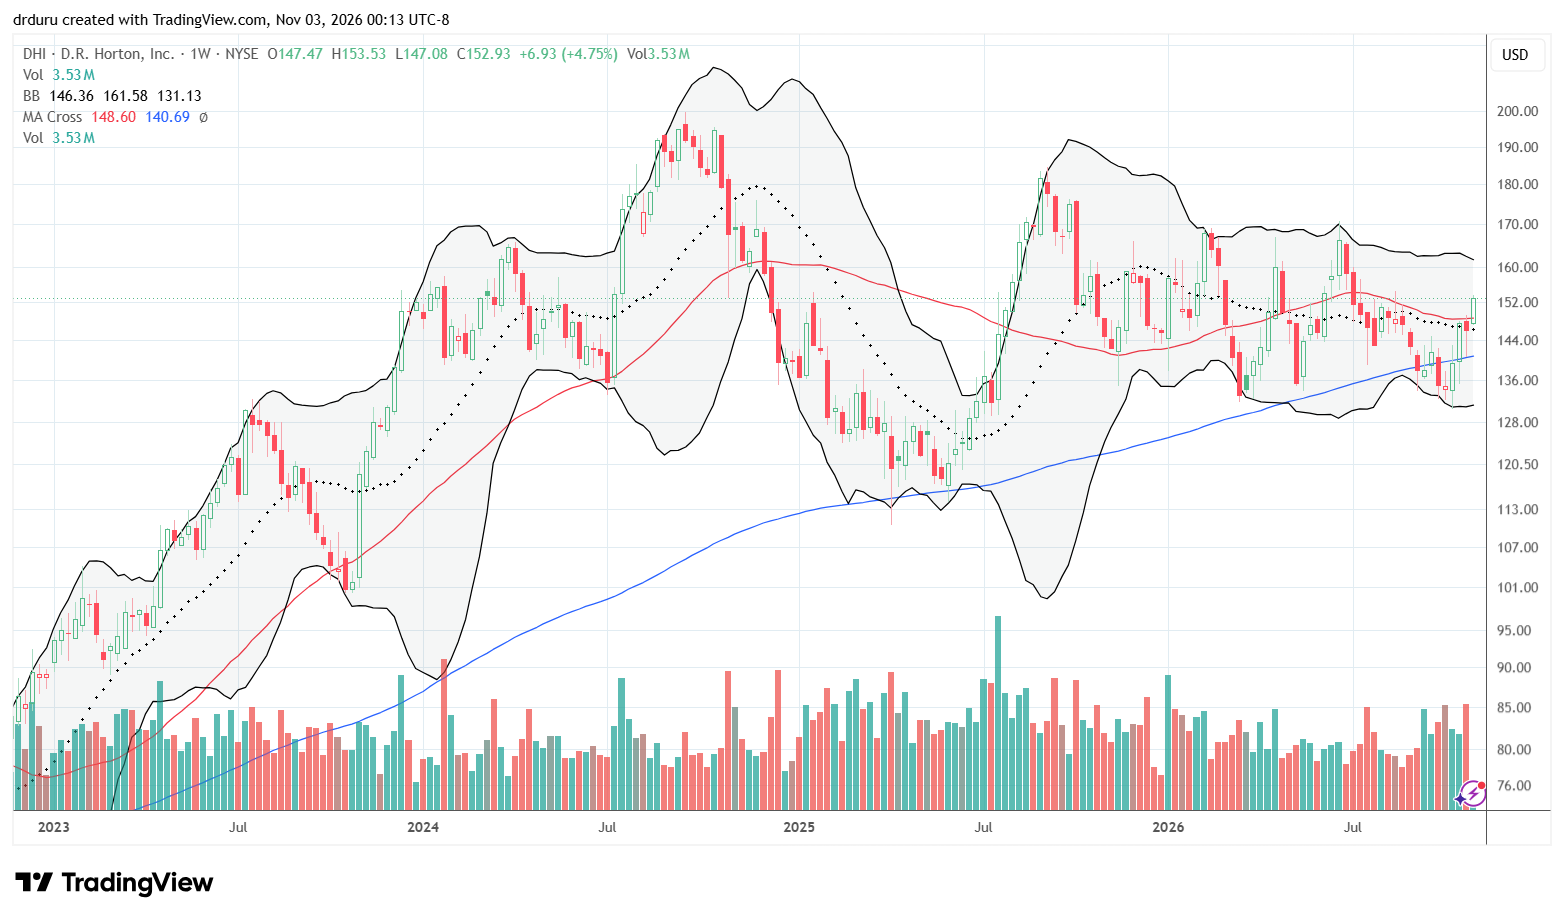
D.R. Horton (DHI) provides an example of both the encouraging move in home builder stocks alongside a reality check. The company reported earnings last week, and the market responded by delivering a 2.5% gain and strong follow-through including a 4.8% gain to start the month of November. However, while DHI closed above its 200-day moving average (DMA), the stock is still stuck in an extended trading range. The weekly chart below shows how DHI has gone nowhere since 2024. A downtrend remains in place from the all-time high in 2024.
I wrote four months ago that non-seasonal factors in the housing market are dominating the structural requirements for my annual seasonal trade on home builders. As a result I suspended the trade going into the 2026/2027 season even as I held on to a core ITB position while slowly adding to shares in individual builders LGI Homes (LGI), D.R. Horton (DHI), and Century Communities (CCS). I wrote about my buying rule and rationale for CCS in “Buy and Wait on Century Communities.” I wrote about LGIH ahead of its Q2 earnings. Afterward, I decided to start buying the stock given its large potential upside in a better housing market.
I did not expect any of these trades to look good until interest rates started coming down. I expected interest rates to decline eventually, but I did not anticipate that decline while oil prices continued higher and financial markets were expecting more rate hikes.
Thus, while I am encouraged I am also very wary and bracing for the bear market in ITB to pressure ITB to reverse much of its progress from October.
Housing Data
Home Builder Confidence: The Housing Market Index – October, 2026
The increasing pressure in the housing market pushed down the National Association of Home Builders (NAHB)/Wells Fargo Housing Market Index (HMI) by 3 points to 29 in October, finally dropping below the pandemic trough and hitting a 14-year low. Sentiment remained below 40 for the 18th straight month. The NAHB lamented a familiar laundry list of issues for builders: elevated mortgage rates, labor shortages and rising material costs. Immigration enforcement’s impact on labor availability has become an increasing source of concern for the NAHB. Building from earlier research, the NAHB reported that “nationwide, more than one-third of builders reported immigration enforcement activity in their market areas during the past month, causing construction delays and discouraging legal workers from reporting to work.”
In my previous housing market update, I anticipated that the HMI would continue lower in coming months given the ongoing declines across all three components. This month’s synchronized decline continues the downward trend with no positive catalysts yet in sight. The current sales HMI component decreased two points to 33 (a 14-year low), while future sales expectations dropped five points to 32 (a 14-year low). Prospective buyer traffic plunged five points to 18 (still 5 percentage points above its pandemic low).
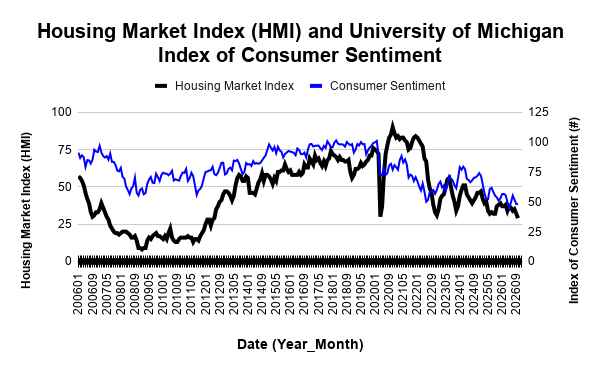
Source for data: NAHB and the University of Michigan
Both consumer and builder sentiment are in sync….downward. (You can also review an interactive version of HMI at the NAHB website).
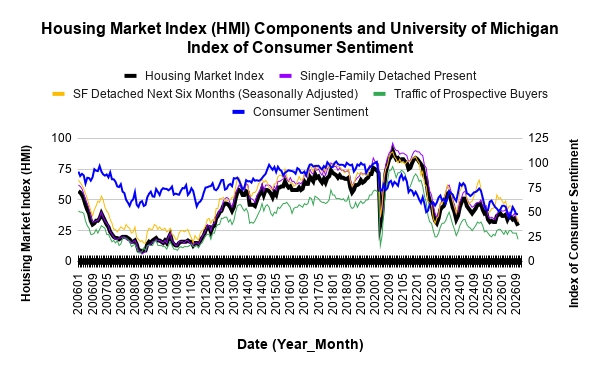
The share of builders cutting prices soared from 38% in September to 43% in October. The average price reduction remained at 6% for the seventh consecutive month. The use of sales incentives was 65% in October, up from 63% in August, marking the 19th straight month that at least 60% of builders used incentives. Pricing’s increasing pressure on builders helps explain October’s plunge in the HMI.
While HMI plunged, the Northeast managed to stand out as the one region of the four to actually benefit from an improvement in sentiment. The Northeast HMI increased 2 points to 37, rising from a 3-1/2 year low. The Midwest HMI dropped 5 points to 35. The South HMI dropped 2 points to a 14 1/2-year low. The West HMI collapsed from September’s standout to a 10-point plunge to 20. The West went from its highest level since March to its lowest level since December, 2011.
New Residential Construction (Single-Family Housing Starts) – September, 2026
Single-family housing starts fell closer to what has become the low of a multi-year range. September’s 859K in single-family starts represents a 4.6% month-over-month decrease but a 2.6% year-over-year increase, making the latest starts number the lowest in a year. The series of lower highs since 2021 still convinces me that starts will eventually break below the current 800K floor.
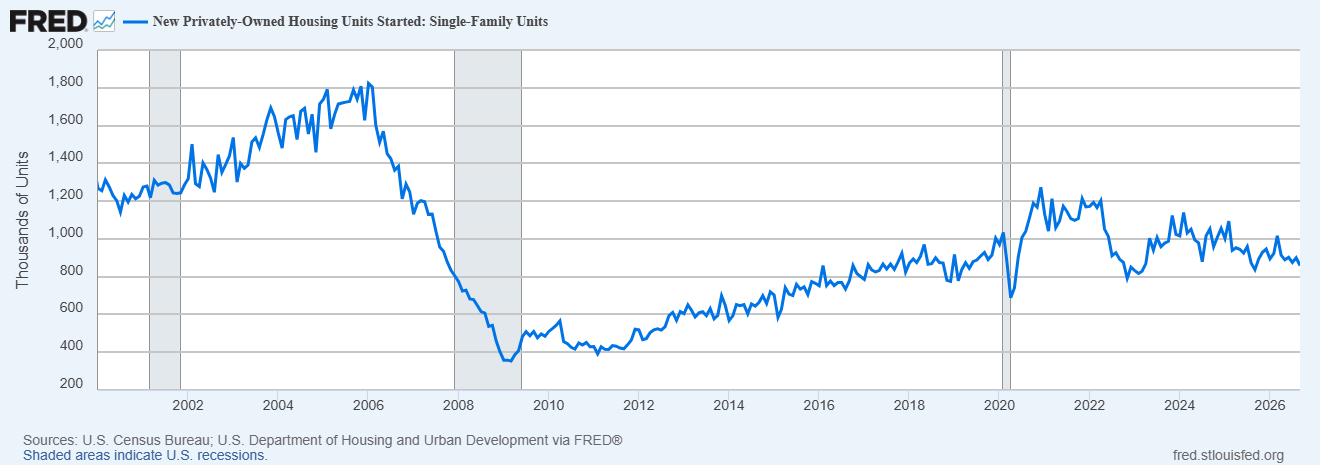
As builders decreased the pace of starts, permits remained around 3-year lows. Building permits (new privately-owned housing units authorized in permit-issuing places) have stalled out since June, 2025. Permits were 845K, a 4.0% month-over-month decrease from August and a 4.8% year-over-year decrease. The sluggish activity in permits suggests starts will remain rangebound for now.
Starts were mixed across regions. Month-over-month the changes were 4.3%, -13.7%, -3.3%, and -3.7% for the Northeast, Midwest, South, and West respectively. Year-over-year the changes were mixed at -7.5%, 2.6%, 8.8%, and -8.9% for the Northeast, Midwest, South, and West respectively.
New Residential Sales (Single-Family) – September, 2026
New home sales decreased in September. The NAHB lamented the impact of higher mortgage rates and “economic uncertainty.” Sales fell 0.6% from August’s sales of 680K to 676K in September. Year-over-year sales declined 5.3%. The sequential decrease in the market for new homes leaves sales hovering above the pandemic low and stuck in a tight range in place since 2021.
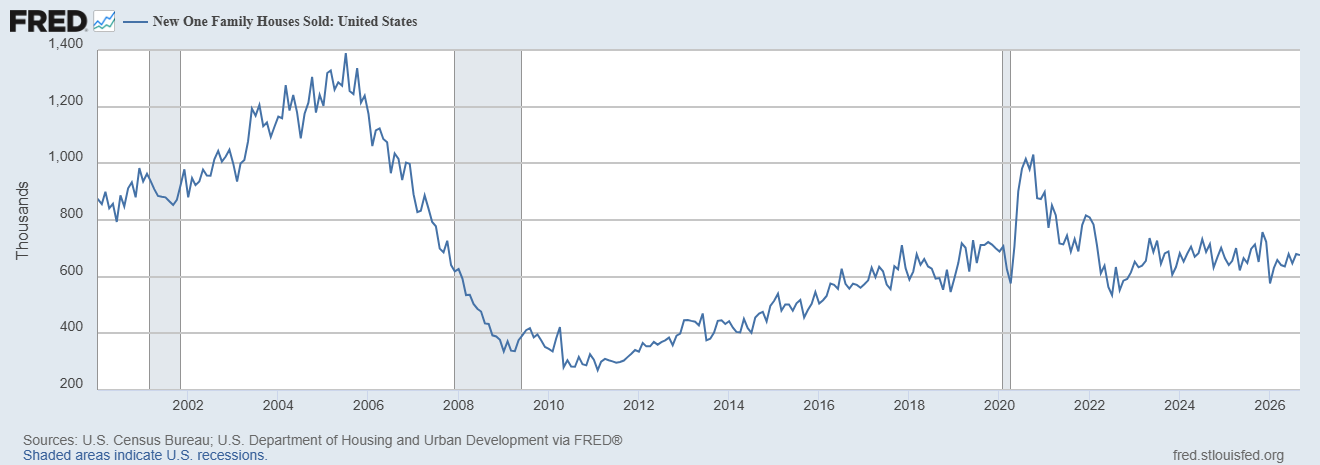
For September, the median price for new homes increased 3.9% sequentially and decreased 3.9% year-over-year to $400,400. As is often the case, the shift in prices coincided with a shift in the sales mix. A large year-over-year drop in share of homes priced at or above $600,000 drove much of the price decline. Sequentially, only one of the tiers declined and that drop was a single percentage point.
August’s inventory was 8.5 months of sales. September’s inventory decreased to 8.4 months of sales compared to 8.2 months a year ago. Absolute inventory decreased from August’s 481K to 476K and was down from 487K a year ago.
Only the Northeast avoided a year-over-year sales decline. The Northeast, Midwest, South, and the West changed sales +10.3%, -8.2%, -0.7%, -17.4% respectively year-over-year. Sequentially, the Northeast, Midwest, South, and the West changed +28.0%, -7.3%, -6.6%, +21.4% respectively.
Existing Home Sales – September, 2026
The National Association of Realtors (NAR) reported that existing home sales increased 1.5% month-over-month to 3.99M and decreased 2.2% year-over-year. While mortgage rates remained elevated in September, October’s steady decline suggests the next report on existing home sales could deliver more sequential gains.
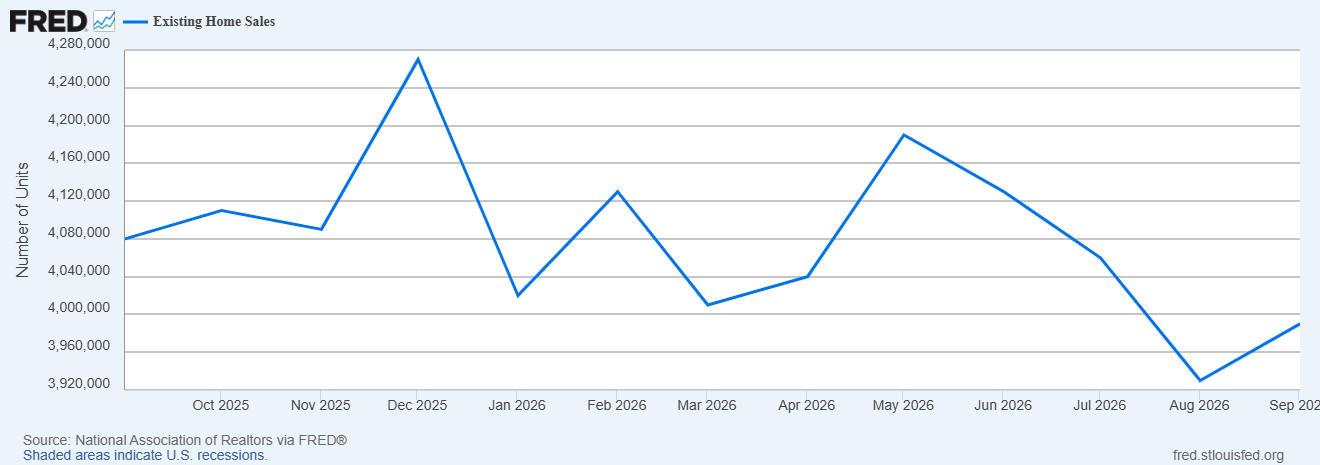
(For historical data from 1999 to 2014, click here. For historical data from 2014 to 2018, click here) Source for chart: National Association of Realtors, Existing Home Sales© [EXHOSLUSM495S], retrieved from FRED, Federal Reserve Bank of St. Louis, October 29, 2026
The Northeast, Midwest, and West were at sales levels at or below their pandemic troughs. The regional year-over-year changes were: Northeast -4.1%, Midwest -2.1%, South -0.5%, West -5.2%.

{Notably, condo and co-op sales are at an all-time low for this data series. These sales were a major drag on existing home sales with a 2.8% month-over-month decrease and 5.4% year-over-year drop, while the median price increased 1.2% year-over-year to $363,700.}
The NAR noted that August and September were the slowest months of the year, and they issued a plea to sellers to “be realistic about local market conditions, which could require price discounts and other incentives to attract buyers.” While the median price has declined for three straight months from June’s all-time high, the overall price trend remains up and to the right. The median sales price of an existing home was $417,500 in September, up 1.3% from one year ago ($412,300). September marked the 39th consecutive month of year-over-year price increases.
The NAR’s Housing Affordability Index seems to be realigning with reality. The index declined from 106.7 a year ago to 105.4. Only the West experienced an improvement in affordability. The year-over-year changes by region were: Northeast -4.5%, Midwest -3.1%, South -0.4%, West +1.0%. As a reminder, the Federal Reserve Bank of Atlanta’s Affordability Index is at its lowest level since the index started in 2005.
Total housing inventory in September was 1.60M units, up 1.9% from August and up 4.6% from September 2025. The increase in inventory in the face of a price uptrend suggests a change in sales mix toward more expensive existing homes is at work. The NAR reported a 4.8-month supply of unsold inventory, unchanged from 4.8 months last month and up from 4.5 months one year ago.
The REALTORS® Confidence Index showed a median time on market of 33 days in September, up from 31 days in August and unchanged from 33 days in September 2025.
The NAR also reported that first-time homebuyers represented 31% of sales (up from 30% in August and up from 30% one year ago).
Single-family existing home sales increased 2.0% month-over-month in September to a seasonally adjusted annual rate of 3.64M and decreased 1.9% year-over-year. The median price of a single-family home was $422,700, an increase of 1.2% from a year ago but a drop of 2.5% from August.
California Existing Single-Family Home Sales – September, 2026
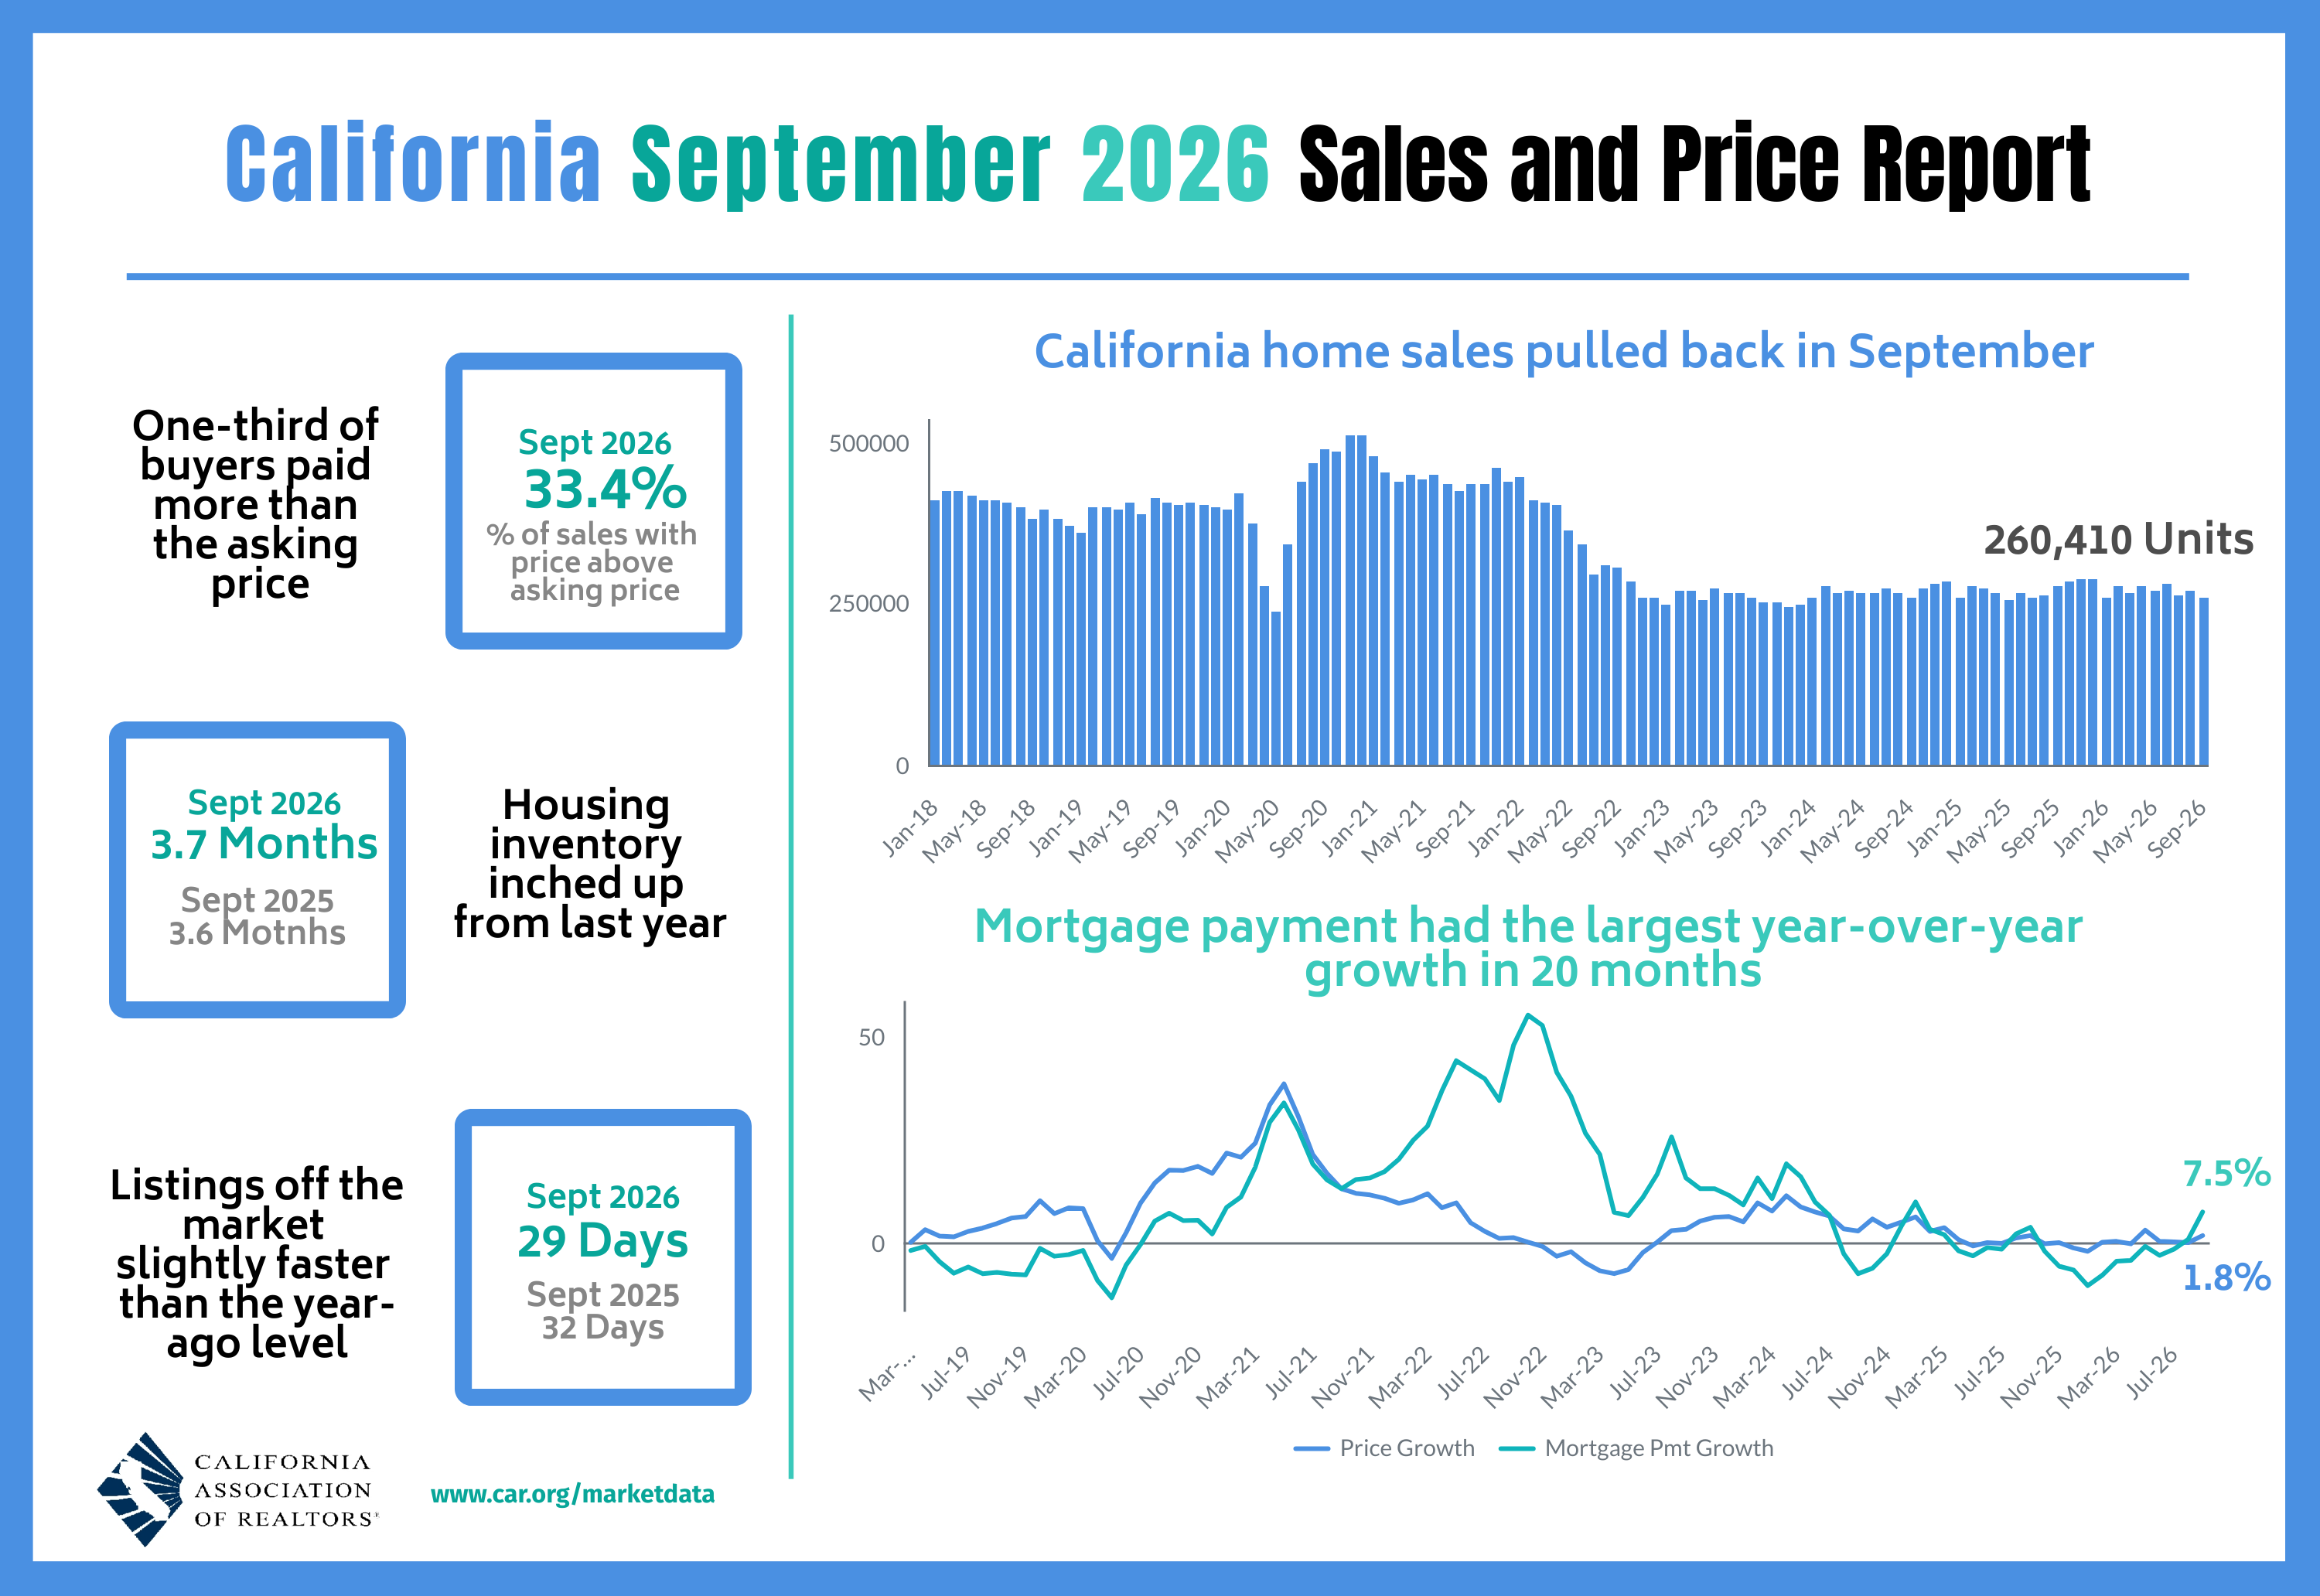
California existing home sales countered the national data and declined in September. The California Association of Realtors (C.A.R.) reported that existing single-family home sales decreased sequentially 3.4% in September to a seasonally adjusted annualized rate of 260,410, down 6.5% year-over-year. The C.A.R. attributed weaker housing demand to higher mortgage rates and persistent affordability challenges. Sales of homes valued above $1M increased from a 35.2% share in August to 35.9% in September, reversing three consecutive months of declines. The organization expects that elevated borrowing costs and affordability challenges could continue to weigh on homebuying activity through the final quarter of the year.
The median price declined 0.2% month-over-month to $899,720, but increased 1.7% year-over-year from $884,390 in September 2025, marking the fifth consecutive month of annual gains. An increased share of million-dollar home sales helped support the statewide median price despite softer housing demand. The median price per square foot was $434, up 1.4% from August and 1.6% from a year ago. The sales-price-to-list-price ratio was 98.8% in September, up from 98.2% a year ago. The C.A.R. expects that weaker demand and the typical seasonal slowdown could place additional downward pressure on home prices through the remainder of the year, although limited inventory may cushion the impact.
September’s unsold inventory index (UII), which measures the number of months needed to sell the supply of homes on the market at the current sales rate, remained unchanged from August at 3.7 months, compared with 3.6 months in September 2025. Total active listings increased 2.7% from August 2026 and edged up 0.5% year-over-year, marking the first annual increase in eight months. However, the C.A.R. attributed the increase primarily to declining sales and the seasonal slowdown in demand rather than a meaningful increase in new listings. The organization noted that the mortgage rate lock-in effect continued to discourage potential sellers from listing their properties. Still, the median time on market declined from 32 days a year ago to 29 days in September. Thus, while slower sales allowed inventory to improve modestly, persistent supply constraints continued to provide some support for home prices.
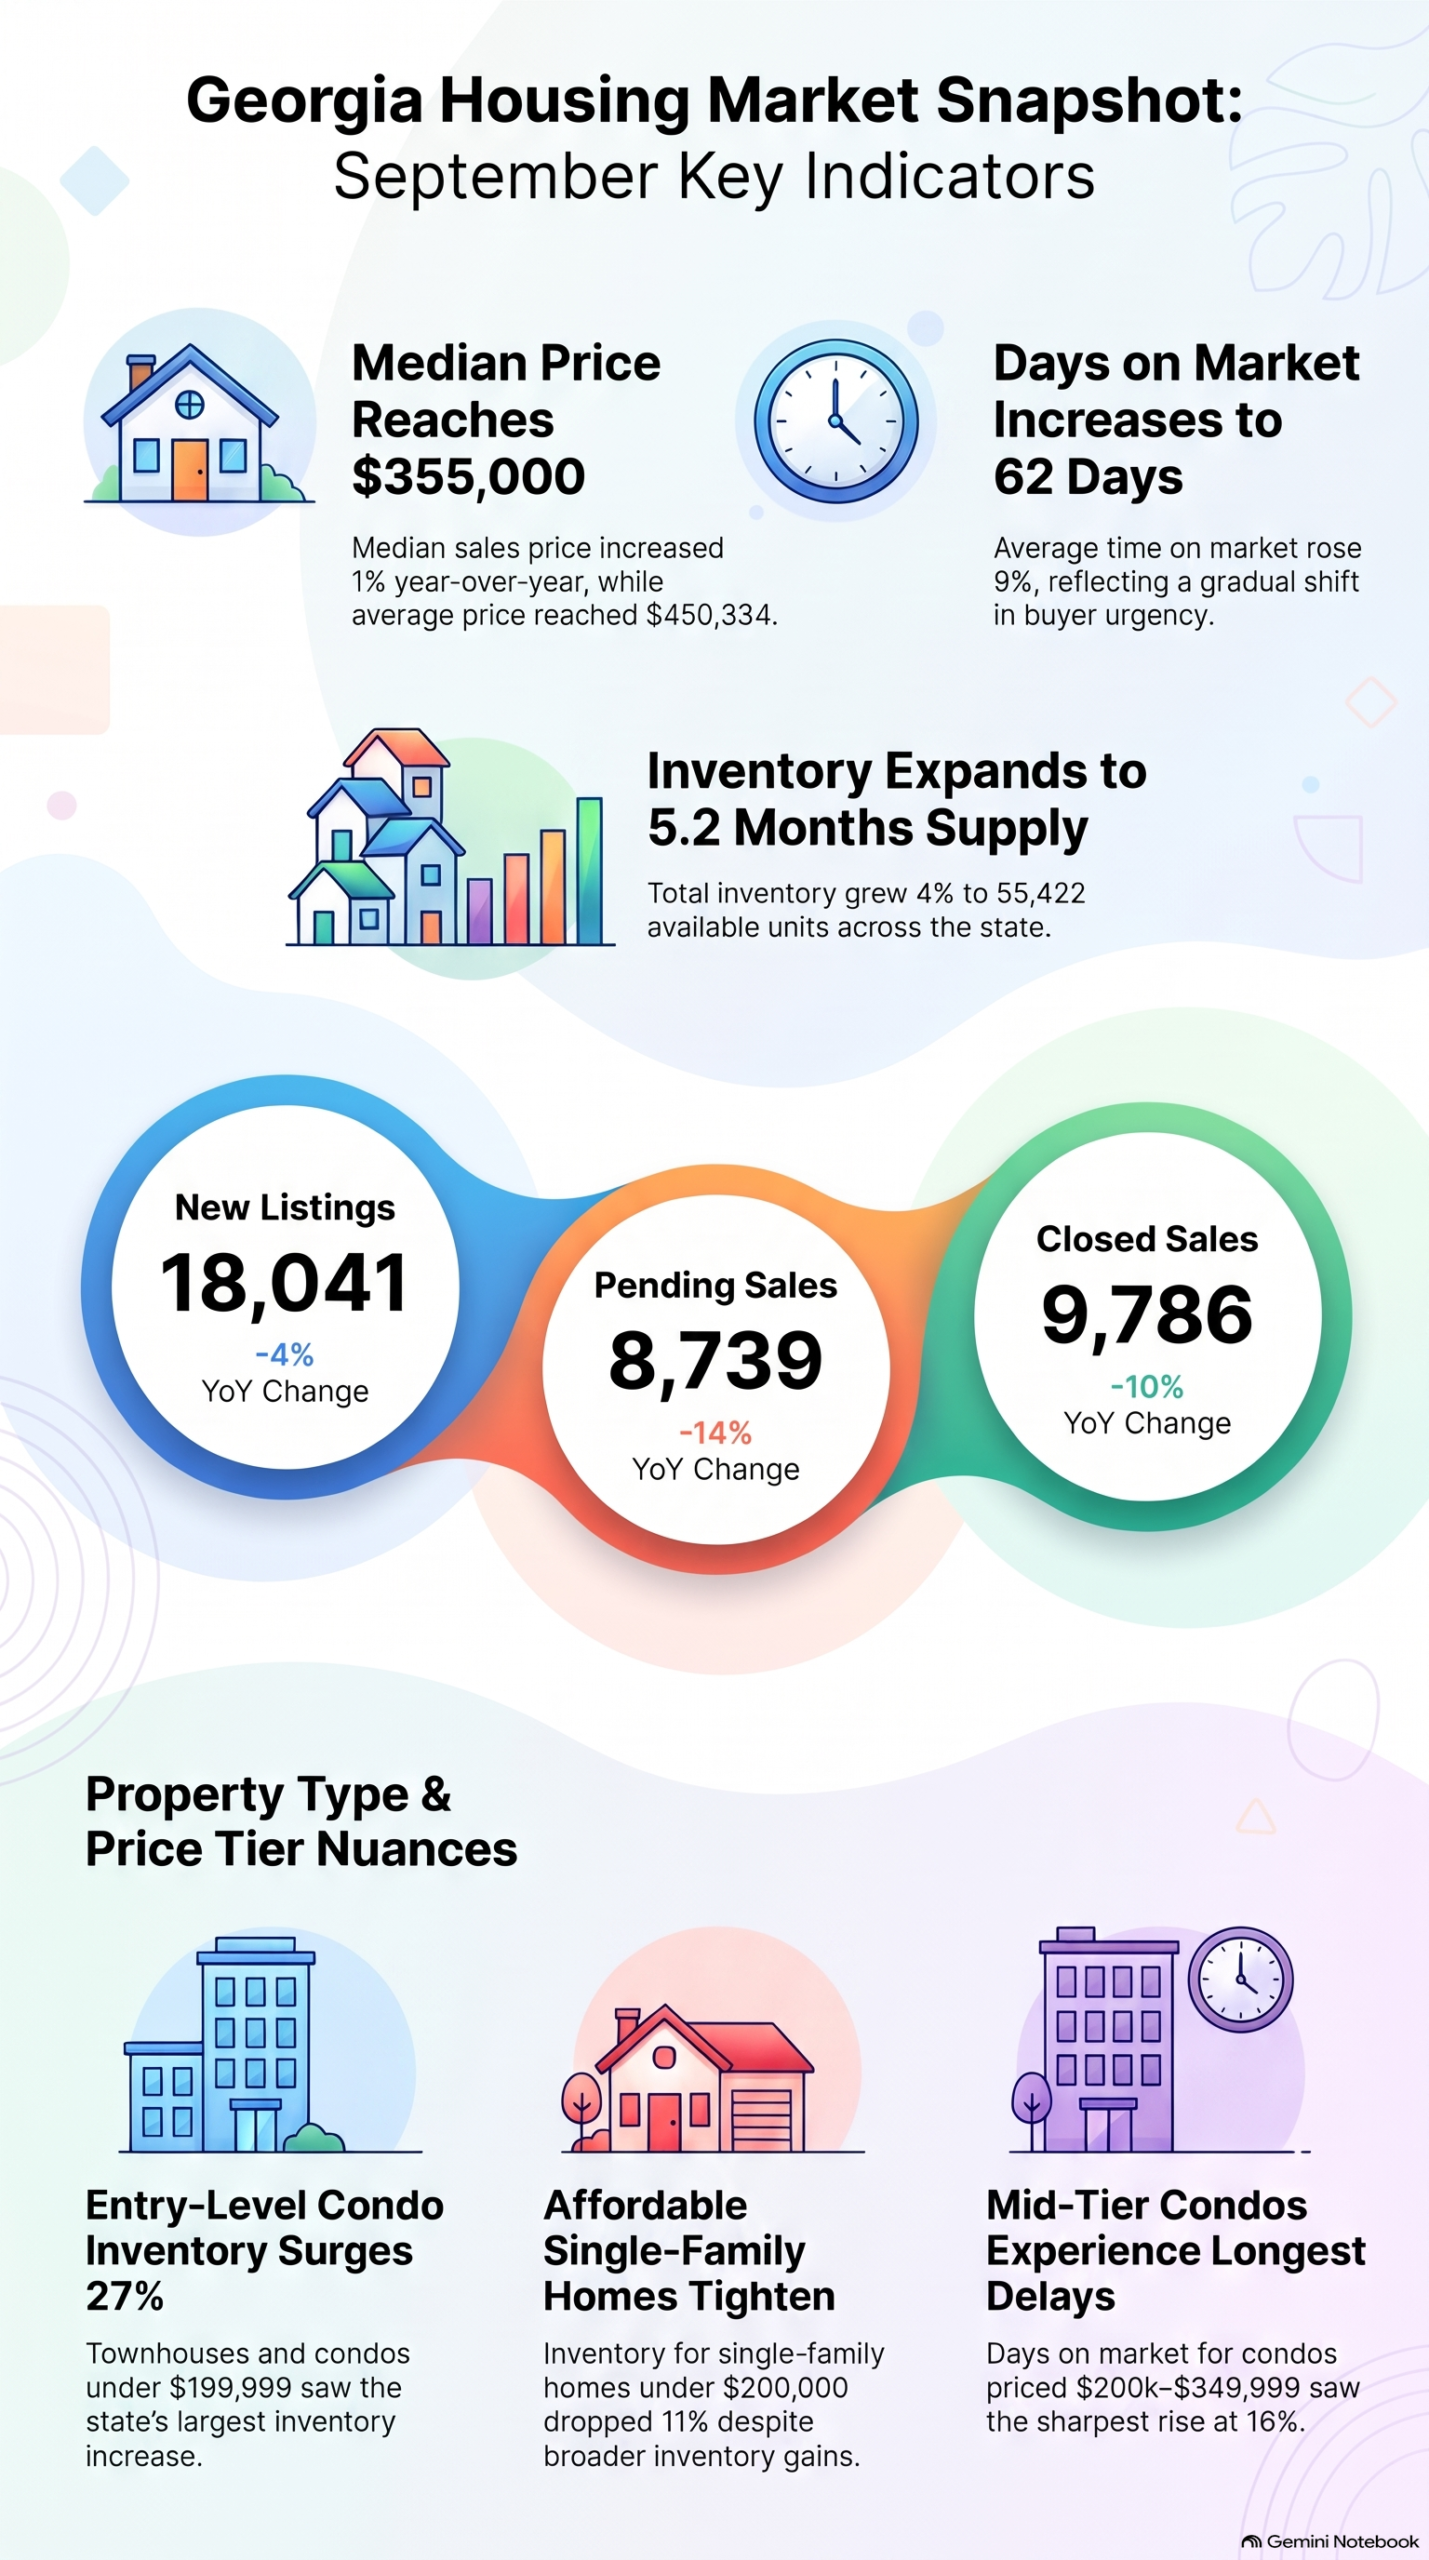
Georgia’s Housing Market – September, 2026
The theme in Georgia remains the same: no matter how the individual metrics move, the Georgia Association of Realtors describes inventory as “tight” across the state.
Home closing thoughts
Beyond the monthly data, several housing-related developments continue to shape affordability, supply, and market structure. Below are some of the more notable stories that caught my interest over the last month or so.
The NAHB Pleads for a Change in Immigration Enforcement
In the HMI survey, builders have apparently increasingly complained about legal workers failing to show up at worksites out of fear of detainment. In September, the NAHB responded with a plea for a change in immigration enforcement in “NAHB Responds as Immigration Enforcement Keeps Legal Workers Off Job Sites.” The first two paragraphs are the core observation. The NAHB follows with specific recommendations and policy changes.
“As the housing industry faces a severe labor shortage, NAHB members report that increased immigration enforcement and jobsite raids are heightening worker fears and further straining the construction labor pool.
In some markets, stepped up immigration enforcement has discouraged legally authorized workers from reporting to jobsites, delaying home construction and raising costs as the nation confronts a housing shortage of about 1.2 million units.”
Part of the fear for legal workers is weak or even absent due process when arrests and detentions occur. The NAHB specifically called out their advocacy on this issue.
“On Sept. 16, 2026, NAHB filed an amicus brief in the Fifth Circuit immigration case Sosnova Rodriquez v. Ortega, arguing that everyone in the United States deserves fair and consistent due process. NAHB said indefinite detention without the opportunity to seek bond separates people from their families, communities and workplaces. Oral arguments were held September 24, and a decision could come in the coming weeks or months.”
The NAHB concludes by urging passage of several bills critical to the housing industry in maintaining and growing its workforce. The organization also provides guidelines on “best practices” for dealing with an ICE raid.
Affordability: More Starter Homes On Smaller Lots
NPR took a trip to Massachusetts to evaluate the debate over a state ballot measure to require cities to allow housing lots as small as 5,000 square feet. This measure aims to create more affordable housing through smaller starter homes. According to NPR’s reporting “after World War II, as suburbs exploded, cities across the country mandated bigger and bigger lot sizes for single-family homes only.” These larger lot sizes remain today and have crowded out building smaller homes that first-time home buyers in particular need to get started down the path of ownership.
However, this measure will not be a panacea in towns with extremely high real estate costs. In Lexington, MA a big house on a small lot can cost upwards of $2M.
Still, the American Enterprise Institute (AEI) claims that their research shows that “builders do produce more starter homes ‘if you allow them to build on smaller lots in areas that have lower land prices’.”
Affordable Housing Development in East Oakland
Wells Fargo (WFC) has done a lot of work supporting affordable housing projects. Most recently, I saw a post on LinkedIn describing a housing development in East Oakland’s Lincoln Park that reminds me that affordable solutions are appearing across the country brick-by-brick. From Wells Fargo Foundation President Darlene Goines:
“It was a joyful day in East Oakland! A groundbreaking is about what comes next, but Liberation Park also reflects years of community vision and partnership.
Black Cultural Zone CDC (BCZ) has imagined a future for East Oakland, where affordable housing, local businesses and culture can thrive together. For the last two years, Wells Fargo has been proud to support that vision. First, the focus was on putting philanthropic capital to work to help strengthen the economic corridor and create community space. Now, BCZ is collaborating with Eden Housing, Inc. to create the residences at Liberation Park – 119 affordable homes that will contribute to this vibrant community. Thanks to Peter Cannava and our community lending and investment team, Wells Fargo is providing an $82mm construction loan and $57mm in Low-Income Housing Tax Credit equity alongside other partners to help turn this idea into a reality.
Special thanks to Anina Tweed on our team who saw the partnership opportunity early and to the many colleagues helping to strengthen East Oakland. Partnership at its best happens when we can rally resources and bring partners together from across many sectors. Liberation Park is a powerful example of that.”
Spotlight on Mortgage Rates
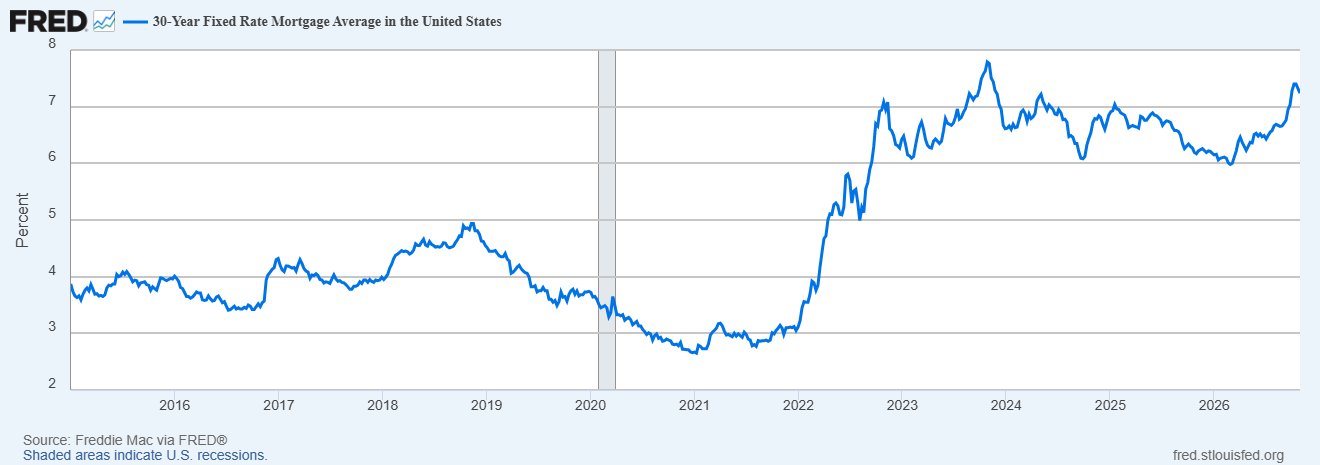
The Mortgage Bankers Association (MBA) reported three weeks with a decrease in mortgage applications and only one weekly increase for the month of October, repeating a pattern from September. For all of September, new home purchase mortgage applications plunged 8.3% year-over-year and dropped 8.0% sequentially (not seasonally adjusted).
Mortgage rates accelerated higher in September and into the first week of October, when they peaked at 7.40%, just short of the peak from three years ago. The small drop the rest of October was enough to light a fire under the stocks of home builders.
Be careful out there!
Full disclosure: long ITB, long CCS, long DHI, long LGIH