

The Market Breadth Summary
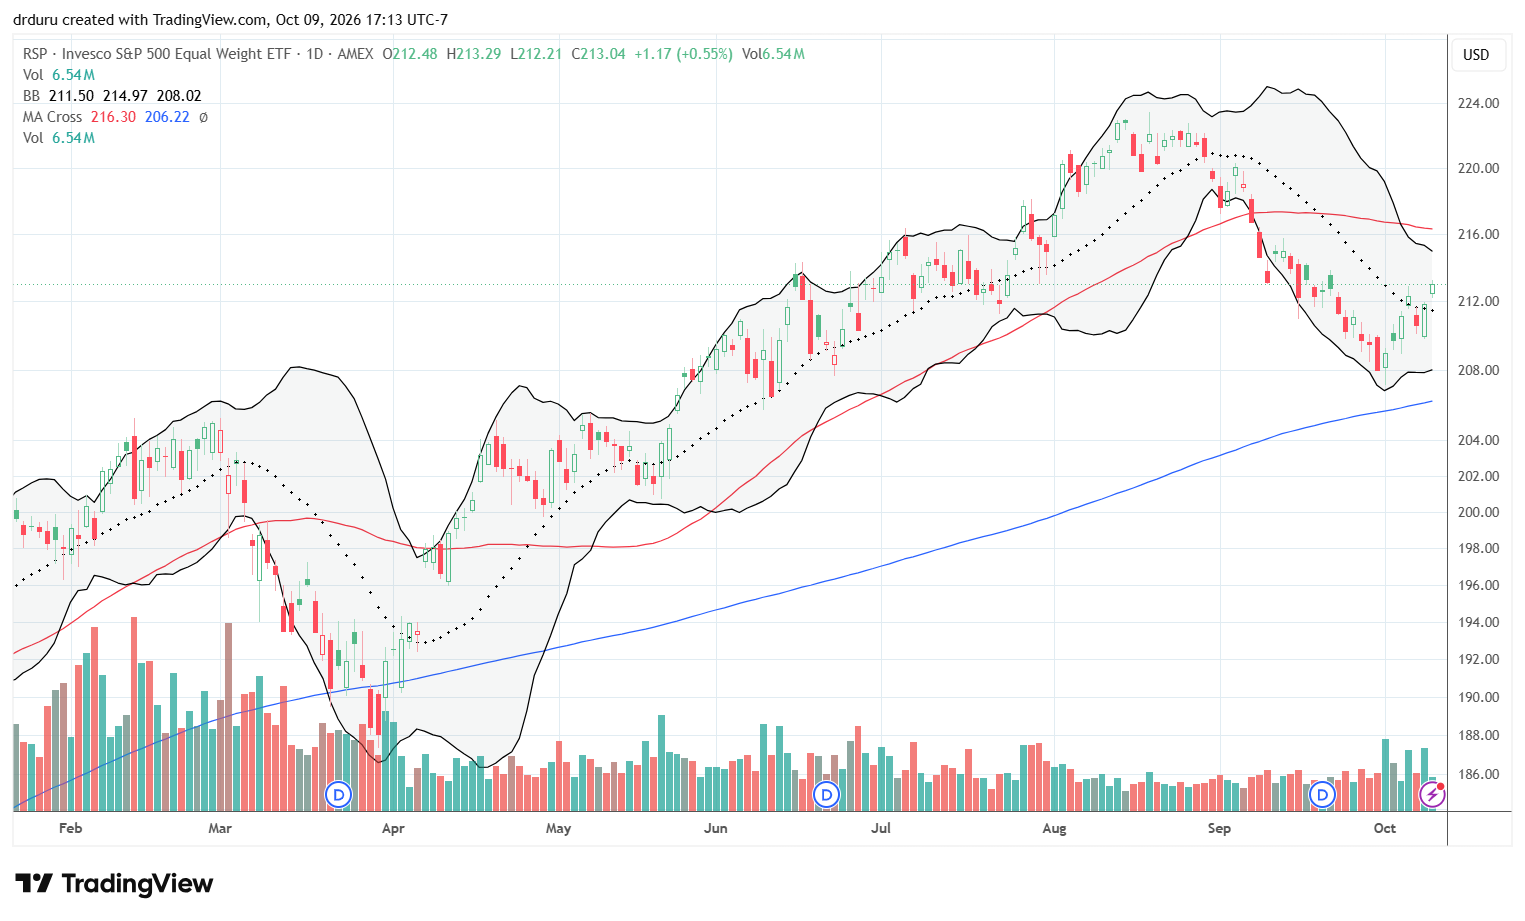
- The stock market’s slowly changing bearish divergence showed early signs of improvement as equal-weight stocks rallied and small caps defended critical support.
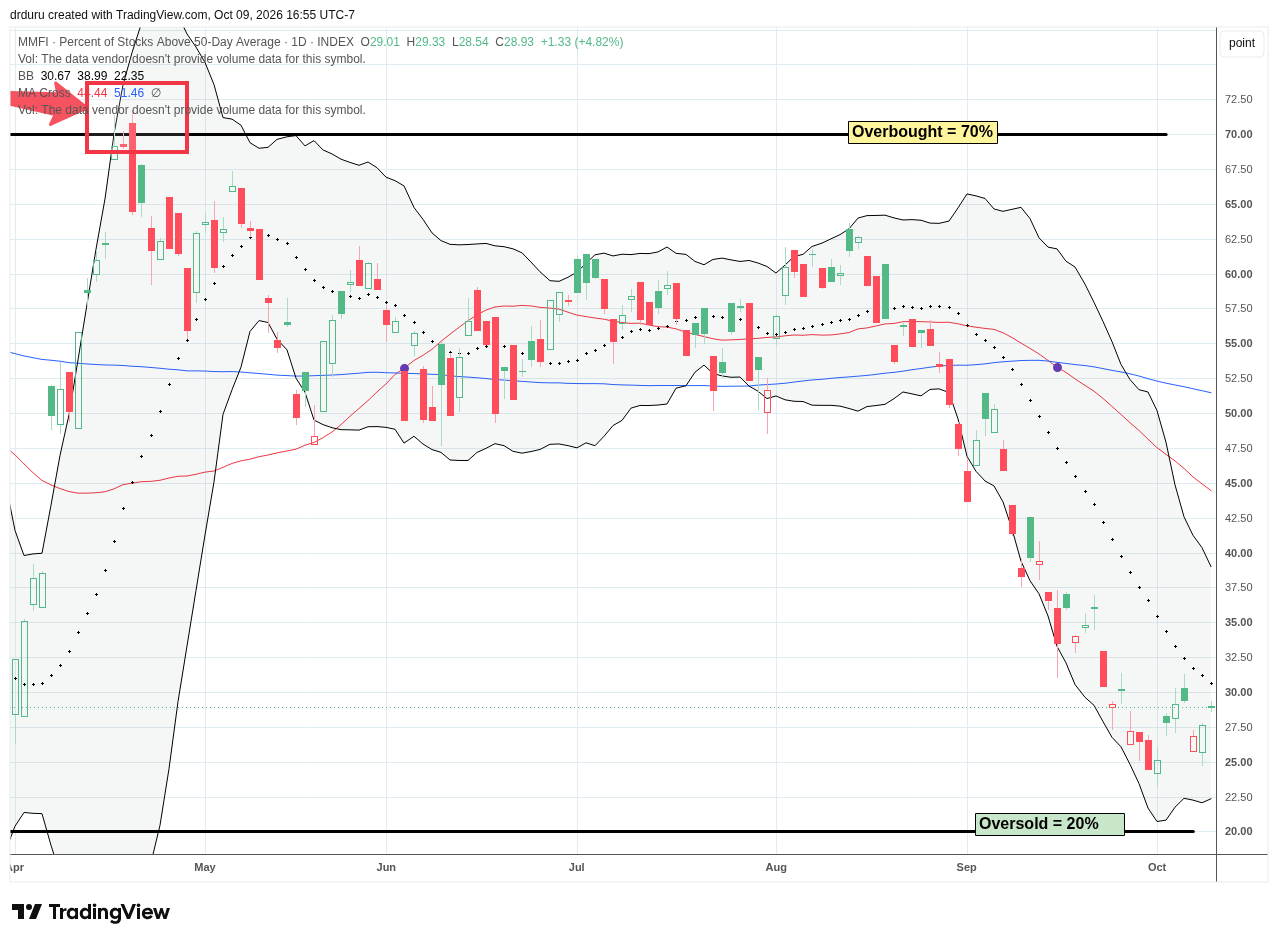
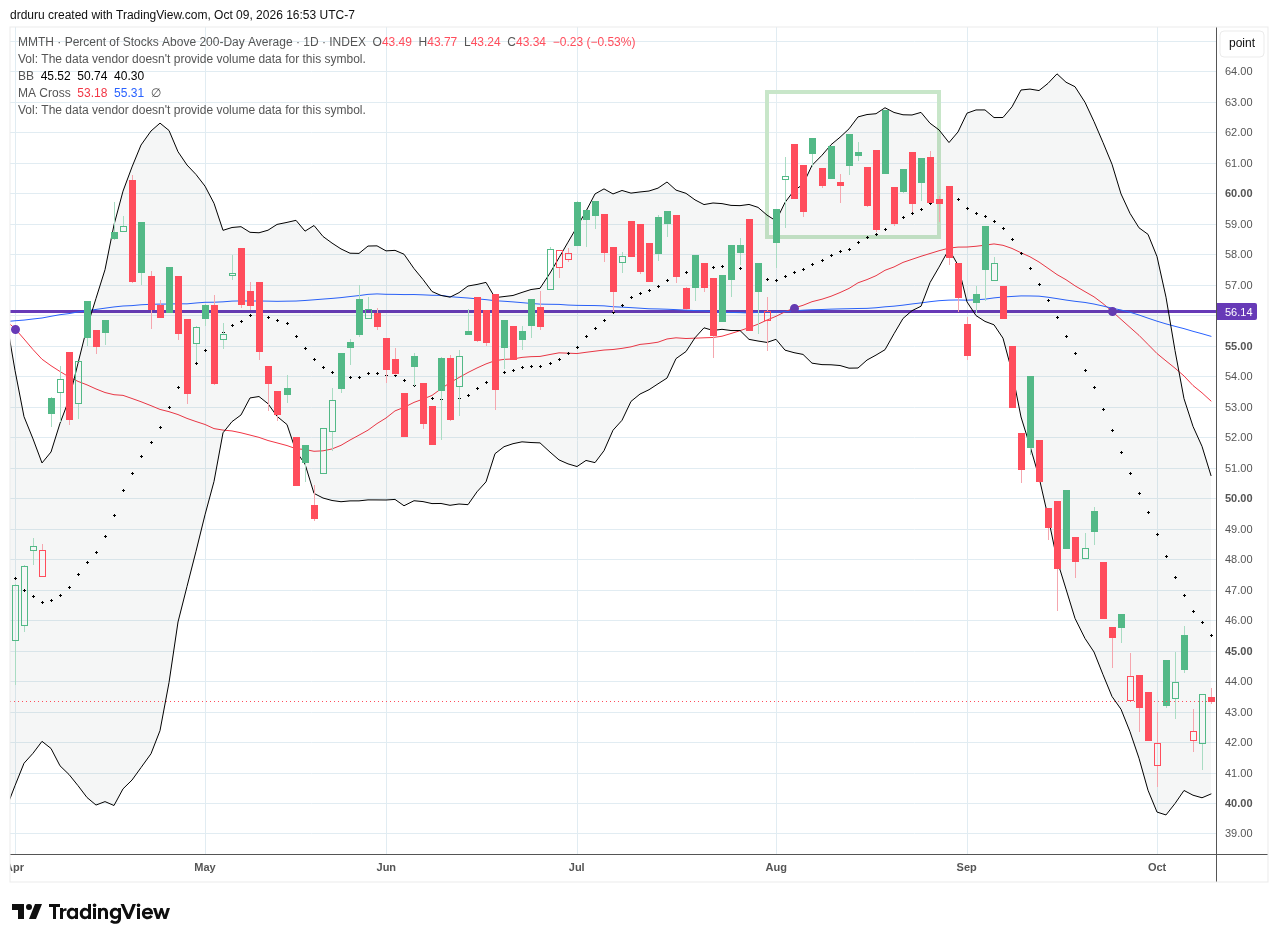
- Market breadth remained under pressure, with AT50 at 28.9% and AT200 at 43.3%, despite encouraging signs of stabilization.
- The S&P 500 and NASDAQ maintained bullish technical positions near their highs, while the Russell 2000 and financial stocks contributed to a potential breadth recovery.
- Rising Treasury yields, persistent inflation pressures, and weakening consumer sentiment threatened the sustainability of the stock market’s advance.
- AI-related stocks delivered mixed performances as semiconductor weakness contrasted with new highs in Microsoft, Arista Networks, and Palantir.
- The short-term trading call remained neutral as improving technical signals failed to confirm an end to the primary market breadth downtrend.
The Stock Market Summary
The stock market tentatively moved away from oversold’s edge. While small caps clung to critical support, the equal weight S&P 500 rallied most of the week and even ended its primary downtrend. The supportive moves prevented market breadth from revisiting the prior week’s lows even as the primary downtrend in market breadth held firm. This slowly changing bearish divergence comes just in time for the start of earnings season and augurs well for the possibility of a sustainable bottom. At the same time all the main macroeconomic headwinds are just as strong as ever with interest rates powering higher, oil prices gaining new life, and even growing unease over European debt levels, especially in France.
Meanwhile, economic news continued to point toward higher inflationary pressures that could force the Federal Reserve to keep hiking rates in response. Monday’s ISM Services PMI for September showed that the prices paid by services companies continued to increase. The preliminary October reading for the University of Michigan Consumer Sentiment Index declined from September and plunged to 46.3 from 53.6 a year earlier. Alongside this souring mood is a large jump in current inflation expectations. Incrementally higher inflation expectations will keep the pressure on the Fed and strengthen the case for further rate hikes. Year-ahead inflation expectations rose to 4.7% from 4.6% in September. Long-run inflation expectations moved up to 3.5% from 3.4% in September.
Thus while the technical bearish divergence in the stock market is slowly improving, the divergence between the stock market and felt economic conditions continues to widen apace.
S&P 500 (SPY)
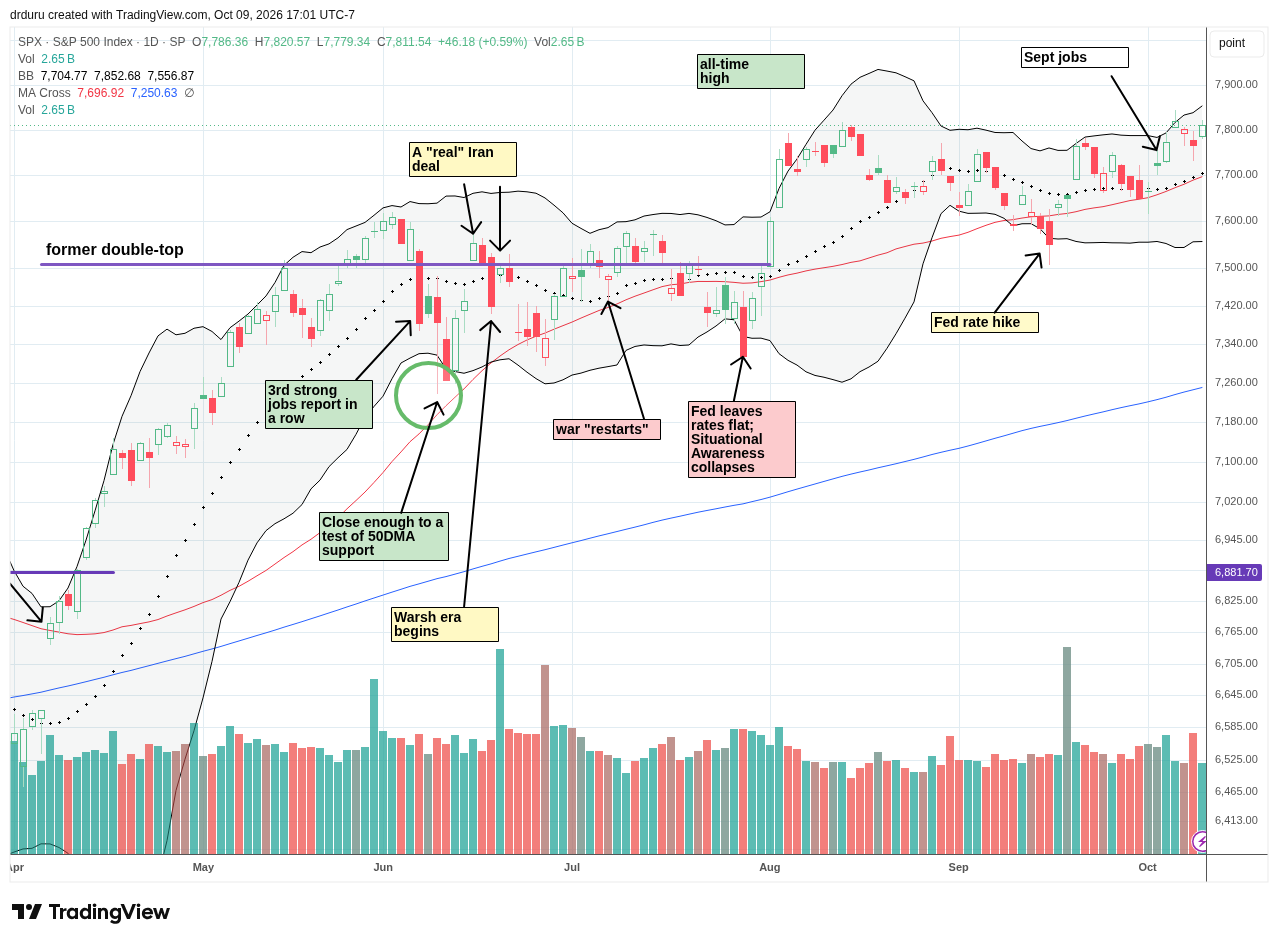
The S&P 500 continues to scrape around near all-time highs. The 50-day moving average (DMA) (red line) has provided either solid support or an important pivot since the big April breakout. The 50DMA held perfectly as support at the end of September. The convergence with the 20DMA (dashed line) further strengthens support going forward. The index notched a marginal all-time high before fading ever so slightly. It now looks ready to grind to new all-time highs going into earnings season.
NASDAQ (COMPQ)
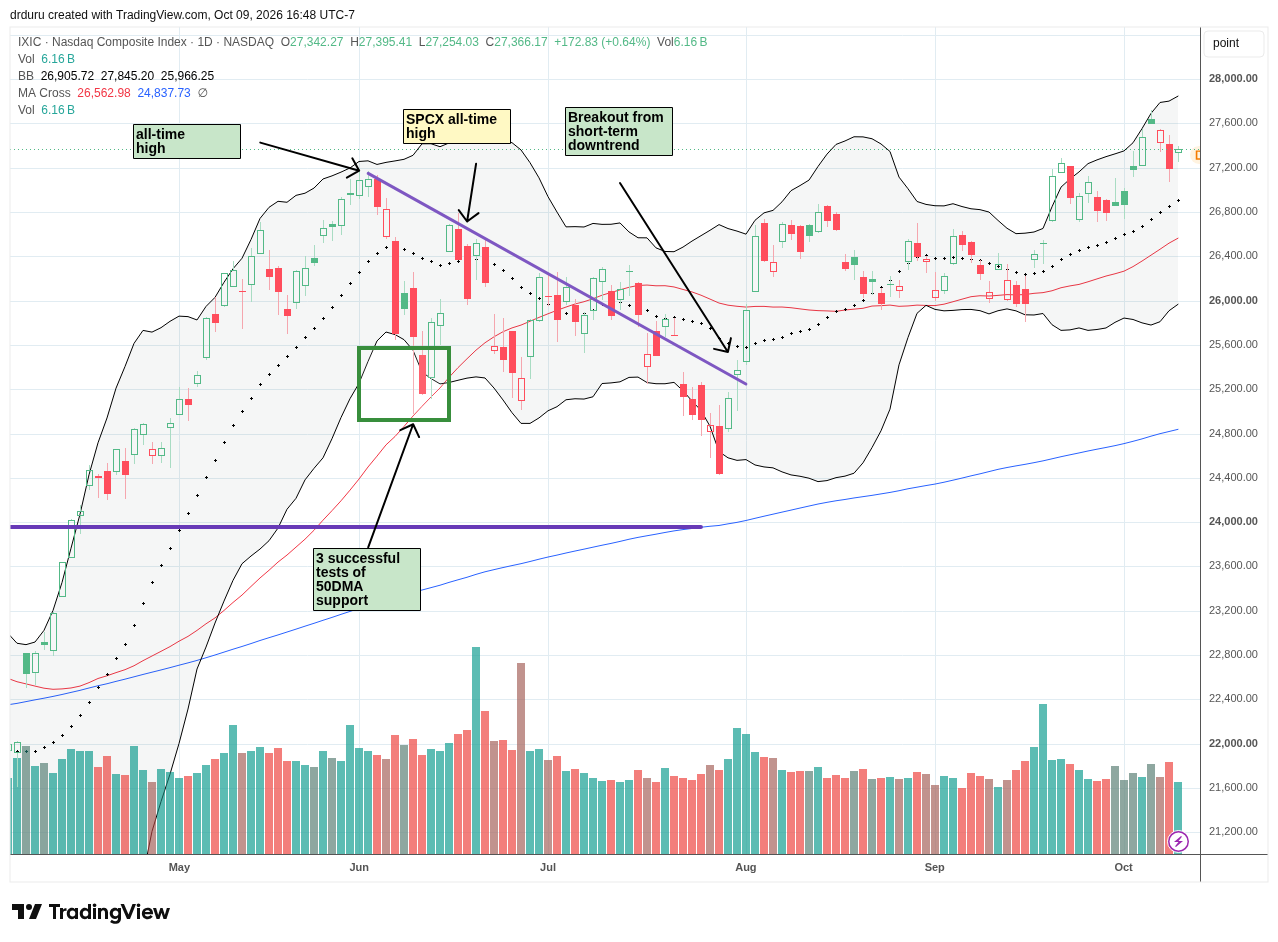
The NASDAQ remains bullish as well. The largest market-cap stocks, particularly the biggest technology stocks involved with AI, continue to help drive the advance. The tech-laden index once again looks stronger than the S&P 500 on a relative technical basis. Still, the NASDAQ did not rebound from its mid-week fade as neatly as the S&P 500. It gained 0.6% on Friday and looks ready to move higher even without a sniff of 20DMA support. Along with the S&P 500, the NASDAQ supports a slowly changing bearish divergence. However, given they have not been bearish for quite some time, they cannot turn things around on their own.
iShares Russell 2000 ETF (IWM)
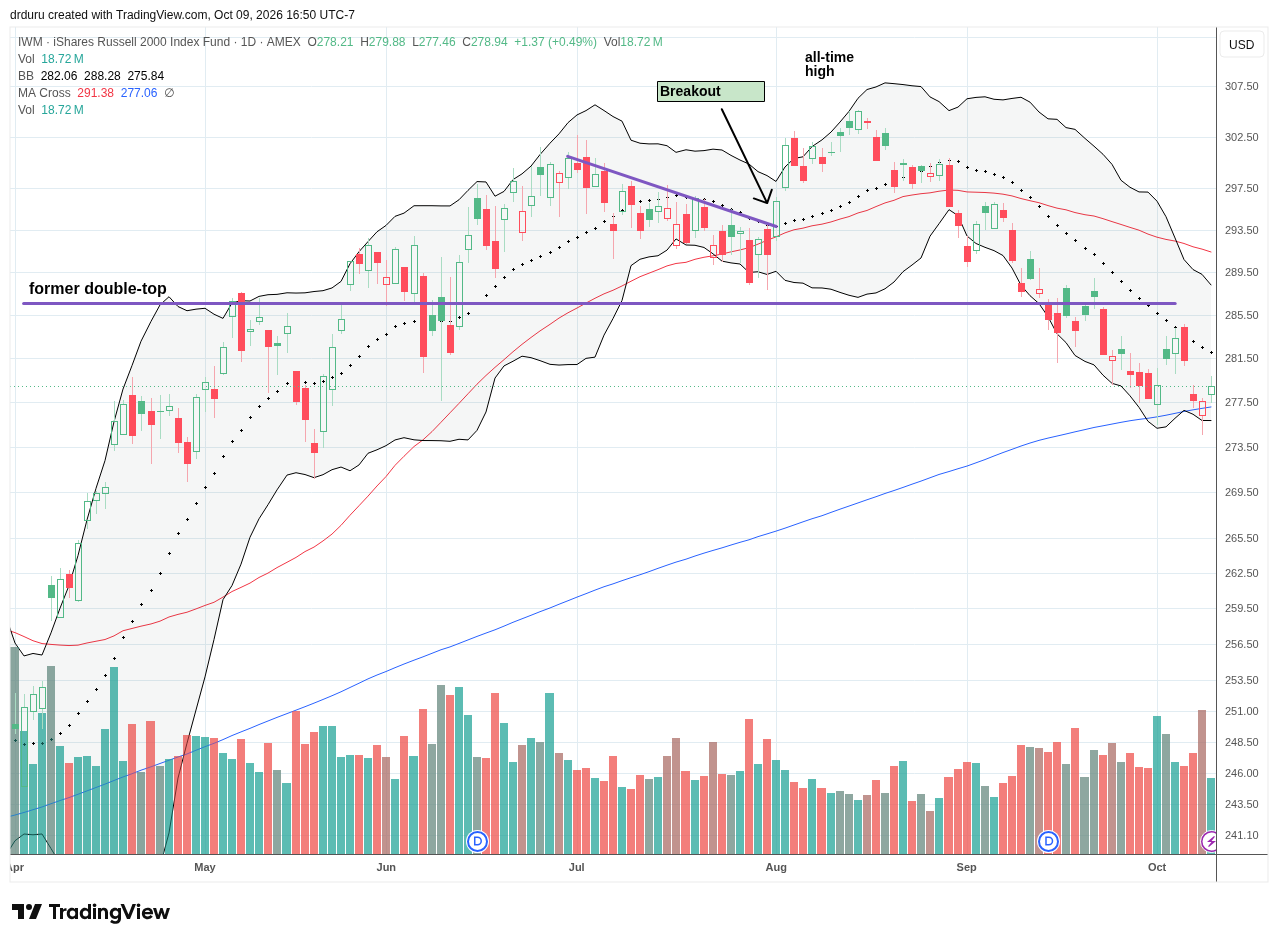
The iShares Russell 2000 ETF (IWM) is a key cog in the wheel of slowly changing bearish divergence. IWM tested its 200DMA and rebounded 0.5% on Friday. I naturally bought IWM calls on the approach and the brief breach below support. Friday’s bounce sets up a run to the downtrending 20DMA where I hope to take profits.
The Short-Term Trading Call With Slow Changing
- AT50 (MMFI) = 28.9% of stocks are trading above their respective 50-day moving averages
- AT200 (MMTH) = 43.3% of stocks are trading above their respective 200-day moving averages
- Short-term Trading Call: neutral
AT50 (MMFI), the percentage of stocks trading above their respective 50DMAs, closed the week at 28.9%. My favorite technical indicator is still in a steep downtrend, but it managed to avoid returning to the prior week’s low after Wednesday’s gap down from the downtrend line. Thus, AT50 made a higher low, a move that begins to slowly change the bearish divergence. Confirmation only comes with an end to the primary downtrend. In the meantime, RSP is leading the way to end the bearish divergence with IWM playing a supporting role.
AT200, the percentage of stocks trading above their respective 200DMAs, almost hit a new low for the year before Friday’s rebound. Like AT50, AT200 remains in a steep downtrend, but this longer-term indicator of the health of market breadth has further to go to contribute to the slowly changing bearish divergence.
In Case You Missed It…
On Wednesday, AT50 failed resistance at its downtrend line. I discussed the implications in this video. The considerations remain in place.
The Equities
Cboe 10-Year Treasury Note Yield Index (TNX)
Description: The Cboe 10-Year Treasury Note Yield Index tracks the yield of the most recently auctioned 10-year U.S. Treasury note.
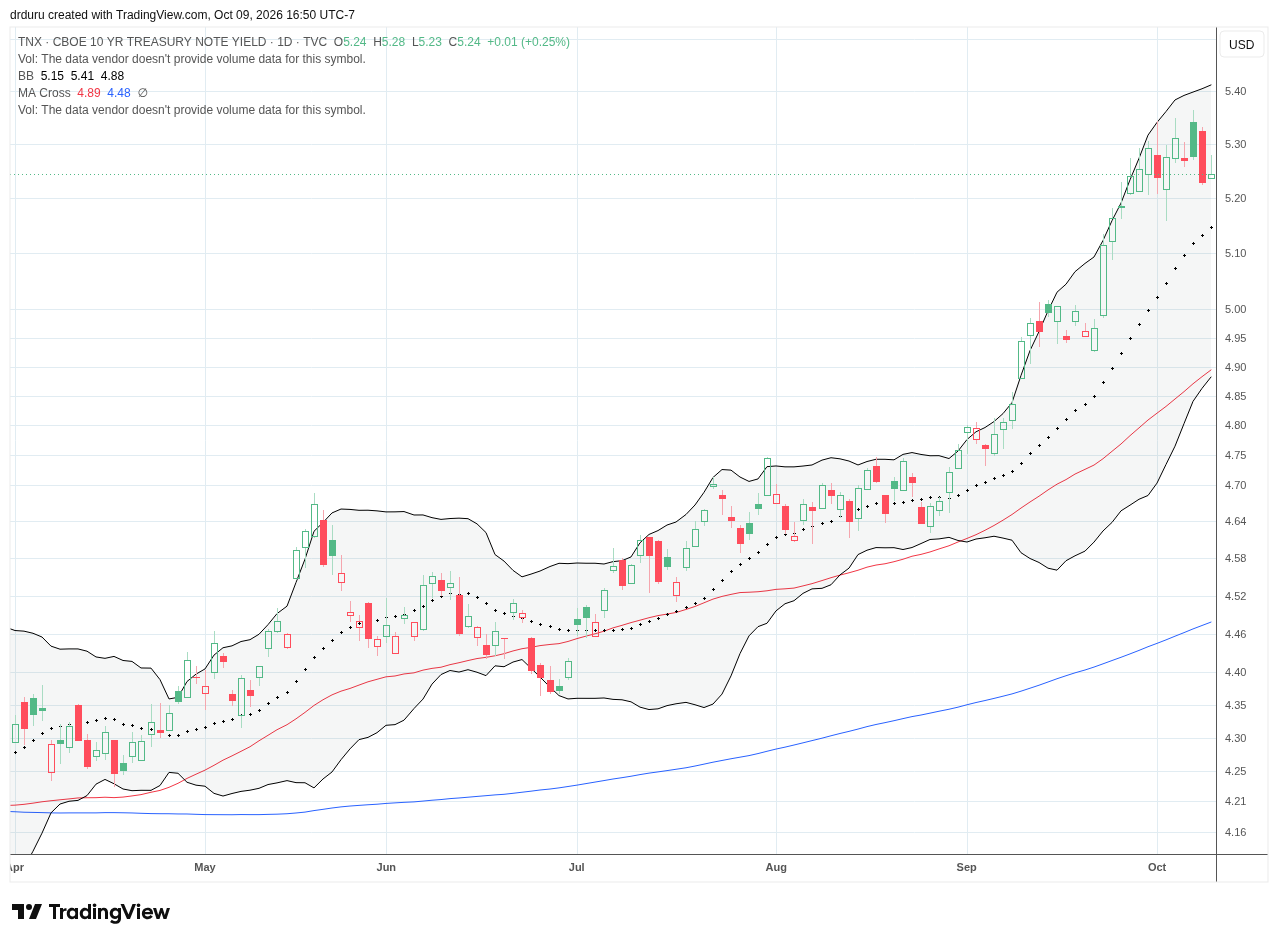
Technical Status: The Cboe 10-Year Treasury Note Yield Index (TNX) faded slightly away from a 24-year high but remains in a steep uptrend.
Trade Commentary: Treasury yields remain one of the clearest explanations for the bearish divergence in the stock market. The 10-year yield pushed to roughly 5.36% during the week before backing away. Elevated rates continue to create a much harder environment for smaller companies, cyclicals and other rate-sensitive areas that make minor contributions to the big market cap stocks that dominate the indices. The late-week easing in yields contributed to the slowly changing bearish divergence, but not enough to eliminate the underlying pressure.
Financial Select Sector SPDR Fund (XLF)
Description: The Financial Select Sector SPDR Fund is an ETF that provides exposure to financial companies within the S&P 500.
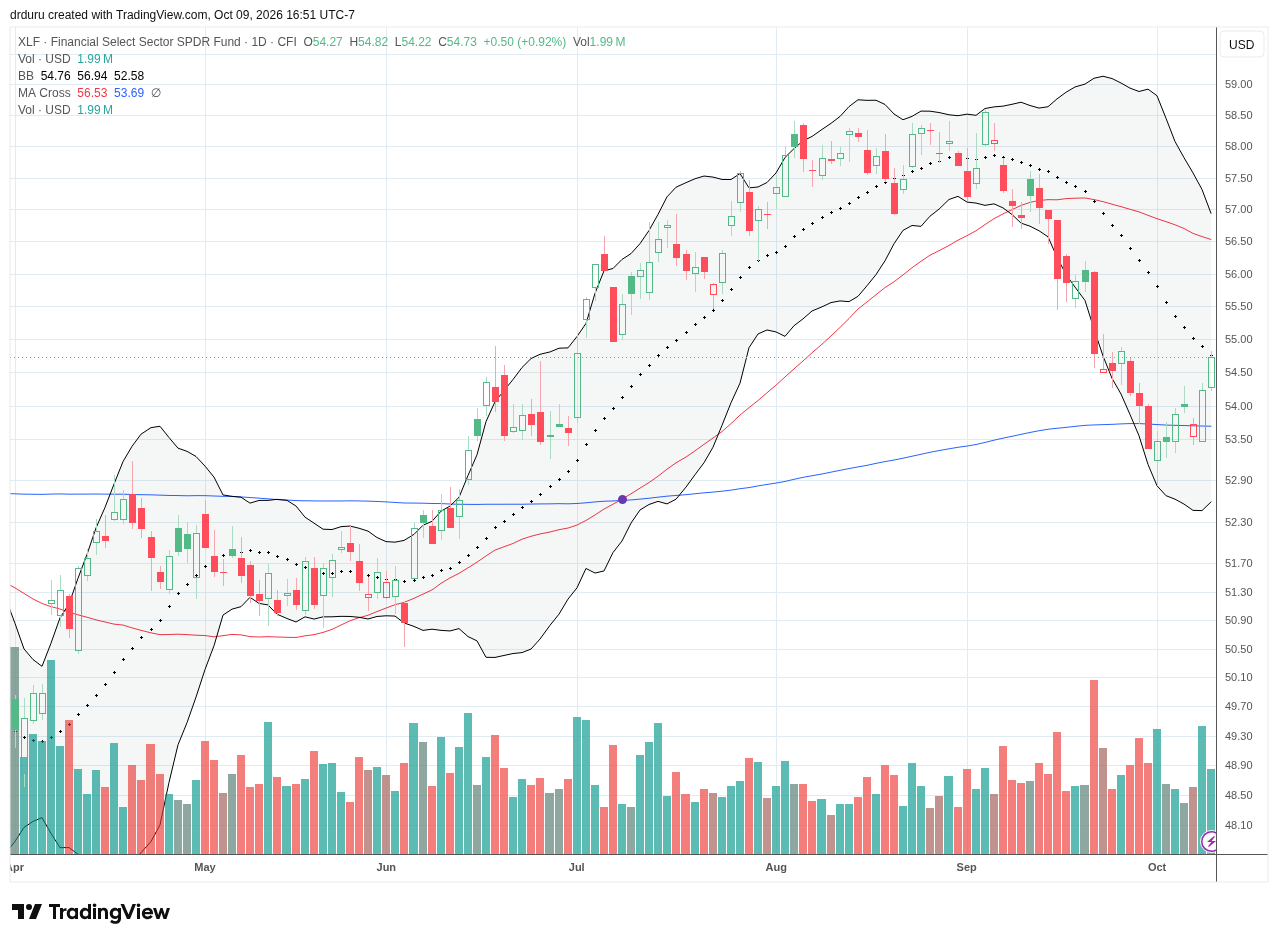
Technical Status: The Financial Select Sector SPDR Fund (XLF) confirmed 200DMA support and closed the week on top of declining 20DMA resistance.
Trade Commentary: Financials finished the week with a convincing contribution to slowly changing bearish divergence. Like IWM, XLF held support around its 200DMA. The ETF of financials shot straight up to downtrending resistance from its 20DMA. I bought call options on Wednesday and took profits on Friday. Lower expectations going into this week’s bank earnings made this trade attractive. However, I decided not to press my luck with expiration coming on Friday. A single setback would wipe out just about all the profits from the position.
VanEck Semiconductor ETF (SMH)
Description: SMH is a VanEck ETF designed to track major U.S.-listed semiconductor production and semiconductor-equipment companies.
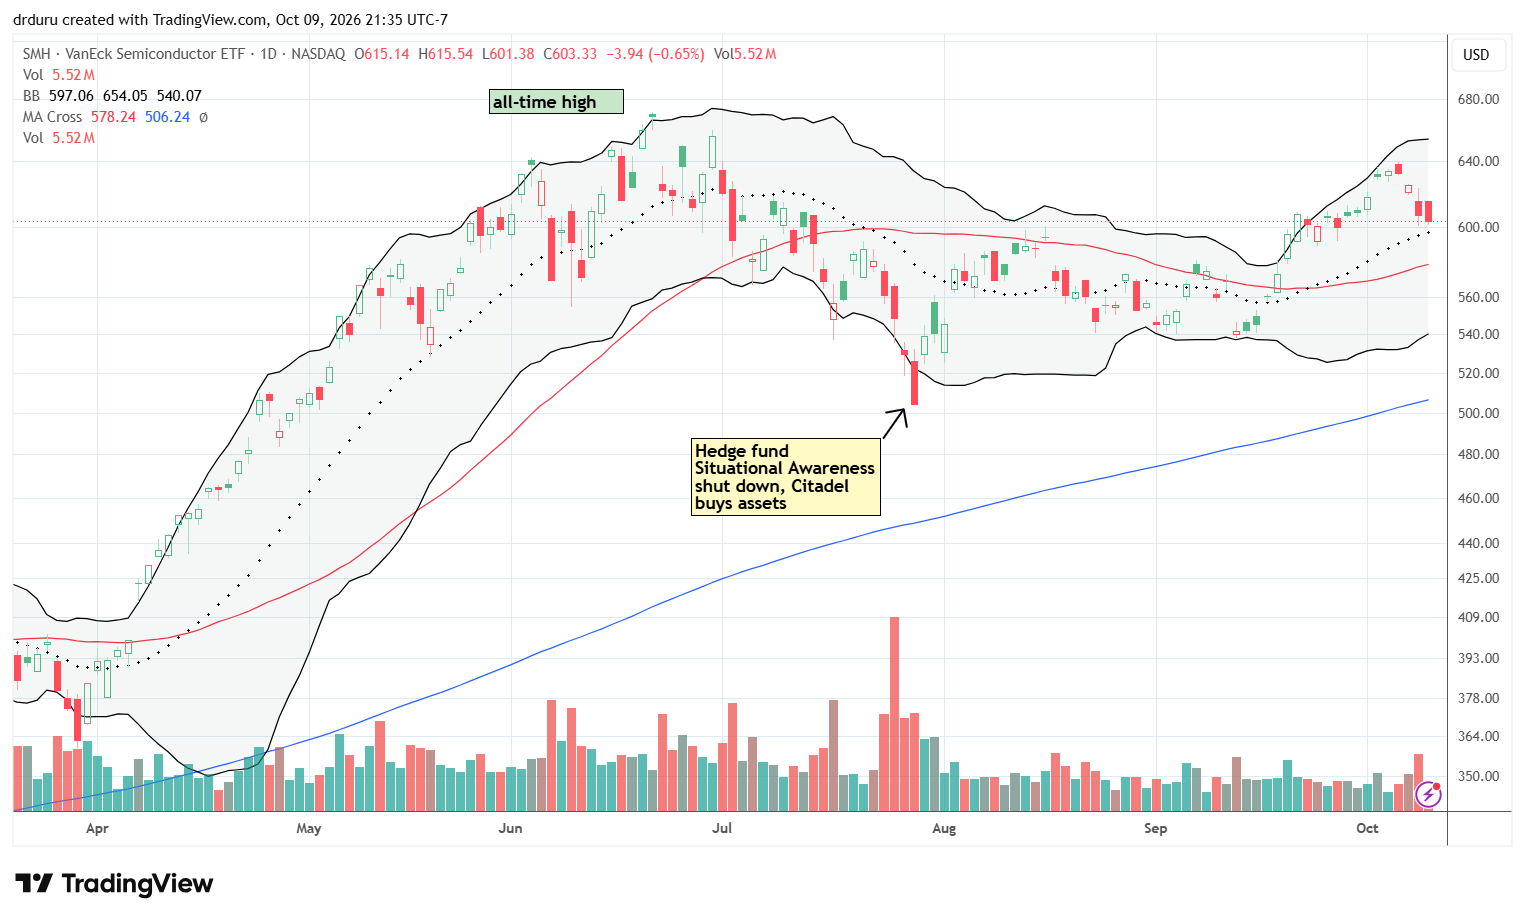
Technical Status: SMH did not contribute to the small positive changes in market breadth. Instead, the semiconductor ETF traded tired, stopped short of its all-time high, and limped toward uptrending 20DMA support.
Trade Commentary: Last week’s weakness in semiconductor stocks ran counter to the narrative of a slowly changing bearish divergence. I did not notice any specific news to explain the broad weakness, but I am willing to assume that the fade came from simple profit taking. That kind of trade could provide enough fuel to chase small caps, financials, and the smaller members of the S&P 500 into their contributions to the slowly changing bearish divergence.
Intel Corporation (INTC)
Description: Intel Corporation designs and manufactures processors, semiconductor products and related computing technologies.
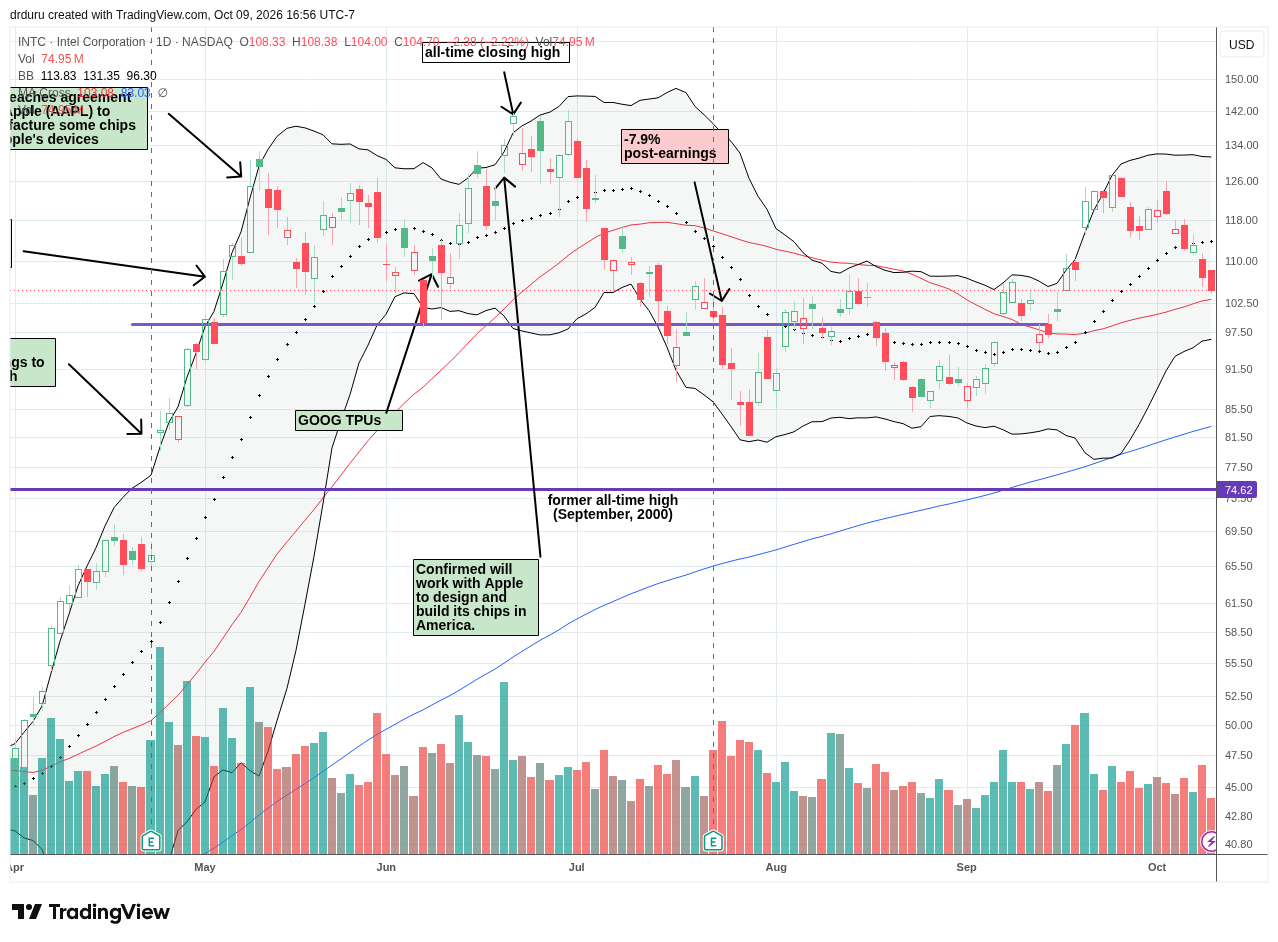
Technical Status: Intel Corporation (INTC) broke down below its 20DMA and is now testing 50DMA support, making June’s all-time high look like a lasting top.
Trade Commentary: INTC gapped down to start the week and sellers barely paused the rest of the week. I am now more actively trading INTC call options, and I got caught on the losing side for the first time in a long time. However, I am set to try the next trade on a test of uptrending 50DMA support.
Vertiv Holdings Co (VRT)
Description: Vertiv Holdings provides power, cooling and other critical digital infrastructure used primarily in data centers and communications networks.
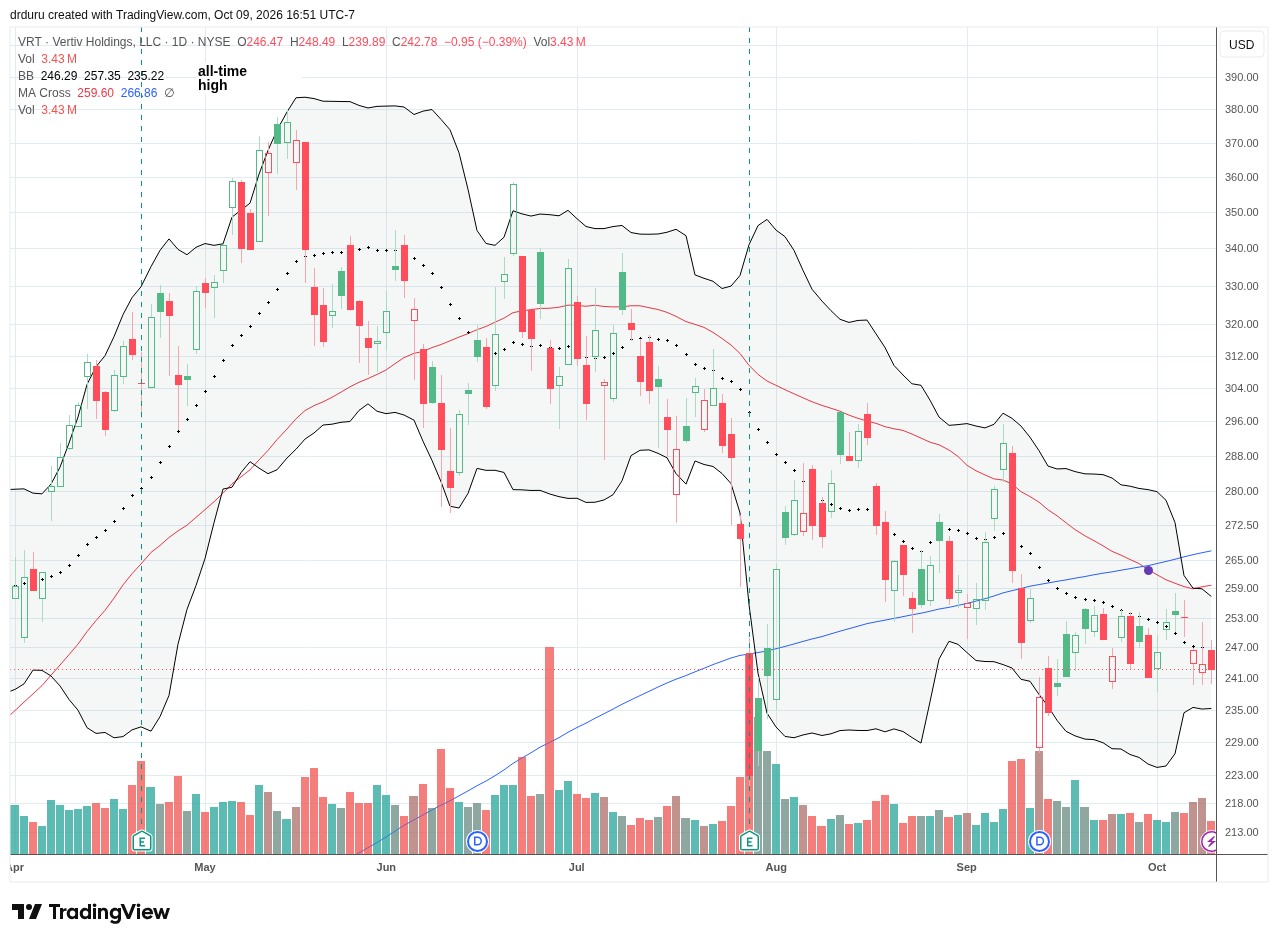
Technical Status: Vertiv Holdings Co (VRT) continues to grind lower with its 20DMA while remaining trapped below 50DMA and 200DMA resistance levels.
Trade Commentary: VRT started the week finally looking ready to challenge overhead resistance. Instead, it sagged along its downtrending 20DMA for the rest of the week. Close-up, VRT looks like it is churning in place. However, the downtrending 20DMA reveals the dominant trend. Thus, as a key AI trade, VRT adds to the warning of a topping in the AI trade…especially with SMH fading last week.
Caterpillar Inc. (CAT)
Description: Caterpillar manufactures construction and mining equipment, diesel and natural-gas engines, industrial turbines and related machinery.
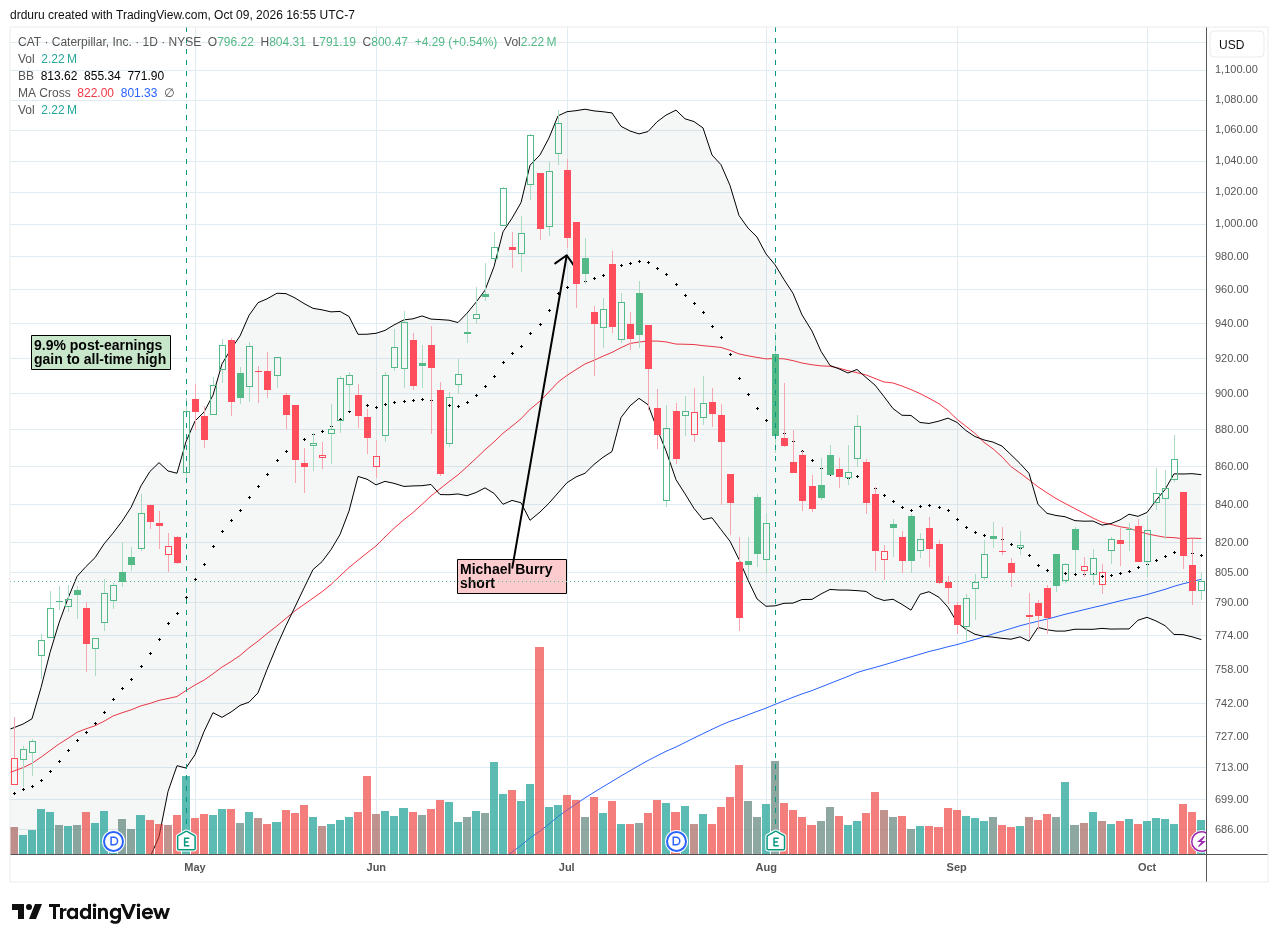
Technical Status: Caterpillar Inc. (CAT) fell sharply from a bullish breakout to a test of 200DMA support.
Trade Commentary: CAT’s weakness expanded the bearish divergence. Shares fell 5.8% on Wednesday after the FTC and USDA opened a public inquiry into competition and business practices in agricultural-equipment manufacturing and distribution. The Federal government departments want “to address the growing number of complaints received by USDA that farmers across the country face other barriers to acquiring agricultural equipment and the services required to keep equipment operating.” I was surprised that CAT fell in sympathy with this news, so I speculated on a call option for a bounce from 20DMA support. I added to my shares on Thursday’s additional pullback and am looking to speculate on another call option this coming week.
Deere & Company (DE)
Description: Deere & Company manufactures agricultural, construction and forestry equipment and provides related technology and financial services.
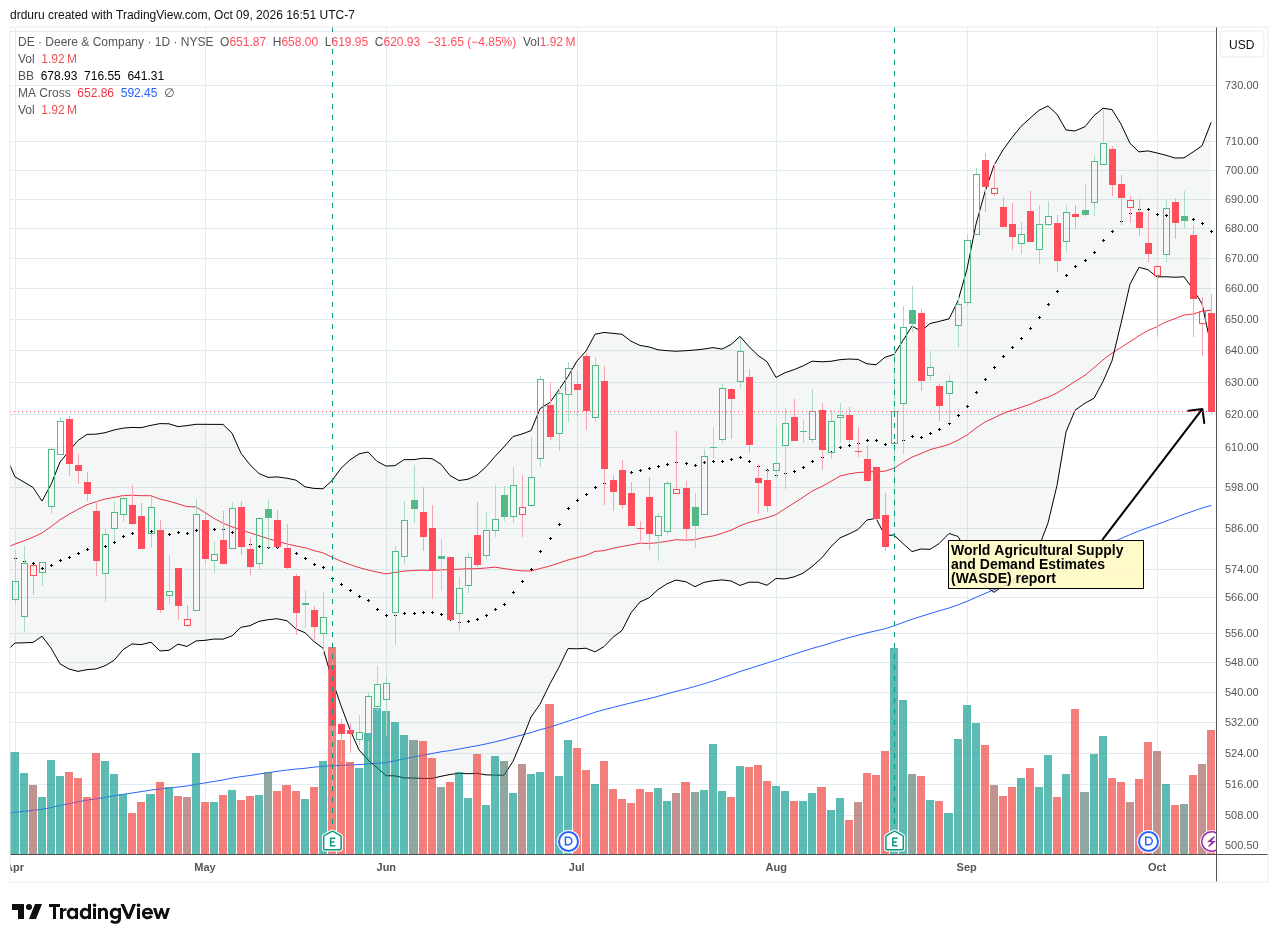
Technical Status: DE lost 3.8% in the wake of an inquiry by the FTC and USDA and failed to hold 50DMA support after the latest WASDE report took the stock down another 4.9%.
Trade Commentary: The FTC and USDA inquiry seemingly greased the skids for the WASDE report. DE’s breakdown puts the stock into bearish territory. Still, the stock is hanging on to its total post-earnings gains that started in August. I am not interested in trading DE, but I can see the selling eventually taking DE to a test of 200DMA support.
C.H. Robinson Worldwide, Inc. (CHRW)
Description: C.H. Robinson Worldwide is a third-party logistics company that provides freight brokerage, transportation management and related supply-chain services.
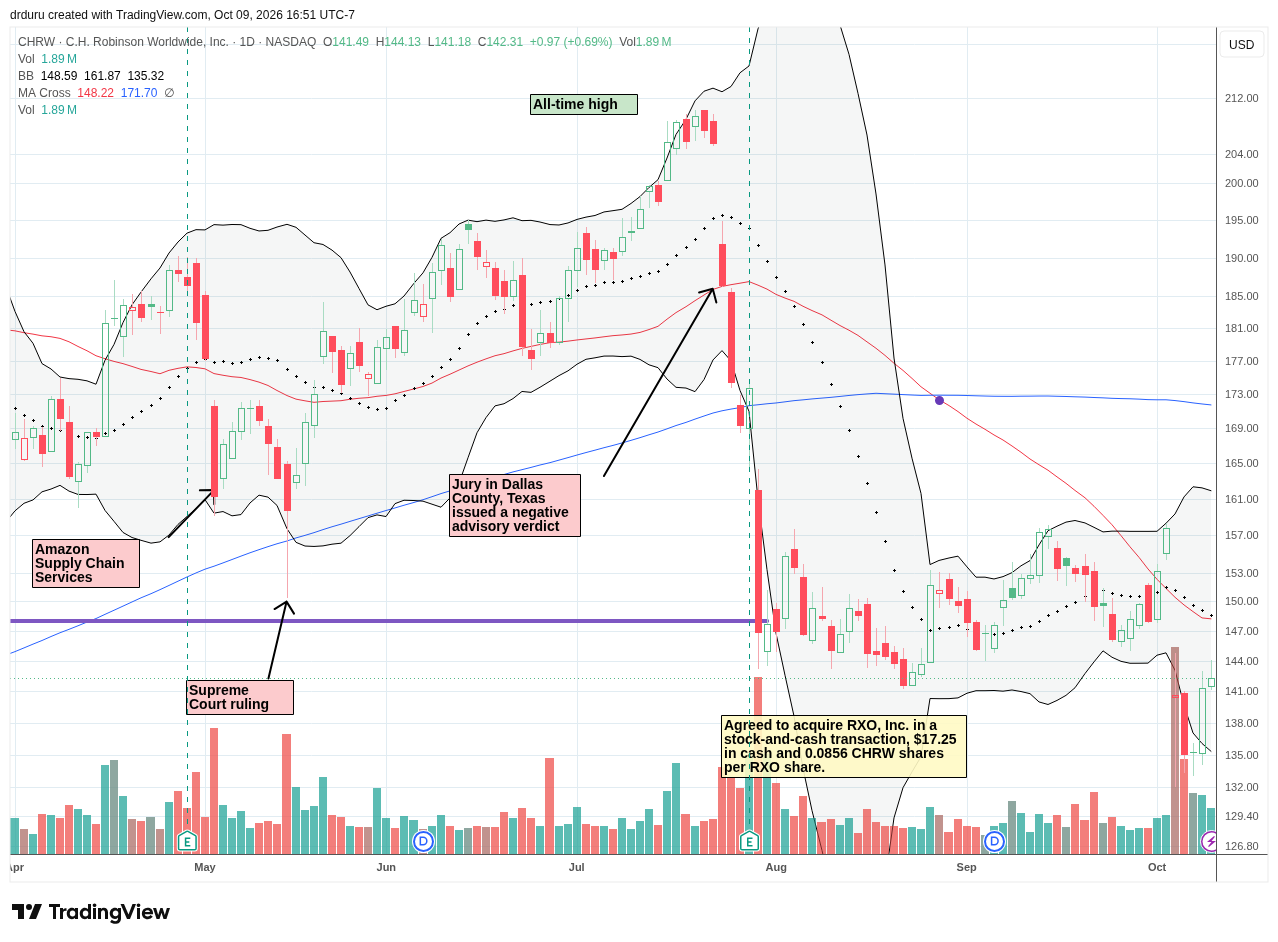
Technical Status: C.H. Robinson Worldwide, Inc. (CHRW) fell 10.9% after announcing it plans to acquire competitor RXO, Inc (RXO). The 50DMA breakdown returned CHRW to bearish territory.
Trade Commentary: Ever since losing 15.4% post-earnings in July, CHRW has traded below where it closed after a bizarre AI-driven panic in February. Last week’s announcement of plans to acquire competitor RXO, Inc (RXO) dropped the stock a leg lower to a near 52-week low. Buyers stepped in before the stock finished reversing post-earnings gains from last October’s earnings. Those buyers also stayed my hand from dumping my latest trade in the stock. I now have a clear support level below which I will give up and watch the stock’s price action from the sidelines.
Microsoft Corporation (MSFT)
Description: Microsoft develops software, cloud-computing platforms, artificial-intelligence products, operating systems and enterprise technology services.
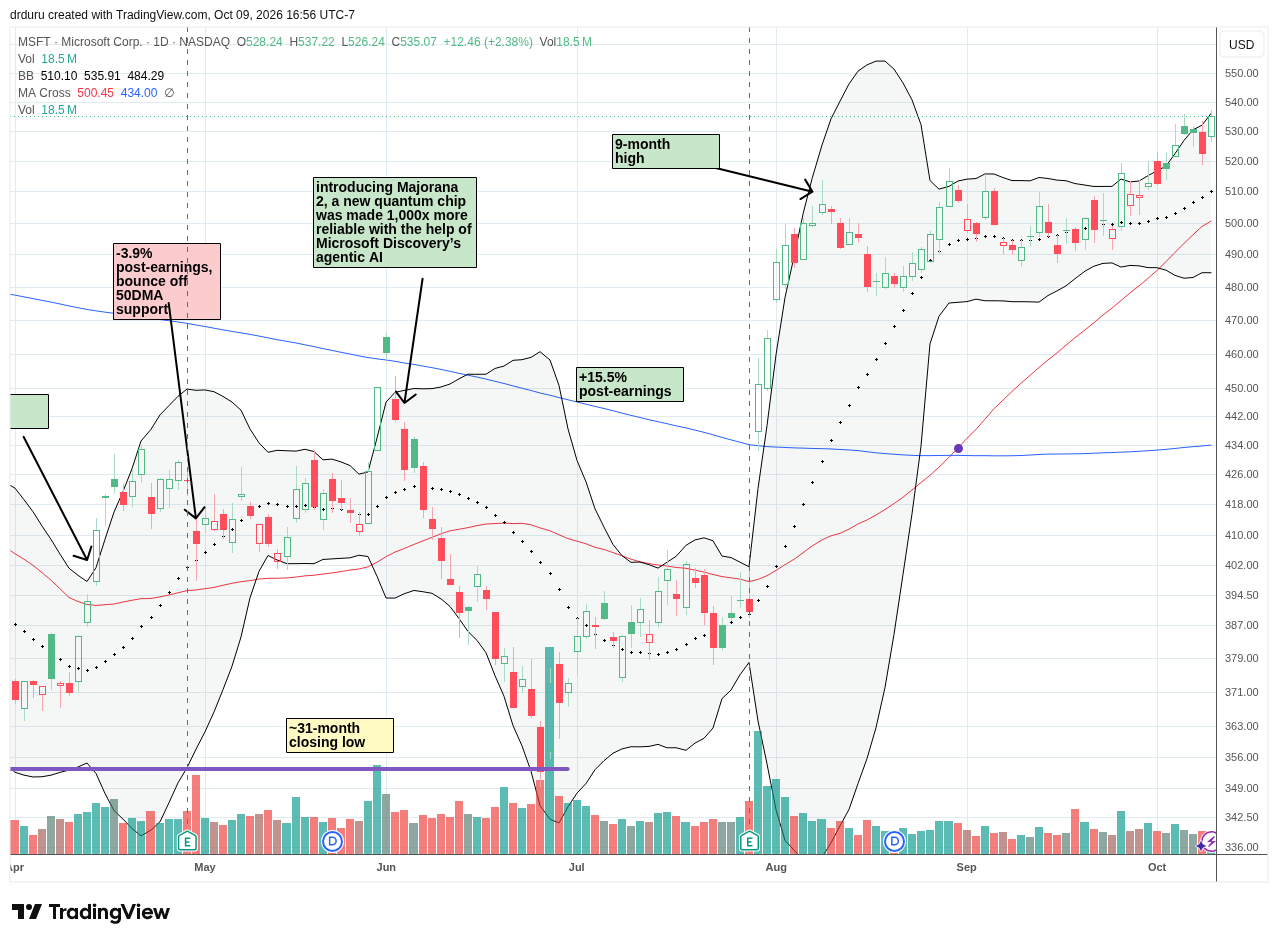
Technical Status: Microsoft Corporation (MSFT) reached a new high for the year, rising alongside its upper Bollinger Band.
Trade Commentary: I sold my MSFT shares last week as it stalled below last year’s double-top. I did not flip bearish on the stock, but I did a little risk management. I stayed convicted through a lot of churn and accumulated additional shares along the way. It just made sense to lock in the fruits of that patience at this level. The stock resumed its grind to the $554 all-time high level with Friday’s 2.4% gain. I will happily buy MSFT in the next sell-off, but I also will have no regrets if it keeps rallying to fresh all-time highs.
Arista Networks, Inc. (ANET)
Description: Arista Networks develops high-speed networking switches, routing platforms and software used in cloud, data-center and enterprise networks.
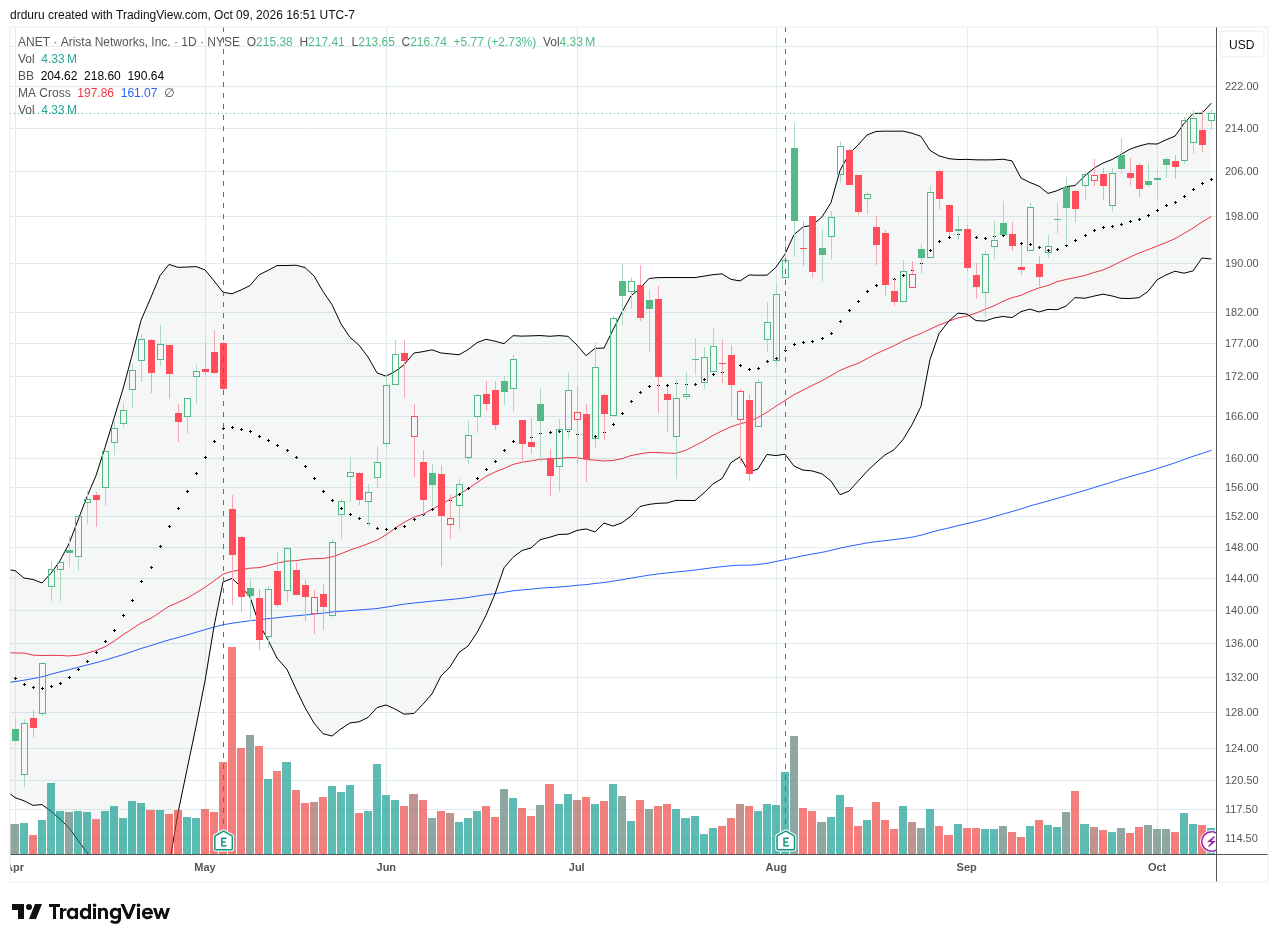
Technical Status: Arista Networks, Inc. (ANET) resumed its steady uptrend since testing 50DMA support in the middle of September, and now trades at all-time highs.
Trade Commentary: My trade in ANET had to survive two tests of 50DMA support before resuming post-earnings momentum. Since the last test in September, the stock has floated above its 20DMA and followed underneath its upper Bollinger Band. At a closing all-time high, the stock looks like it could continue to rally higher.
Palantir Technologies Inc. (PLTR)
Description: Palantir Technologies develops data-integration, analytics and artificial-intelligence software for government and commercial customers.
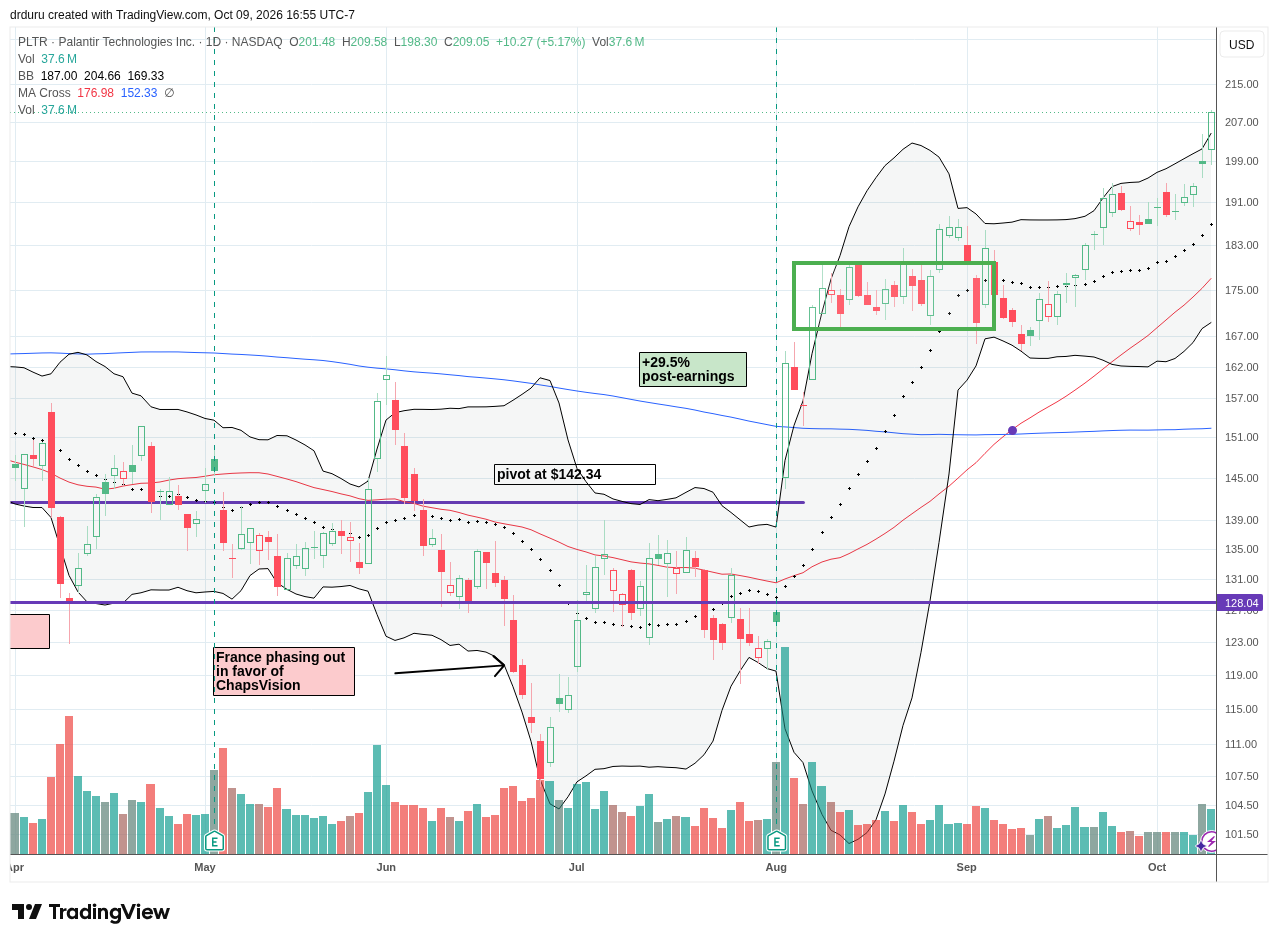
Technical Status: Palantir Technologies Inc. (PLTR) closed the week with a 5.2% jump to an all-time high.
Trade Commentary: PLTR was my big miss of the week. In August, I made a case for buying the dips in PLTR. The stock never dipped, but its subsequent price consolidation established a solid base for trading higher. I failed twice to buy shares after PLTR broke out above the consolidation area shown below in the green box. The surge to an all-time high stretched the stock well above its upper Bollinger Band, so I am now looking for the next buying opportunity in the form of a cooling period.
Cisco Systems, Inc. (CSCO)
Description: Cisco Systems develops networking, security, collaboration and infrastructure products and services for enterprises and communications providers.
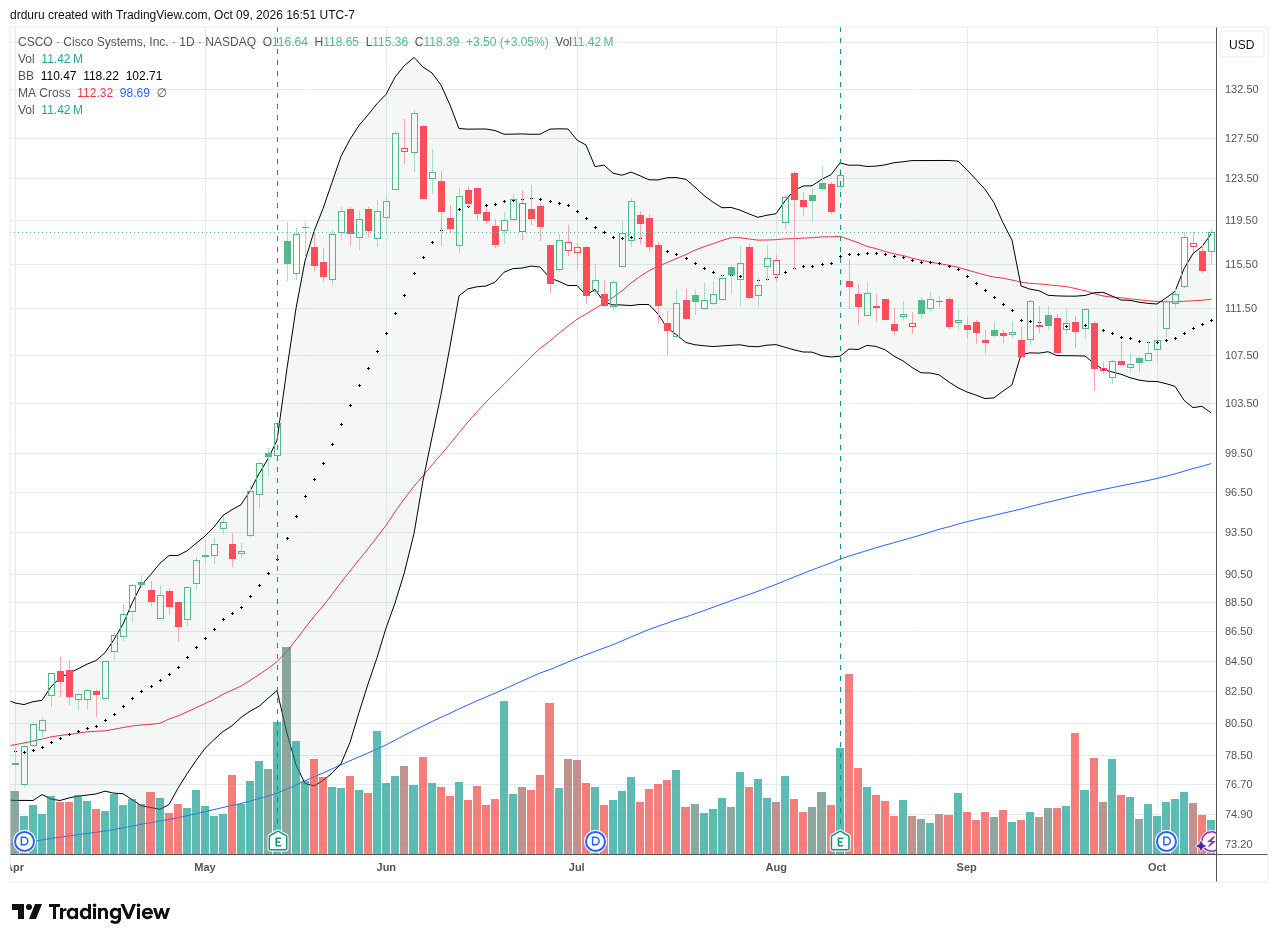
Technical Status: Cisco Systems, Inc. (CSCO) confirmed a 50DMA breakout and looks set to challenge its previous peak.
Trade Commentary: With ANET doing well, I checked out CSCO. I found a perfect technical setup with the stock confirming a 50DMA breakout. However, I did not want to chase the stock well above its upper Bollinger Band. A buyable pullback started from there, but I was forced to pull the trigger on Friday after the stock gapped higher. The stock’s momentum looks poised to fill the last post-earnings gap down in short order.
Everus Construction Group, Inc. (ECG)
Description: Everus Construction Group provides specialty electrical, mechanical and other construction services primarily in the United States.
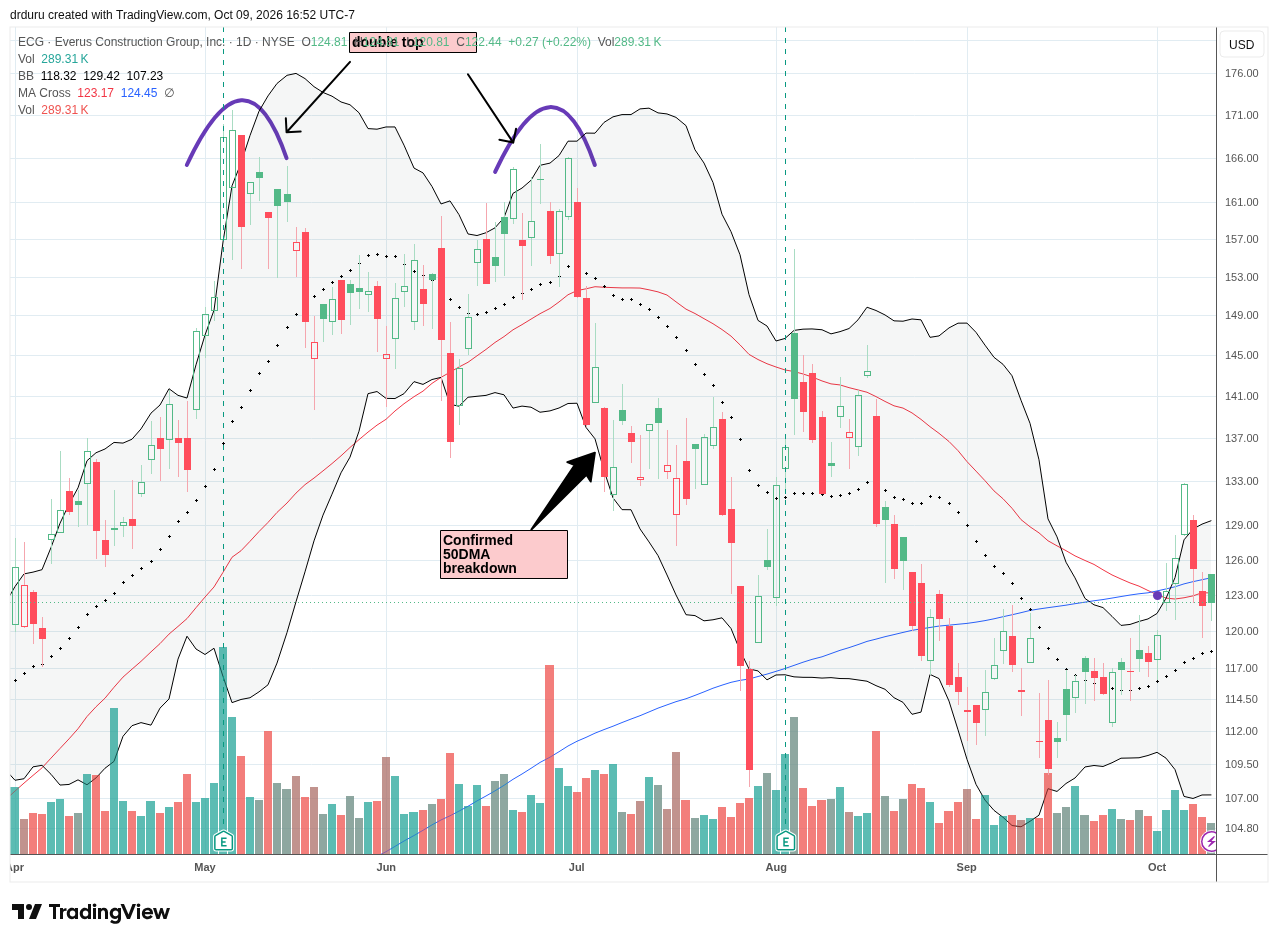
Technical Status: Everus Construction Group, Inc. (ECG) suffered a false breakout last week but held on to 50DMA support.
Trade Commentary: After ECG broke out above its 200DMA, I prepared to start buying the stock. As usual, I waited for the stock to cool off from its over-extension above its upper Bollinger Band. The subsequent pullback took the stock all the way back to 50DMA support and left behind a fake-out above the 200DMA. Still, if 50DMA support holds this week, I will buy back into shares.
Verizon Communications Inc. (VZ)
Description: Verizon Communications provides wireless communications, broadband and related telecommunications services to consumers and businesses.
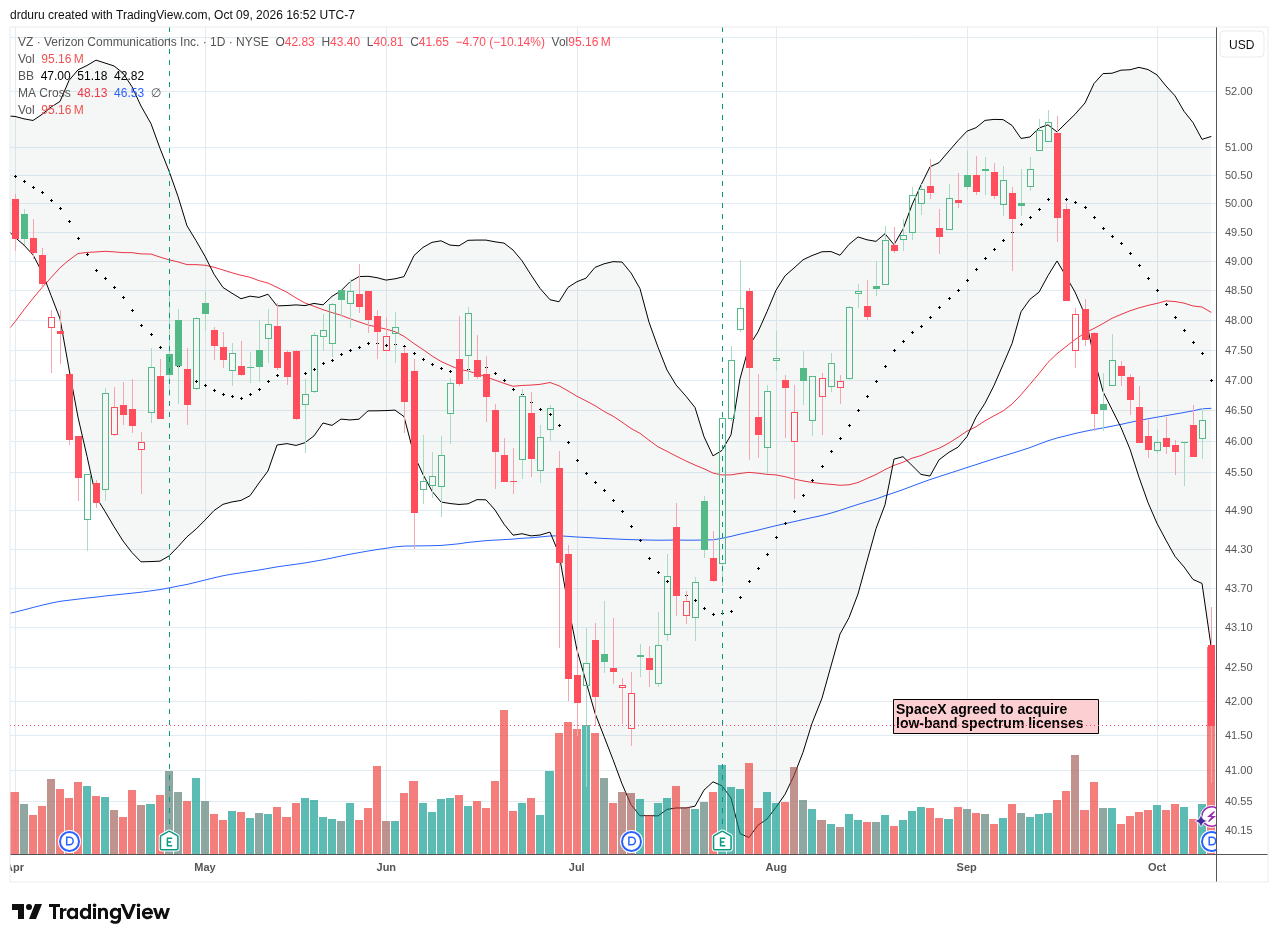
Technical Status: Verizon Communications Inc. (VZ) broke down below the 200DMA and crashed 10.1% amidst a SpaceX spectrum-license agreement, nearly finishing a reversal of January’s post-earnings surge.
Trade Commentary: VZ shares dropped roughly 9% after SpaceX agreed to acquire nationwide low-band spectrum from Grain Management, increasing the perceived long-term competitive threat from Starlink Mobile. AT&T and T-Mobile sold off as well, making this a sector event rather than a Verizon-specific problem. In the past, I have bought VZ shares on deep sell-offs and waited patiently for the eventual recovery, reinvesting dividends along the way. This time was different. While I think Friday’s 10.1% pullback is an over-reaction, I think the panic can last given the financial power SpaceX wields. VZ will “feel” better derisked if it fills its post-earnings gap up from January (around $40). Otherwise, I am fine watching from the sidelines.
Space Exploration Technologies Corp. (SPCX)
Description: Space Exploration Technologies develops launch vehicles, spacecraft and the Starlink satellite communications network.
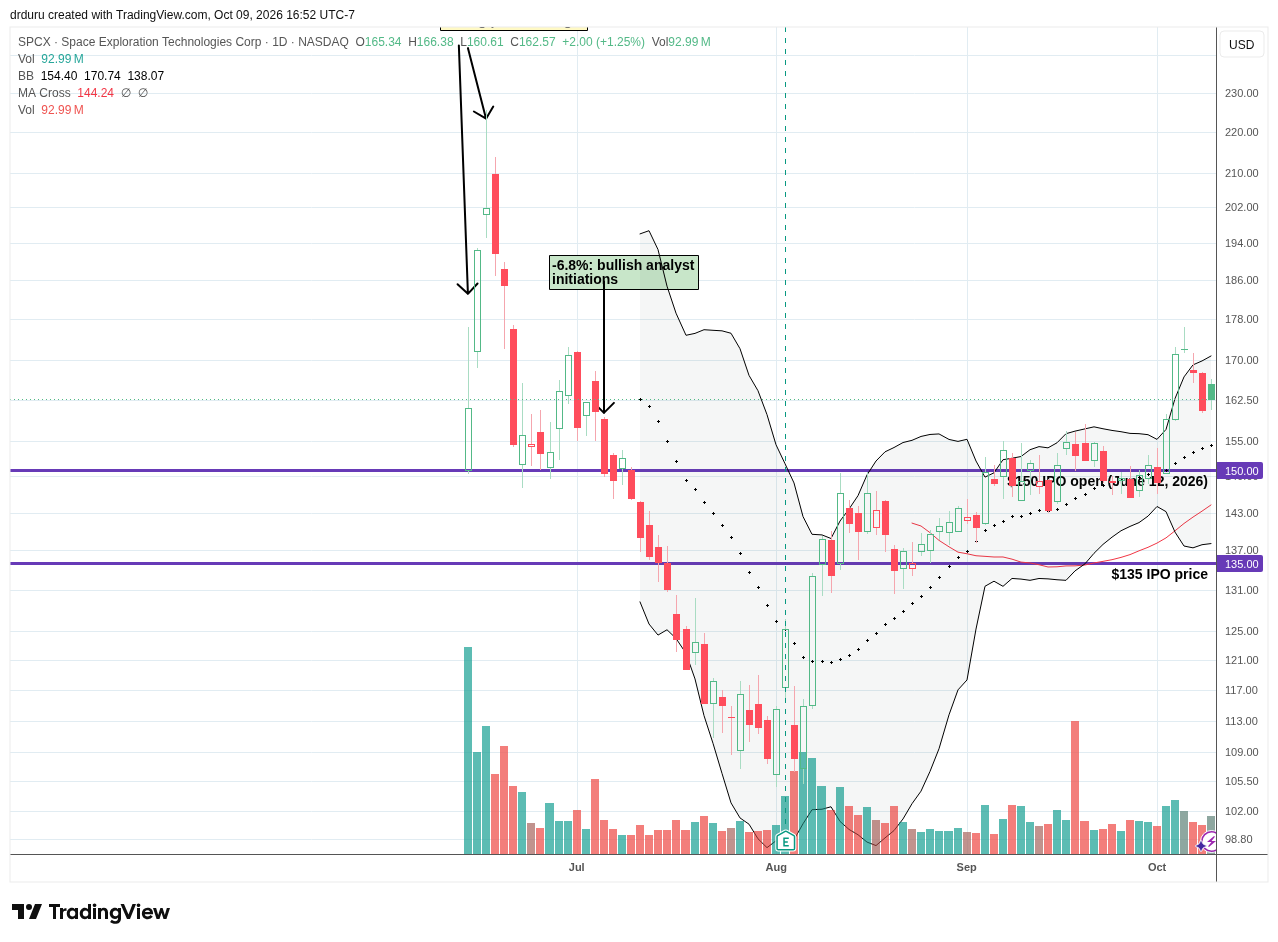
Technical Status: Space Exploration Technologies Corp. (SPCX) leapt away from its $150 IPO price but stalled right at its late June peak.
Trade Commentary: SPCX came alive starting in August. The stock lost 13.6% post-earnings and bottomed. Sentiment changed 180 degrees and quickly sent the stock above its IPO price, marking a bullish setup. SPCX spent most of September pivoting around its $150 post-IPO open while its 20DMA held as support. The momentum finally ended after a breakout created an evening star doji well above its upper Bollinger Band and right at the stock’s former peak. I still like the setup from a technical perspective but knowing more shares will soon unlock for insiders to sell keeps me tentative and only interested in short-term trades. A trade back to 20DMA support would be a buyable moment.
Accenture plc (ACN)
Description: Accenture is a global professional-services company providing consulting, technology implementation and managed services to enterprises and governments.
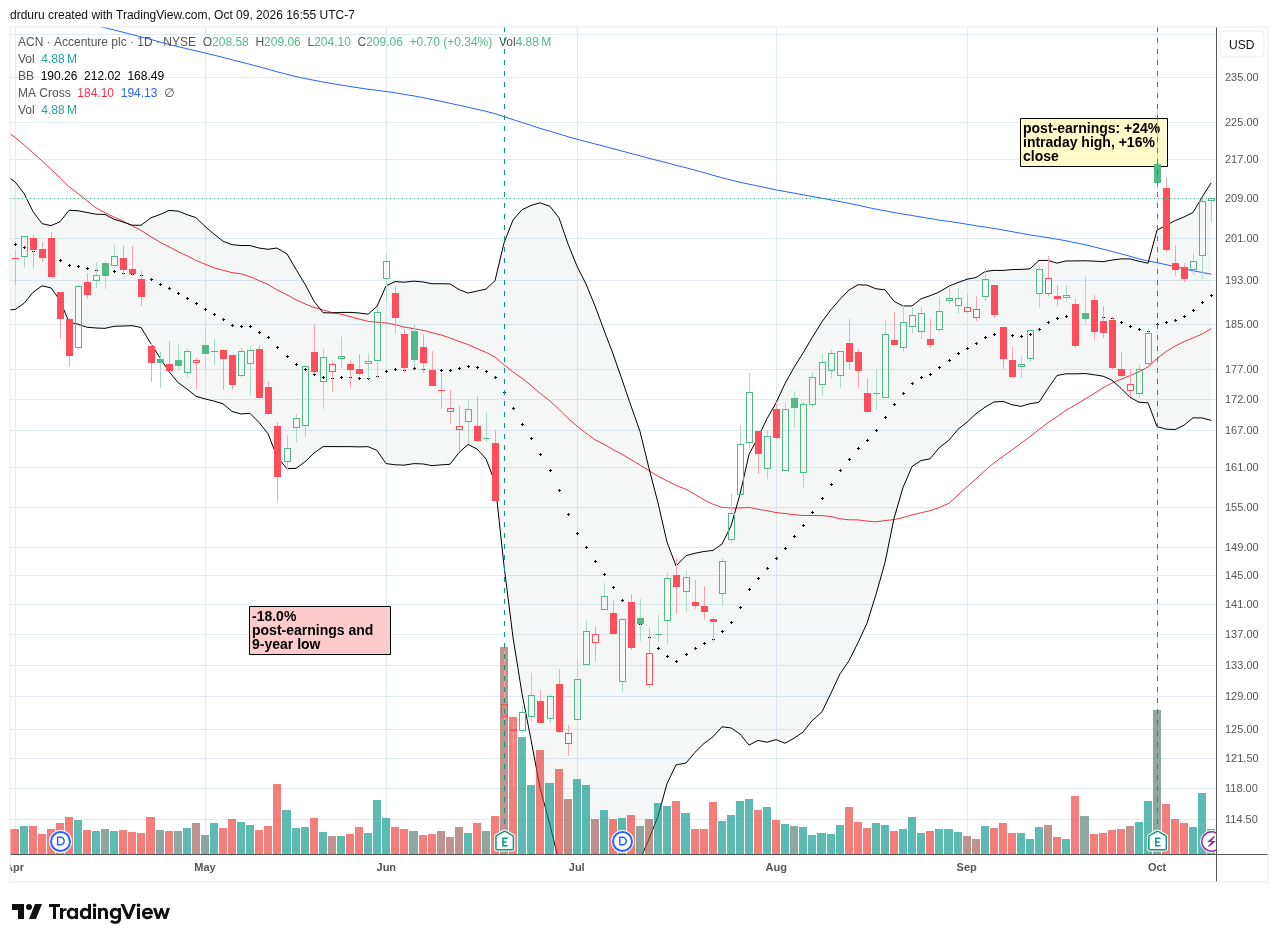
Technical Status: Accenture plc (ACN) confirmed 200DMA support after announcing an expanded partnership with DELL.
Trade Commentary: In my previous Market Breadth post, I conditioned a buy of ACN shares on holding 200DMA support. The technicals worked out perfectly, and I managed to get back into the stock just as buyers were getting excited about an expanded partnership with Dell Technologies (DELL), aimed at helping enterprises deploy private, hybrid and sovereign AI infrastructure. The stock now looks ready to resume its post-earnings momentum.
Starbucks Corporation (SBUX)
Description: Starbucks operates and licenses coffeehouses that sell coffee, beverages, food and related consumer products worldwide.
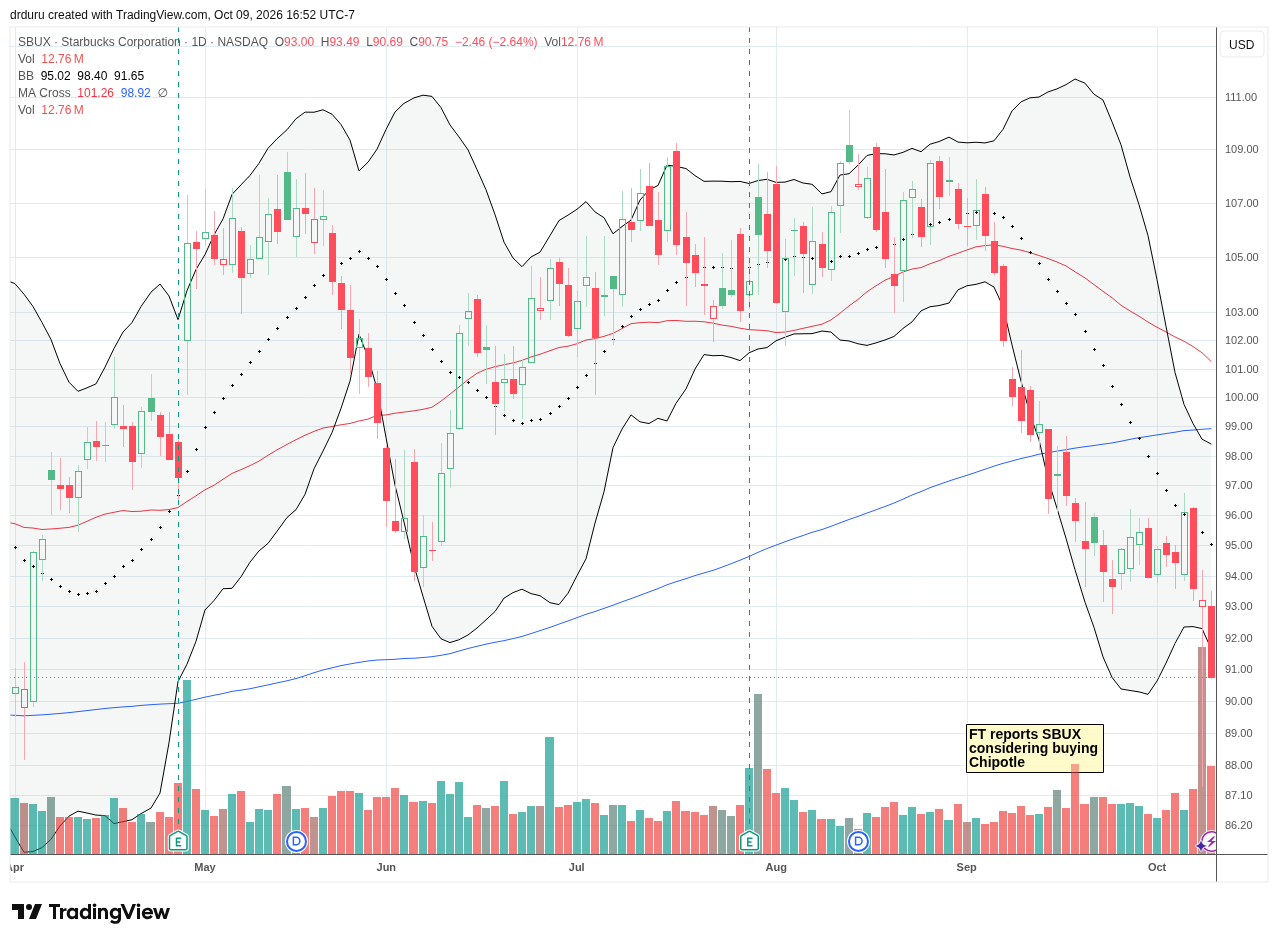
Technical Status: Starbucks Corporation (SBUX) confirmed downtrending 20DMA resistance with selling in the wake of rumors of SBUX interest in buying Chipotle.
Trade Commentary: SBUX fell last week in the wake of rumors that the coffee chain may try to acquire Chipotle (CMG). The deal seems to mainly make sense because CMG as a stock is struggling and the SBUX CEO used to be the CEO of Chipotle. SBUX flirted with all-time highs in August but soon succumbed to the selling that slammed so many consumer-facing stocks in September. The 200DMA breakdown put SBUX in a bearish position, but I am watching to see whether the lows from March hold as support and thus offer a contrarian buying opportunity. On Thursday, SBUX briefly traded below the March closing low.
Illumina, Inc. (ILMN)
Description: Illumina develops DNA sequencing systems, consumables and related genomic-analysis technologies used in research and clinical applications.
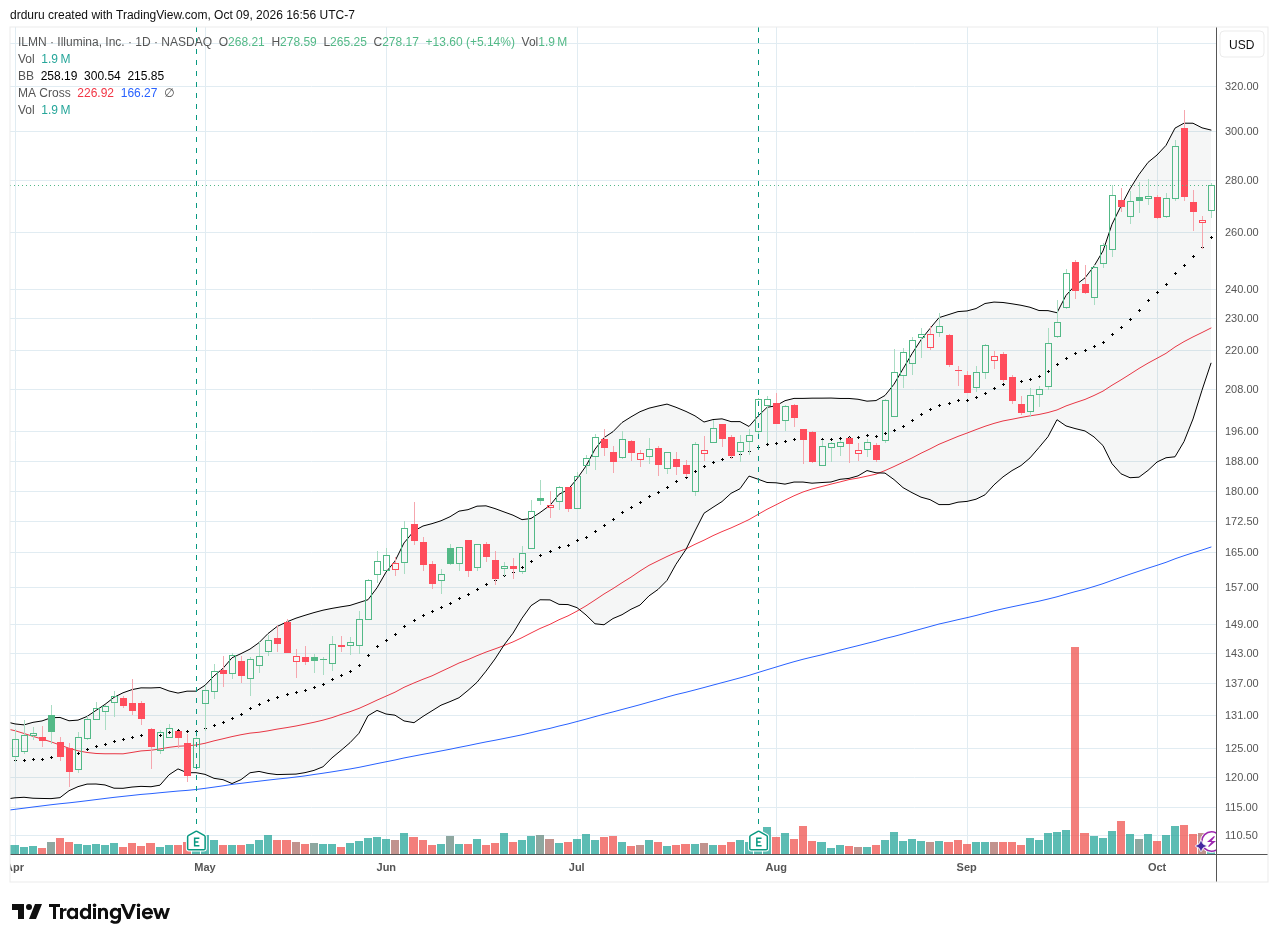
Technical Status: Illumina, Inc. (ILMN) sharply reversed a breakout but held uptrending 20DMA support.
Trade Commentary: In January, I made the case for a bearish to bullish reversal in ILMN. I already held shares at the time and sitting on them up until now has worked out quite well. I just wish I accumulated more shares along the way given my ILMN shares were sized as a “starter” position. Now, I am more interested in profit preservation. Accordingly, ILMN made me sit up straight when it suddenly reversed Monday’s 7.6% breakout with a 6.9% reversal. A spirited defense of 20DMA support encouraged me to continue hanging in there.
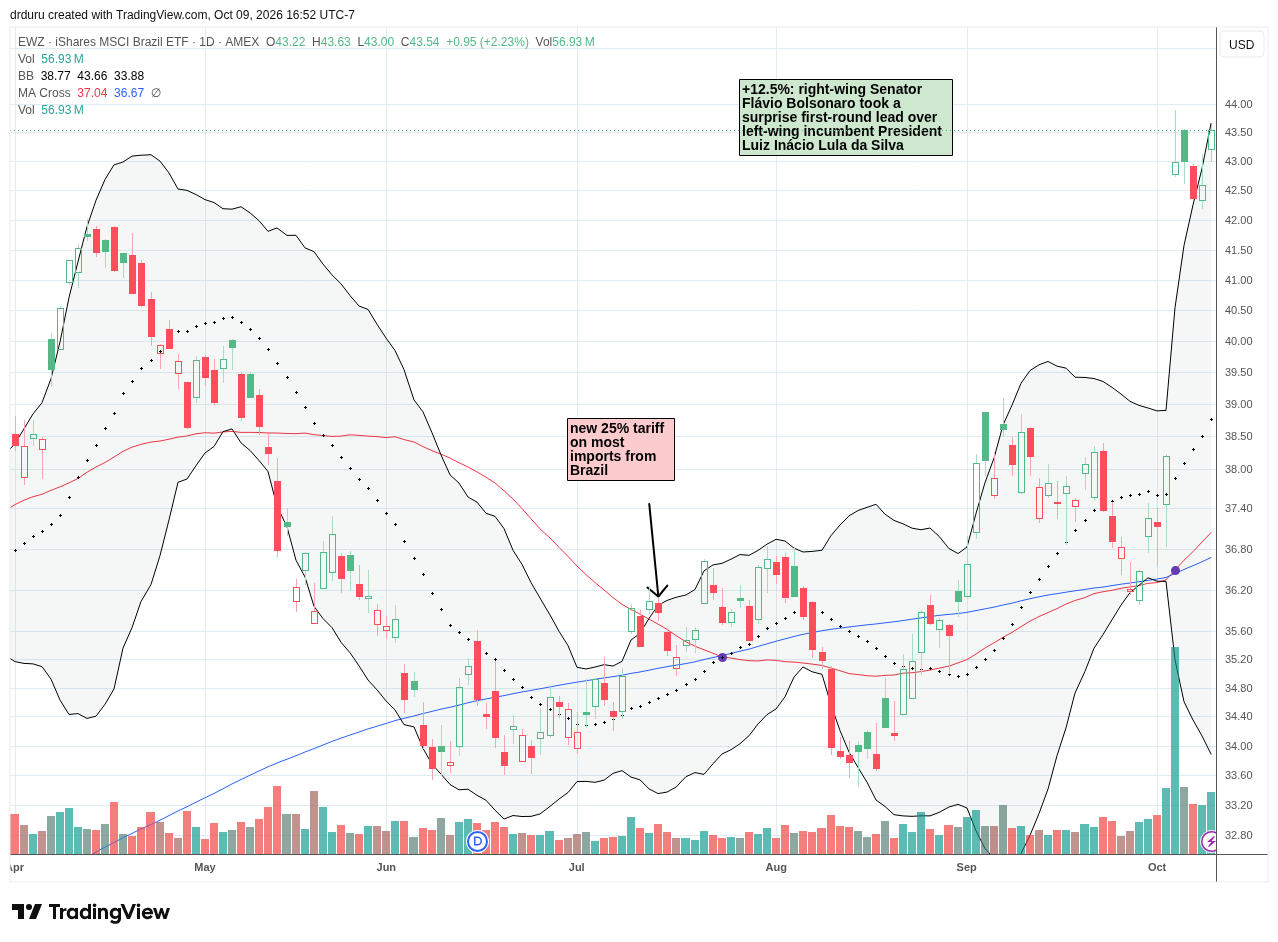
iShares MSCI Brazil ETF (EWZ)
Description: The iShares MSCI Brazil ETF provides exposure to a portfolio of large and mid-sized publicly traded Brazilian companies.
Technical Status: The iShares MSCI Brazil ETF (EWZ) skyrocketed 12.5% in the wake of political news and set a 6-year high.
Trade Commentary: In early September, I expressed concern that I would need to go into profit-protection mode in EWZ. Fortunately, the ETF held converged support at its 50DMA and 200DMA. The following week, Brazilian politics kicked EWZ into high gear. First-round presidential election results increased investor expectations for a more market-friendly fiscal and reform agenda in the Brazilian government. Since I am not in the business of anticipating political outcomes, I swiftly took profits. Now I wait for the next 20% pullback to buy.
Footnotes
Subscribe for free to get email notifications of future posts!
“Above the 50” (AT50) uses the percentage of stocks trading above their respective 50-day moving averages (DMAs) to measure breadth in the stock market. Breadth defines the distribution of participation in a rally or sell-off. As a result, AT50 identifies extremes in market sentiment that are likely to reverse. Above the 50 is my alternative name for “MMFI” which is a symbol TradingView.com and other chart vendors use for this breadth indicator. Learn more about AT50 on my Market Breadth Resource Page. AT200, or MMTH, measures the percentage of stocks trading above their respective 200DMAs.
Active AT50 (MMFI) periods: Day #306 over 20% (overperiod), Day #10 under 30% (underperiod), Day #22 under 40%, Day #23 under 50%, Day #39 under 60%, Day #279 under 70%
Source for charts unless otherwise noted: TradingView.com
Full disclosure: long SPY, long IWM calls, long INTC call, long CAT, long CHRW, long ANET, long CSCO, long ACN, long CMG, long ILMN
FOLLOW Dr. Duru’s commentary on financial markets via StockTwits, BlueSky, and even Instagram!
*Charting notes: Stock prices are not adjusted for dividends. Candlestick charts use hollow bodies: open candles indicate a close higher than the open, filled candles indicate an open higher than the close.
* Blog notes: I use ChatGPT to help with editing and news discovery.