

Housing Market Intro and Summary
In my previous housing market update, I described an enduring bear market in homebuilder stocks alongside weak sales, depressed builder sentiment, and constrained affordability. Unfortunately, that underlying story remains intact. Increasing pressure from higher mortgage rates, weakening builder sentiment, and stressed homebuilder stocks overshadows the month-over-month gains in housing starts and new-home sales which are both near the lows of multi-year ranges.
Here is a summary for September’s housing market update:
- Increasing pressure in the housing market pushed builder sentiment to a one-year low as more builders cut prices and increased their use of sales incentives.
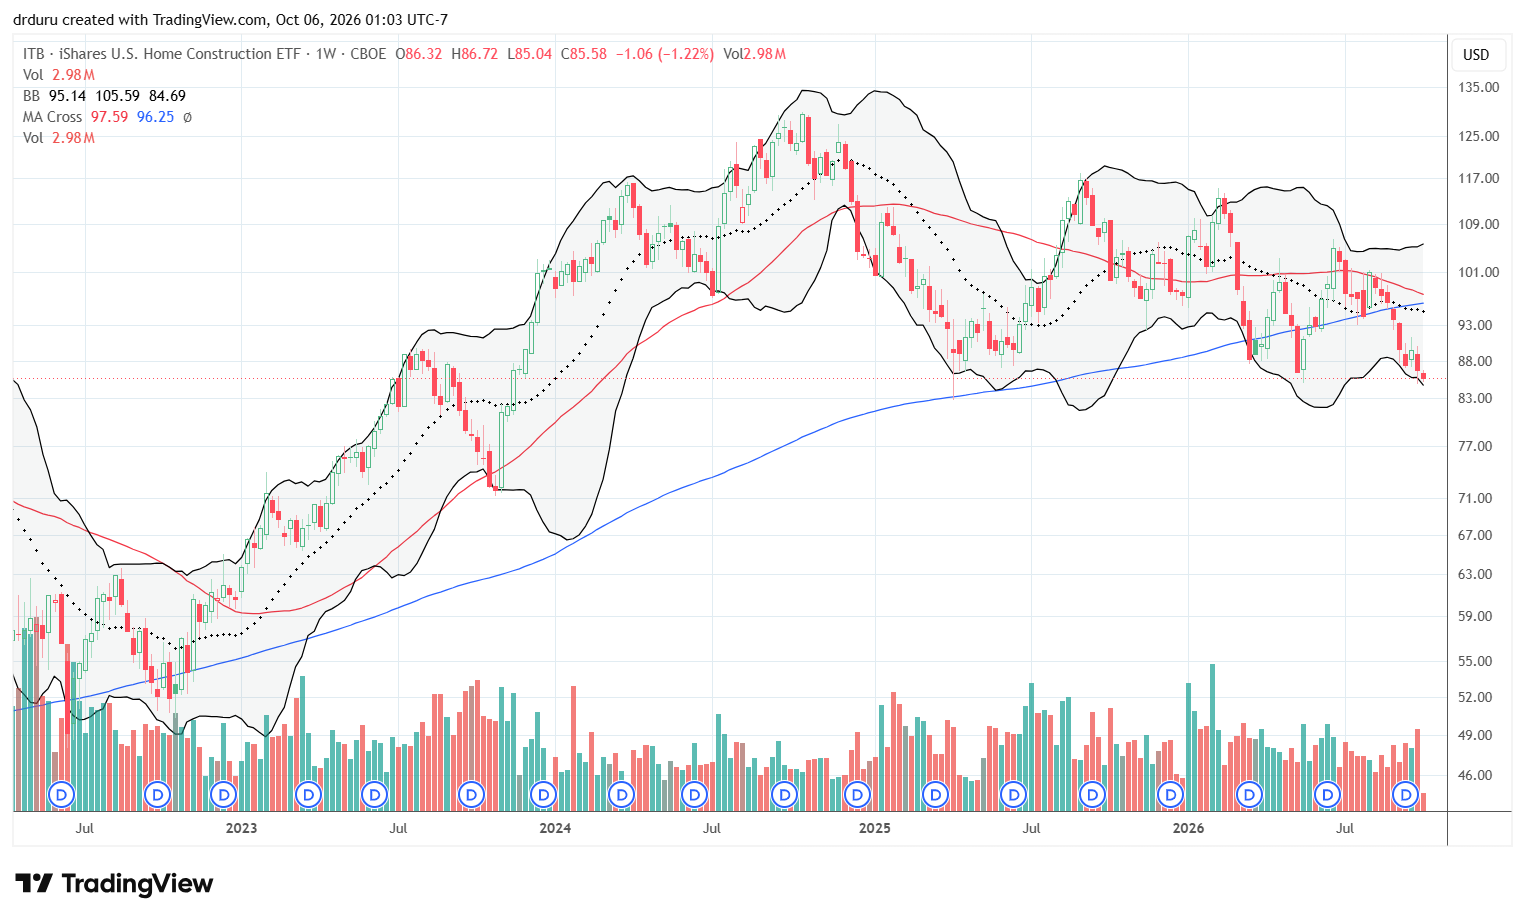
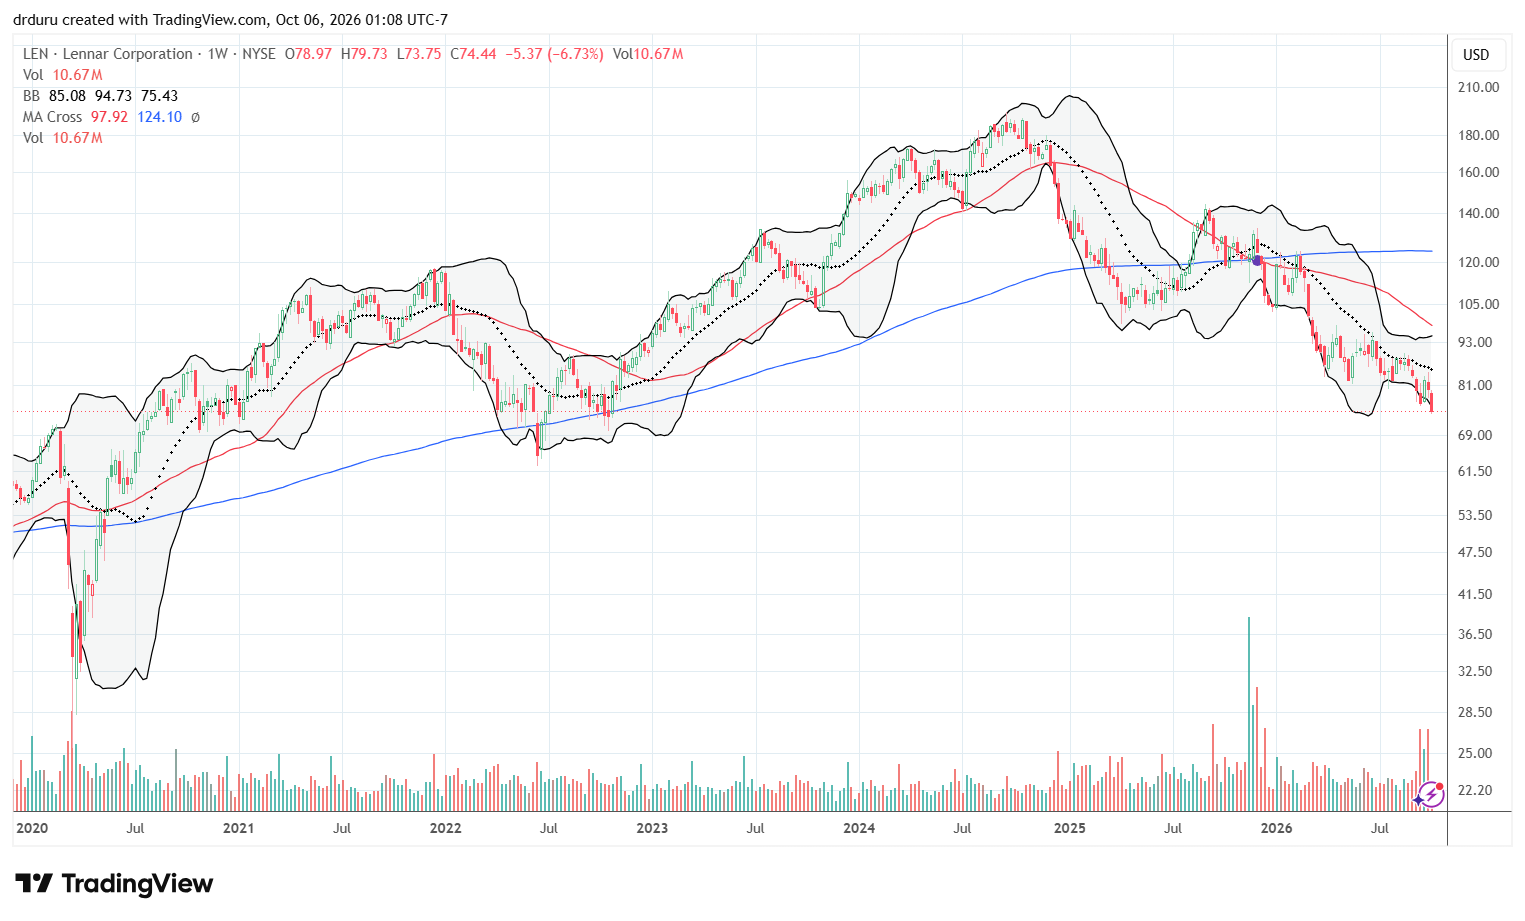
- Homebuilder stocks weakened sharply, with ITB trading near the bottom of its three-year range and major builder Lennar falling near a four-year low.
- Single-family housing starts and new-home sales increased month-over-month in August off recent lows, but weak permits and declining existing-home sales kept the broader housing picture mixed.
- Mortgage rates rose to 7.28% in September while mortgage applications weakened, adding another affordability headwind for buyers and builders.
Housing Stocks
The increasing pressure on the housing market shows up in the iShares U.S. Construction ETF (ITB). The weekly chart below shows ITB trading right at the bottom of a 3-year trading range. If ITB closes below 2025’s intraday low around $83, it could drop all the way to $72, the low from the summer of 2023.
Lennar Corporation (LEN) is one of the worst-performing builders in ITB. The weekly chart below shows LEN at its lowest point in 4 years, near the trough of the last bear market for housing. LEN’s selloff resumed this week despite Berkshire Hathaway stepping in to add shares to its growing holdings in publicly traded home builders.
I wrote three months ago that non-seasonal factors in the housing market are dominating the structural requirements for my annual seasonal trade on home builders. Thus, I am suspending the trade this year. Ironically, the current market juncture presents one of the best opportunities to launch the seasonal trade just based on the extreme discount on builders relative to the S&P 500. However, note that I have plenty of skin in the game. I currently still hold a core ITB position, and I have been nibbling on individual builders in the past several months: LGI Homes (LGI), D.R. Horton (DHI), and Century Communities (CCS). I wrote about my buying rule and rationale for CCS in “Buy and Wait on Century Communities.” I wrote about LGIH ahead of its Q2 earnings. Afterward, I decided to start buying the stock given its large potential upside in a better housing market. I do not expect any of these trades to look good until interest rates start coming down (which they will one day).
Housing Data
Home Builder Confidence: The Housing Market Index – September, 2026
The increasing pressure in the housing market pushed down the National Association of Home Builders (NAHB)/Wells Fargo Housing Market Index (HMI) by 3 points to 32 in September, a one-year low. Sentiment remained below 40 for the 17th straight month. The NAHB lamented a familiar laundry list of issues for builders: elevated mortgage rates, labor shortages and rising material costs. Higher gas and diesel prices are also part of the woes for builders. The NAHB also explained a source of the labor shortages: “builders report that increased immigration enforcement is discouraging legal workers from reporting to job sites.”
Two of the three components plunged, suggesting that the HMI will continue lower in coming months. The current sales HMI component decreased four points to 35 (a one year low), while future sales expectations dropped six points to 37 (a 3-1/2-year low). Prospective buyer traffic held steady at 23. This last component has been stuck in the low 20s for a year.
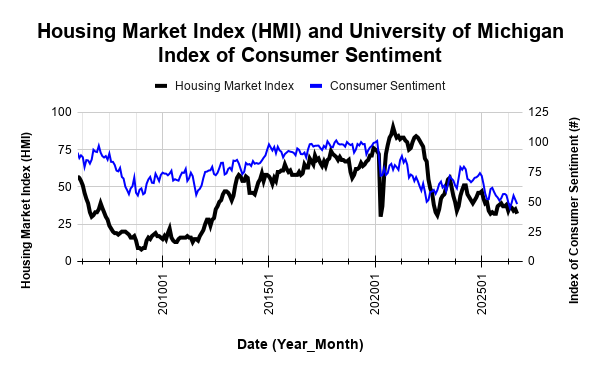
Source for data: NAHB and the University of Michigan
The rebound in consumer sentiment came to an end, preserving the broader downtrend. Given builder sentiment is stuck near recent lows, the two sentiment measures look set to converge again soon. (You can also review an interactive version of HMI at the NAHB website).
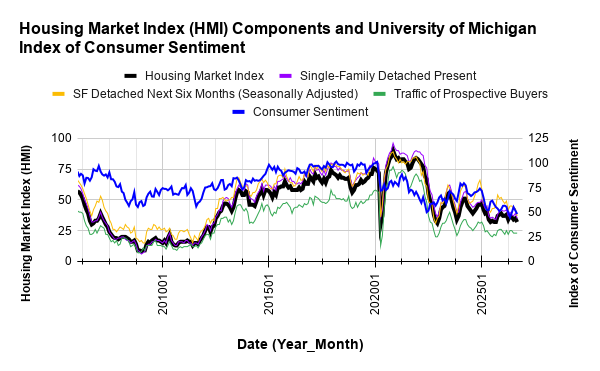
The share of builders cutting prices increased from 35% in August to 38% in September. The average price reduction remained at 6% for the sixth consecutive month. The use of sales incentives was 66% in September, up from 63% in August and its highest level since reaching 67% in December. Pricing’s increasing pressure on builders helps explain September’s plunge in the HMI.
While HMI plunged, the West managed to stand out as the one region of the four to actually benefit from an improvement in sentiment. The Northeast HMI plunged 7 points to 35, a 3-1/2 year low. The Midwest HMI dropped 4 points to the low of the year at 41. The South HMI dropped 4 points to a 1-year low at 29. The West HMI increased by 1 point to 29, it’s highest level since March.
New Residential Construction (Single-Family Housing Starts) – August, 2026
Single-family housing starts jumped from what has become the low of a multi-year range. August’s 918K in single-family starts represents a 7.6% month-over-month increase and a 5.2% year-over-year increase. These increases are surprising given the rising rate environment. Since the NAHB did not offer an explanation, I interpret the gains as part of a slow but consistent downtrend from the highs of 2020 and 2021. The series of lower highs points to an eventual break below the current 800K floor. A sustained volume of starts above the 1M level would invalidate the looming downtrend.
![US. Bureau of the Census, Privately Owned Housing Starts: 1-Unit Structures [HOUST1F], first retrieved from FRED, Federal Reserve Bank of St. Louis, September 27, 2026](https://drduru.com/onetwentytwo/wp-content/uploads/2026/09/20260927_Housing-Starts-August-2026.png "Housing starts")
As builders increased the pace of starts, permits remained around 3-year lows. Building permits (new privately-owned housing units authorized in permit-issuing places) have stalled out since June, 2025. Permits were 878K, a 1.8% month-over-month decrease from July and a 1.3% year-over-year increase. The sluggish activity in permits suggests starts will remain rangebound for now.
Starts were mixed across regions. Month-over-month the changes were -2.1%, 23.3%, -0.9%, and 28.6% for the Northeast, Midwest, South, and West respectively. Year-over-year the changes were mixed at -27.0%, 8.3%, 7.5%, and 7.6% for the Northeast, Midwest, South, and West respectively.
New Residential Sales (Single-Family) – August, 2026
New home sales surprisingly increased in August. The NAHB rightfully cautioned that the monthly gain occurred despite ongoing affordability challenges, especially given higher mortgage rates. Sales rose 6.4% from July’s sales of 643K to 684K in August. Year-over-year sales declined 2.0%. The sequential increase in the market for new homes follows revised numbers for July and still leaves sales near the pandemic low and stuck in a tight range in place since 2021.
![US. Bureau of the Census, New One Family Houses Sold: United States [HSN1F], first retrieved from FRED, Federal Reserve Bank of St. Louis, October 4, 2026](https://drduru.com/onetwentytwo/wp-content/uploads/2026/10/20261004_New-home-sales-August-2026.png "new home sales")
For August, the median price for new homes increased 0.4% sequentially and decreased 5.8% year-over-year to $393,700. As is often the case, the shift in prices coincided with a shift in the sales mix. The entire increase in sales occurred under the $500,000 price level.
Sales of homes priced over $1M decreased from 6% to 4% of sales and were also down from 7% a year ago. The lowest price tier, under $300,000, experienced a jump in share from 19% in July to 22% in August, and a large increase from 18% a year ago. The $400,000 to $499,999 tier increased from 18% to 22% of sales, also a large jump from 19% a year ago. The $300,000 to $399,999 tier dropped in share from 34% to 30%, but still an increase from 28% a year ago.
July’s inventory was 9.0 months of sales. August’s inventory decreased to 8.5 months of sales compared to 8.5 months a year ago. Absolute inventory was unchanged from July at 483K but down from 493K a year ago.
The Northeast, Midwest, South, and the West changed -20.7%, +22.5%, +3.4%, -26.8% respectively year-over-year. Sequentially, the Northeast, Midwest, South, and the West changed -36.1%, +84.9%, +6.9%, -15.2% respectively. The wide swings and variety in regional changes continue to align with the high degree of uncertainty in the aggregate estimate.
Existing Home Sales – August, 2026
The National Association of Realtors (NAR) chose a positive perspective on the decline in existing home sales. The NAR noted that “mortgage rates and home sales move in opposite directions” and sales are up 1.8% year-over-year for the year-to-date period through August.
The NAR reported that existing home sales decreased 2.0% month-over-month to 3.98M and 1.2% year-over-year.
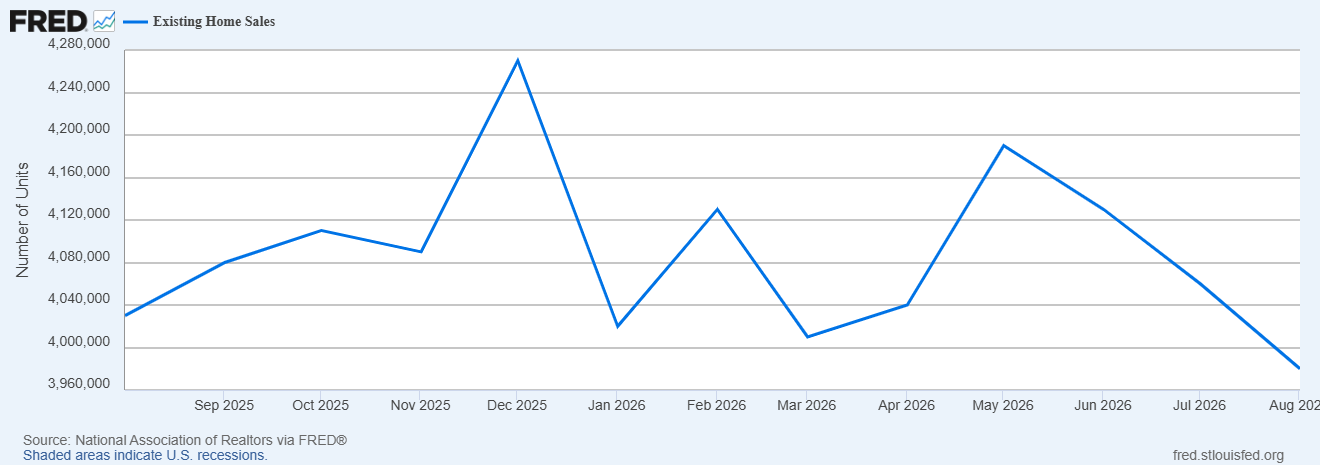
(For historical data from 1999 to 2014, click here. For historical data from 2014 to 2018, click here) Source for chart: National Association of Realtors, Existing Home Sales© [EXHOSLUSM495S], retrieved from FRED, Federal Reserve Bank of St. Louis, October 4, 2026
The Northeast, Midwest, and West were at sales levels at or below their pandemic troughs. There were regional negative changes in the Northeast, Midwest, and West. The regional year-over-year changes were: Northeast -2.0%, Midwest -2.1%, South unchanged, West -2.7%.

{Condo and co-op sales decreased 2.7% month-over-month and 2.7% year-over-year, while the median price increased 1.5% year-over-year to $371,600.}
At an aggregate level, the NAR’s Housing Affordability Index improved from 101.2 a year ago to 104.7. Each region also experienced healthy gains in year-over-year affordability: Northeast +0.5%, Midwest +1.7%, South +4.5%, West +5.9%. The improved affordability contrasts with the overall narrative about an affordability crisis. For example, the Federal Reserve Bank of Atlanta’s Affordability Index is at its lowest level since the index started in 2005. Thus, the NAR’s metric seems poorly calibrated to the actual buying experience on the ground. For example, mortgage rates are up year-over-year from 6.59% to 6.67%. Moreover, the median price increased 1.6% year-over-year for the 38th consecutive month. The main positive supporting affordability is the 3.1% year-over-year wage growth in August. However, this is an average. I would like to see a disaggregated representation of affordability. The combination of higher mortgage rates and higher prices adds to the increasing pressure on housing affordability.
The median sales price of an existing home was $429,100 in August, up 1.6% from one year ago ($422,400). August marked the 38th consecutive month of year-over-year price increases.
Total housing inventory in August was 1.62M units, up 3.2% from July and up 5.9% from August 2025. The NAR reported a 4.9-month supply of unsold inventory, up from 4.6 months last month and up from 4.6 months one year ago. The expensiveness of the market showed up in rising prices even as inventory increased significantly. Again, the improvement in the affordability index seems out of place and poorly calibrated.
The REALTORS® Confidence Index showed a median time on market of 31 days in August, up from 29 days in July and unchanged from 31 days in August 2025.
The NAR also reported that first-time homebuyers represented 30% of sales (up from 29% in July and up from 28% one year ago).
Single-family existing home sales decreased 1.9% month-over-month in August to a seasonally adjusted annual rate of 3.62M and decreased 1.1% year-over-year. The median price of a single-family home was $434,800, an increase of 1.7% from a year ago.
California Existing Single-Family Home Sales – August, 2026
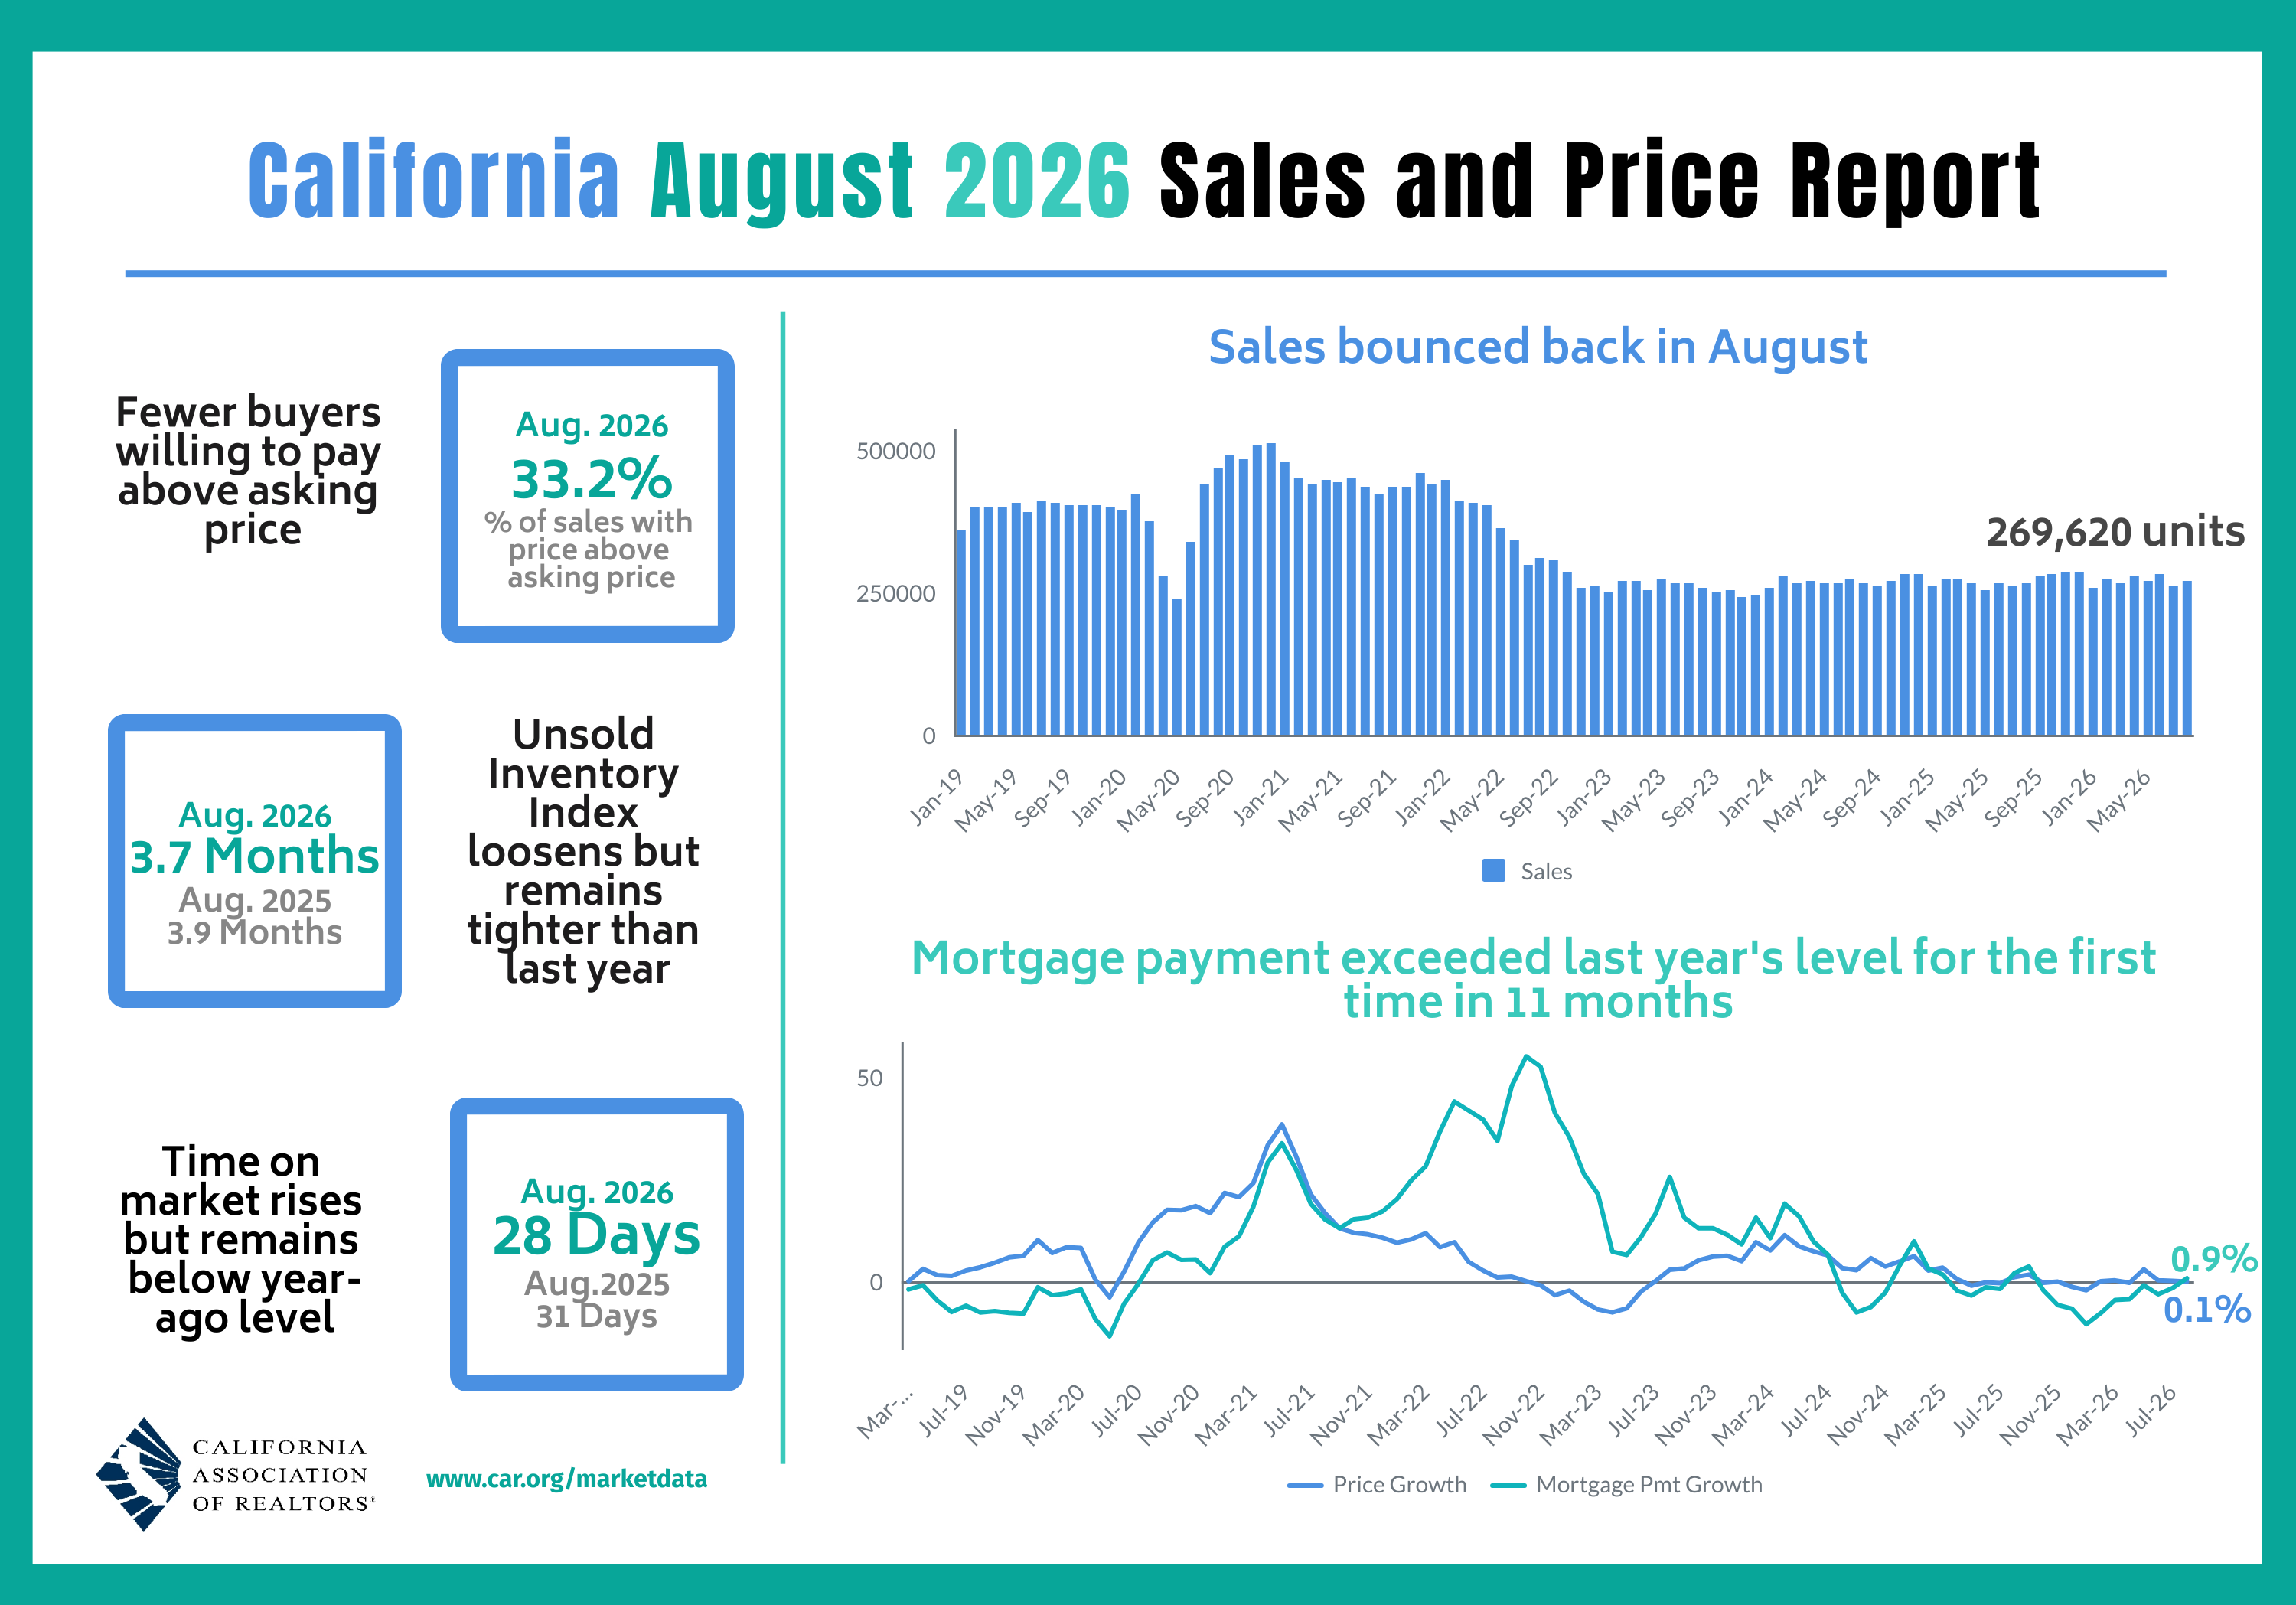
California existing home sales increased in August. The California Association of Realtors (C.A.R.) reported that existing single-family home sales increased sequentially 2.4% in August to 269,620, up 1.4% year-over-year, in complete contrast to the national averages. The C.A.R. did not provide any specific explanations for August’s jump in sales. The C.A.R. noted that sales increased year-over-year in 28 of the 53 counties tracked, including 17 with double-digit gains. Sales of homes valued above $1M declined from a 35.5% share in July to 35.2% in August. The organization attributed softer housing demand to higher mortgage rates and economic uncertainty. The C.A.R. expects that higher mortgage rates and economic uncertainty could remain headwinds in the near term, while the end of the peak homebuying season could further soften demand.
The median price increased 1.6% month-over-month and 0.1% year-over-year to $901,420. This price increase followed July’s $887,210 median with the declining share of million-dollar home sales indicating that the monthly increase was not driven by a larger share of high-end sales. The median price per square foot was $428, up from $427 a year ago. The sales-price-to-list-price ratio was 98.9% in August, up from 98.3% a year ago.
August’s unsold inventory index (UII), which measures the number of months needed to sell the supply of homes on the market at the current sales rate, increased from July and declined from 3.9 months in August 2025 to 3.7 months in August 2026. Total active listings fell 1.6% from July 2026 and fell 6.2% year-over-year. So, supply conditions were mixed but leaned toward tightness as sales activity picked up. The median time on market even declined from 31 days a year ago to 28 days.
Georgia’s Housing Market – August, 2026
{No data published for August}
Home closing thoughts
Beyond the monthly data, several housing-related developments continue to shape affordability, supply, and market structure. Below are some of the more notable stories that caught my interest over the last month or so.
Federal Reserve Governor Michael S. Barr on “A Long-Term View on the Costs of Shelter”
In late September, Federal Reserve Governor Michael S. Barr spoke at the “Housing Affordability 2026: A Community Development Summit,” hosted by the Federal Reserve Bank of Chicago, Chicago, Illinois. His speech started with an explanation of the rationale behind the Fed’s rate hike earlier that month. Barr suggested that more rate hikes would be necessary to bring inflation down to target. Barr’s prognosis means that mortgage rates are likely to go even higher, and the housing market will remain stuck for quite some time to come. Ever higher mortgage rates add to the affordability pressures that Barr discussed: 1) housing costs far outpacing wage growth from 2000 to 2024, 2) a severe deficit in housing supply from 2 to 5.5M housing units, 3) higher mortgage rates, 4) higher insurance costs, 5) and higher property tax rates.
For solutions, Barr focused on the institutional levers that the Federal Reserve supervises. He described how The Community Reinvestment Act (CRA), enacted in 1977, supports housing for low and middle-income families. Barr noted that “the Fed is responsible for administering the act for banks we supervise.” He also spoke optimistically about the potential for private-public partnerships and non-political collaboration across the country’s mayors to devise solutions for and reduce obstacles to housing affordability.
Housing Protests in Madrid, Spain
Housing affordability challenges are global. Spain recently experienced mass protests over housing policy after an elderly woman was evicted from her home in Madrid. The protests pushed Spain’s Prime Minister to call for snap elections.
Spotlight on Mortgage Rates
The Mortgage Bankers Association (MBA) reported four weeks with a decrease in mortgage applications and only one weekly increase for the month of September. For all of August, new home purchase mortgage applications decreased 5.5% year-over-year and dropped 6% sequentially (not seasonally adjusted). While the month-over-month number is not seasonally adjusted, I am surprised to see such a large drop when new home sales increased significantly over this time. The unadjusted new sales number increased 7.5% while the seasonally adjusted new sales number increased 6.4%. This divergence makes me expect downward revisions to the new home sales number.
Mortgage rates accelerated higher in September. At 7.28%, the 30-year mortgage rate is back to levels last seen almost 3 years ago, a full 4 months after the Fed’s last rat hiking cycle came to an end. The increasing pressure from mortgage rates is also showing up in homebuilder stocks, with ITB trading at levels also last seen almost three years ago.
![Freddie Mac, 30-Year Fixed Rate Mortgage Average in the United States [MORTGAGE30US], retrieved from FRED, Federal Reserve Bank of St. Louis; October 4, 2026.](https://drduru.com/onetwentytwo/wp-content/uploads/2026/10/20261004_30-Year-Fixed-Rate-Mortgage-Average.png)
Be careful out there!
Full disclosure: long ITB