
The Market Breadth Summary: Nearly Broke
- Rising Treasury yields nearly broke market breadth early in the week before stocks rebounded as interest-rate pressure temporarily eased.
- The S&P 500 held above 50DMA support while the NASDAQ successfully tested its 50DMA, but small caps remained notably weaker as rate-sensitive stocks struggled.
- Divergences widened across equities as Snowflake surged after earnings, Broadcom and Ciena weakened, Robinhood broke to a new yearly high, and lululemon plunged to an eight-year-plus low.
- The short-term trading call remained cautiously bullish, but renewed pressure from higher rates and fragile breadth left the market precariously dependent on support levels holding.
The Stock Market Summary
I am surprised that the stock market ended the week as well as it did given that early in the week rising interest rates nearly broke market breadth. Rising treasury yields followed higher oil prices and a worldwide sell-off in sovereign debt. The benchmark U.S. 10-year Treasury yield rose to its highest level since early 2025. The pressure pushed down rate sensitive stocks enough to force market breadth under a critical support level (more on that move below). However, a rebound in stocks began Wednesday and picked up steam on Thursday after Fed Governor Christopher Waller indicated he could support holding rates steady if inflation continued improving. A much stronger than expected August jobs report put higher rates right back into focus even though wage growth was soft relative to inflation. Friday’s August employment report showed that nonfarm payrolls increased by 162,000, while unemployment remained at 4.1%. The tensions between economic data, bonds, and stocks have created notable divergences as the market looks for a refreshed narrative to maintain bullish momentum.
S&P 500 (SPY)
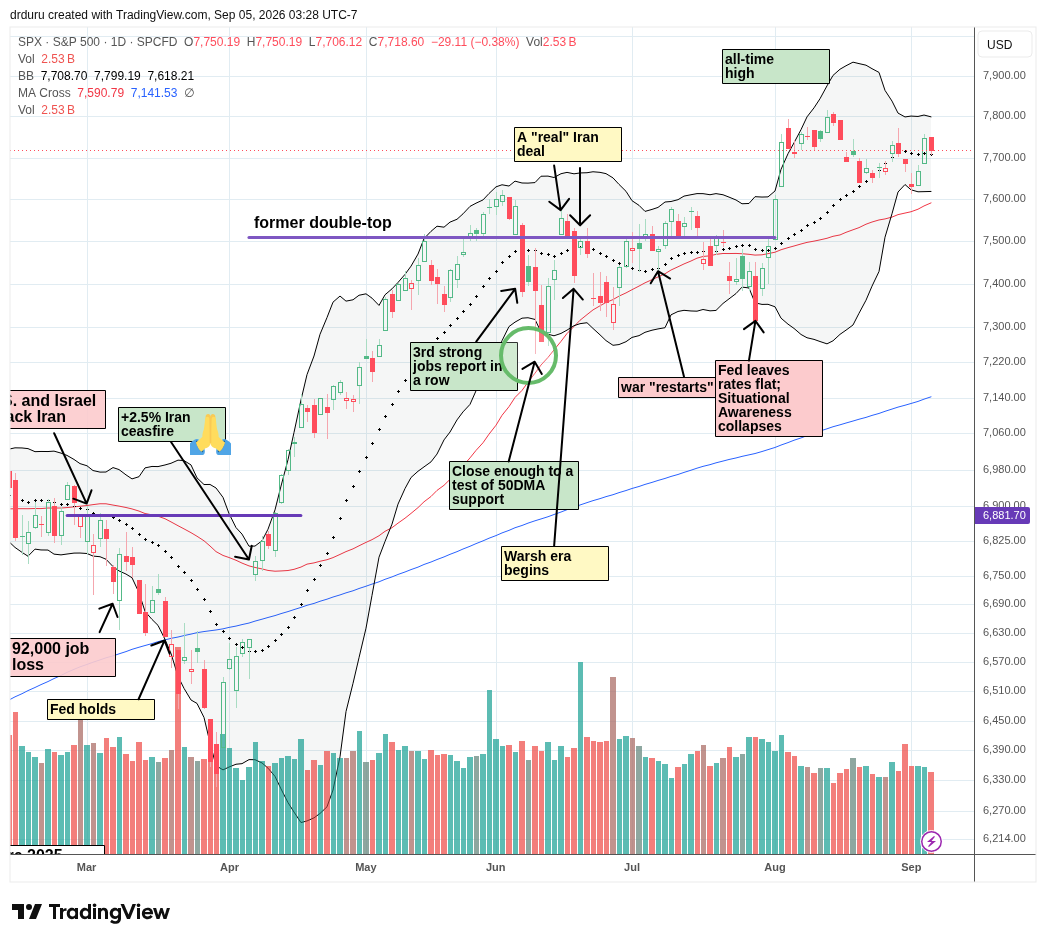
The S&P 500 (SPY) gained fractionally for the week after stopping short of testing support at its 50-day moving average (DMA) (red line). Thursday’s 1.1% gain to the high of the week rode the interest rate relief provided by Christopher Waller. The index has churned since the big sprint higher after hedge fund Situational Awareness washed itself out of the public markets. While September is the second of the three most dangerous months in the stock market, the S&P 500 looks like it is consolidating in preparation for the next leg higher.
NASDAQ (COMPQ)
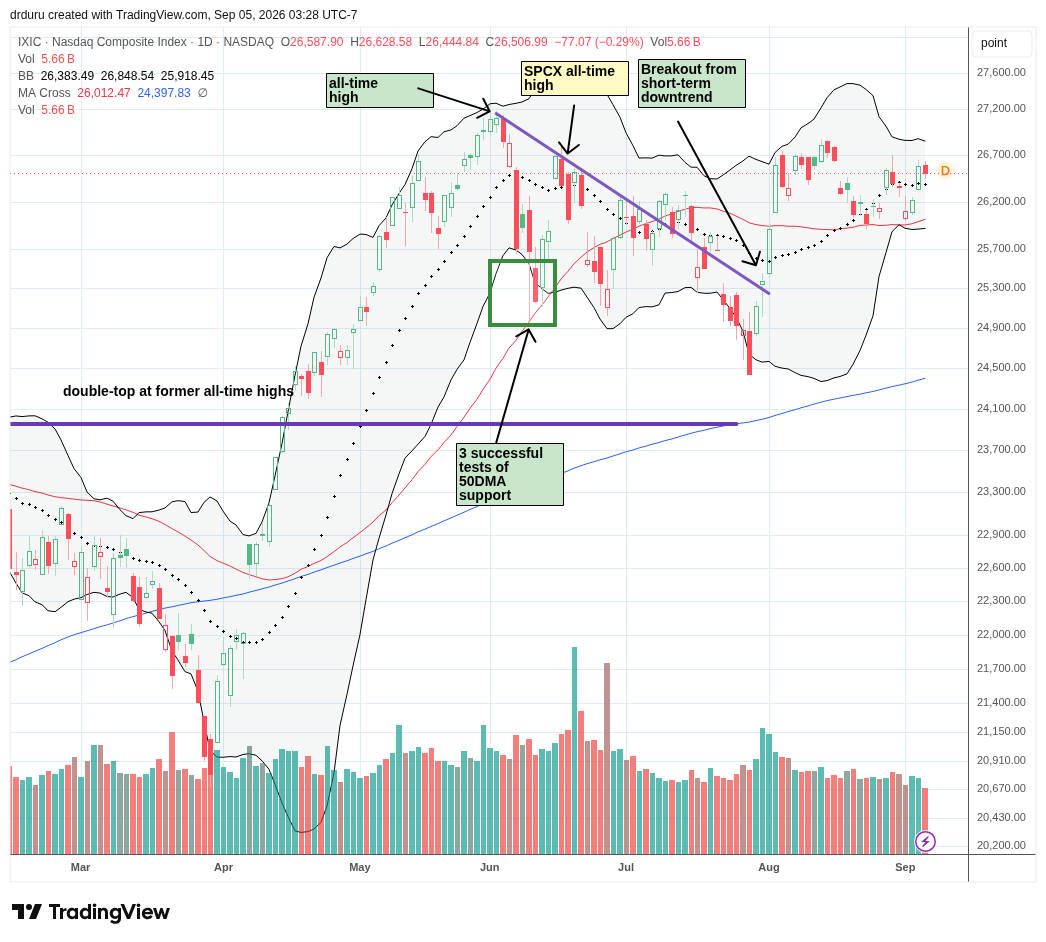
The NASDAQ (COMPQ) looks quite similar to the S&P 500 except the tech-laden index has managed to test its 50DMA support. Two successful tests in a month make the NASDAQ’s price consolidation look even more like a coiled spring. However, the NASDAQ last printed an all-time high in May, so the next rally may slow or stall around 27,200 even as the S&P 500 moves higher.
iShares Russell 2000 ETF (IWM)
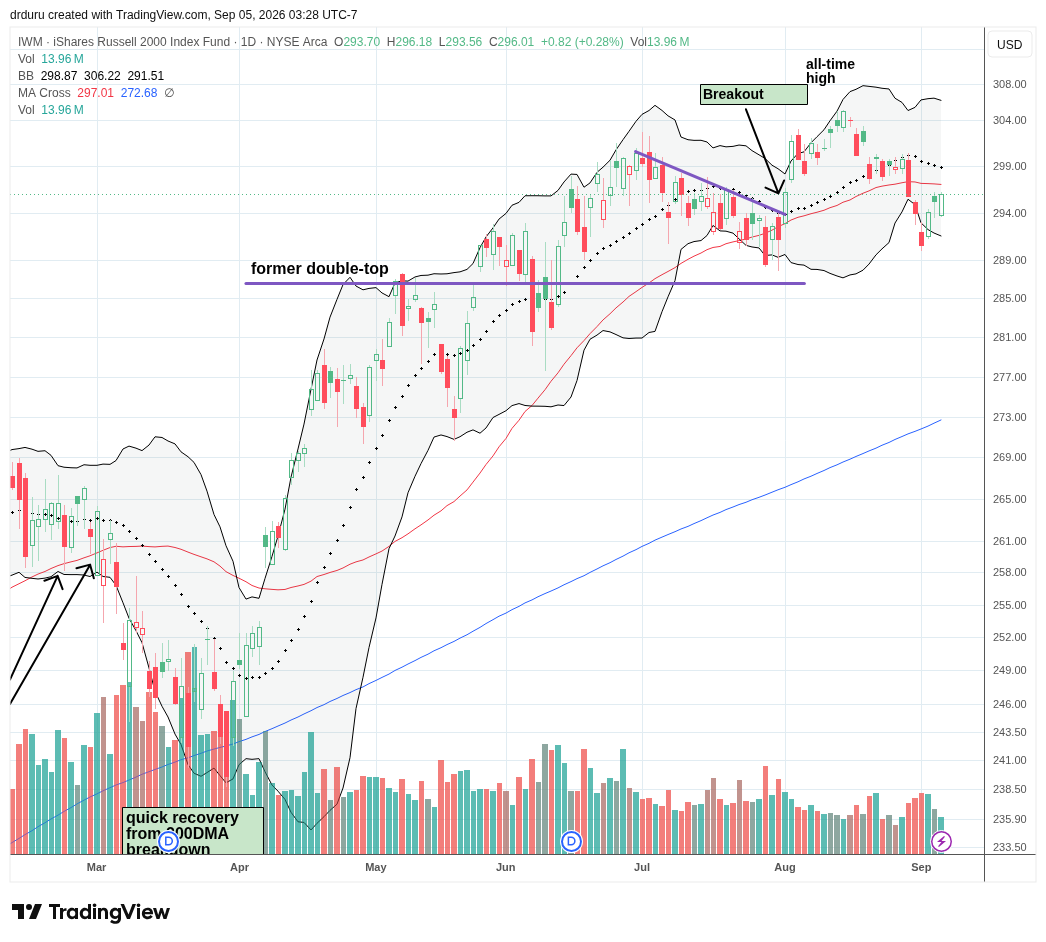
The iShares Russell 2000 ETF (IWM) was most visibly impacted by the higher rates early in the week. The ETF of small caps sliced right through 50DMA support the previous Friday and continued lower for two more days. On Tuesday, IWM was so stretched below its lower Bollinger Band (the black curved line that helps bracketed price volatility around the 20DMA (dashed line)) that I jumped into IWM $295 calls expiring the following Friday. I took profits on the rebound the next day rather than wait to see the trading action around 50DMA resistance or risk a big reversal after the Labor Day weekend.
As divergences unfold between rate sensitive stocks like the small caps in IWM and the S&P 500, the underlying health of the stock market is once again at risk. Market breadth will be in focus for at least the coming week.
The Short-Term Trading Call After Market Breadth Nearly Broke
- AT50 (MMFI) = 50.3% of stocks are trading above their respective 50-day moving averages
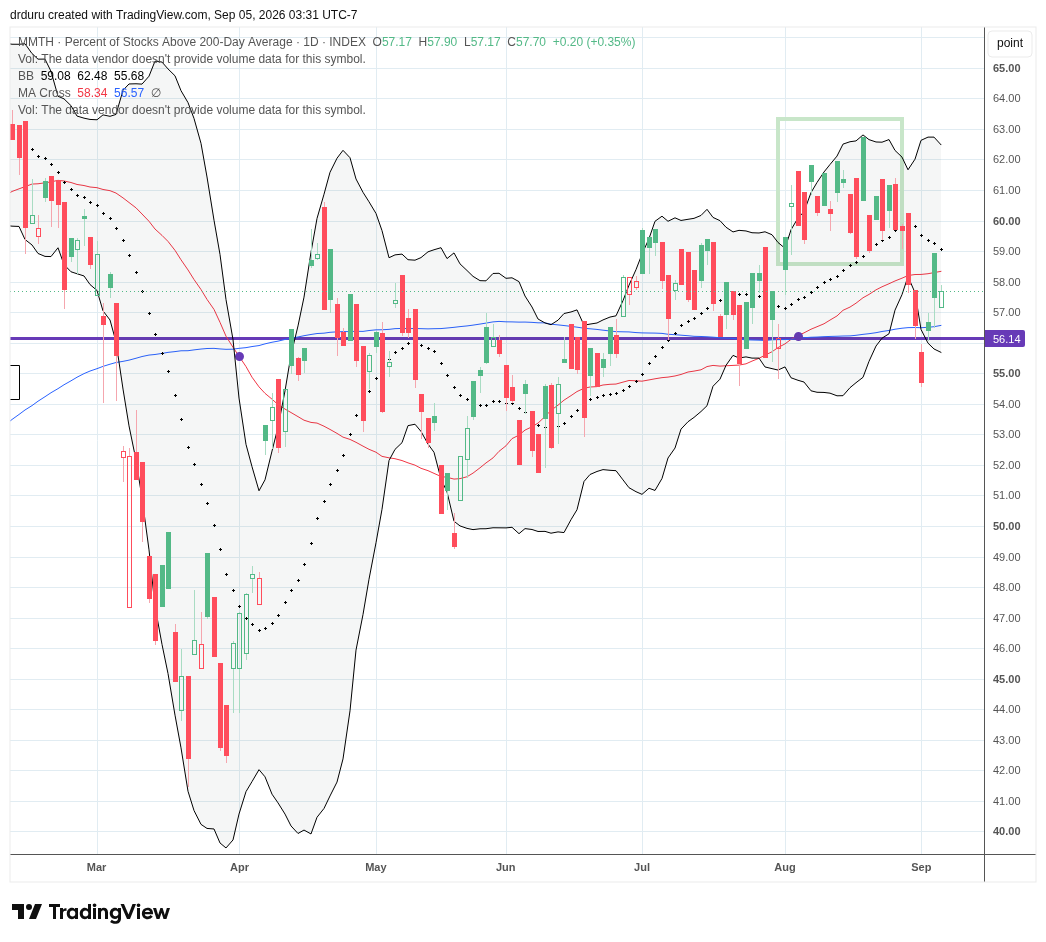
- AT200 (MMTH) = 57.7% of stocks are trading above their respective 200-day moving averages
- Short-term Trading Call: cautiously bullish
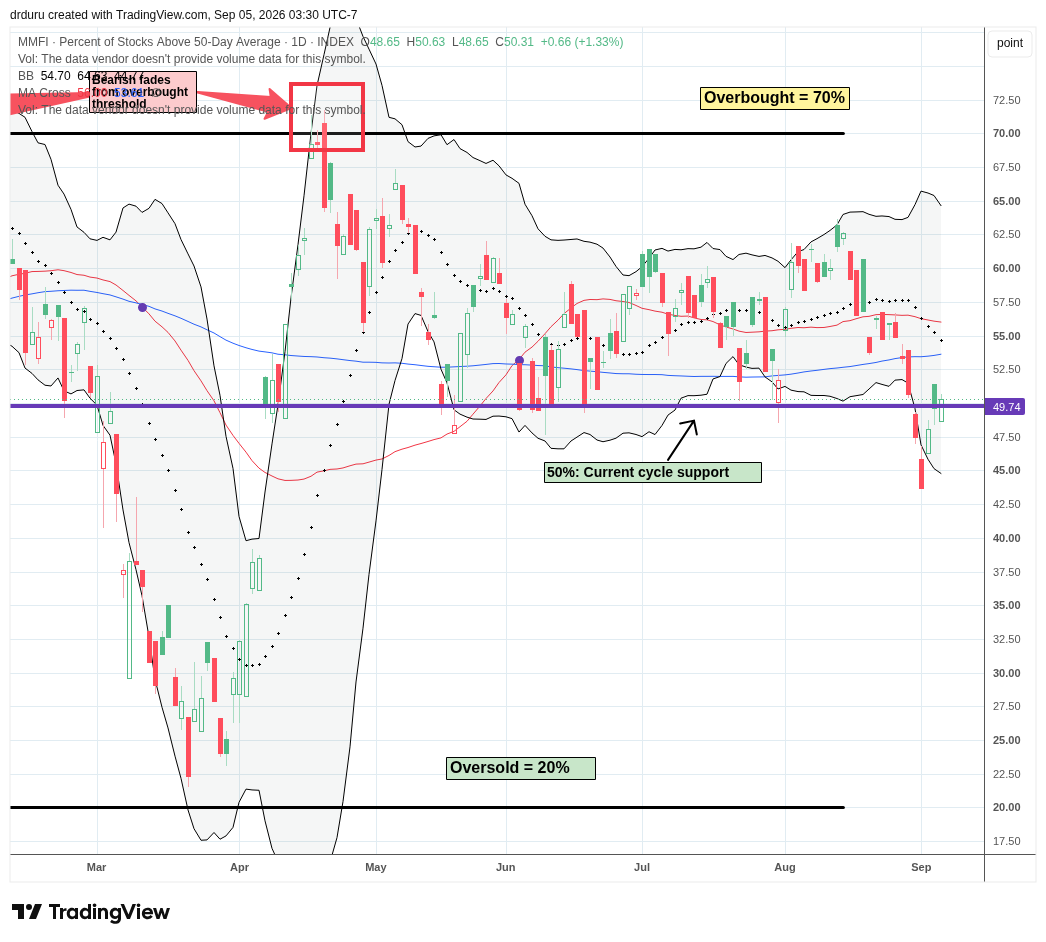
AT50 (MMFI), the percentage of stocks trading above their respective 50DMAs, closed the week at 50.3%.
My favorite technical indicator nearly broke last week but closed almost flat after slicing through critical 50% support on Monday and continued lower on Tuesday. Given my plan to flip neutral on the stock market on such a breakdown, I braced for more bearish trading action. Instead, a rebound ensued as soon as interest rates stopped rising. Friday’s strong jobs report brought the revival to a halt. Now AT50 looks set to pivot around the 50% level.
AT200, the percentage of stocks trading above their respective 200DMAs, nearly broke as well after plunging below its 56% pivot line. The subsequent rebound was as sharp as the sell-off. Thus, longer-term health for market breadth remained stable.
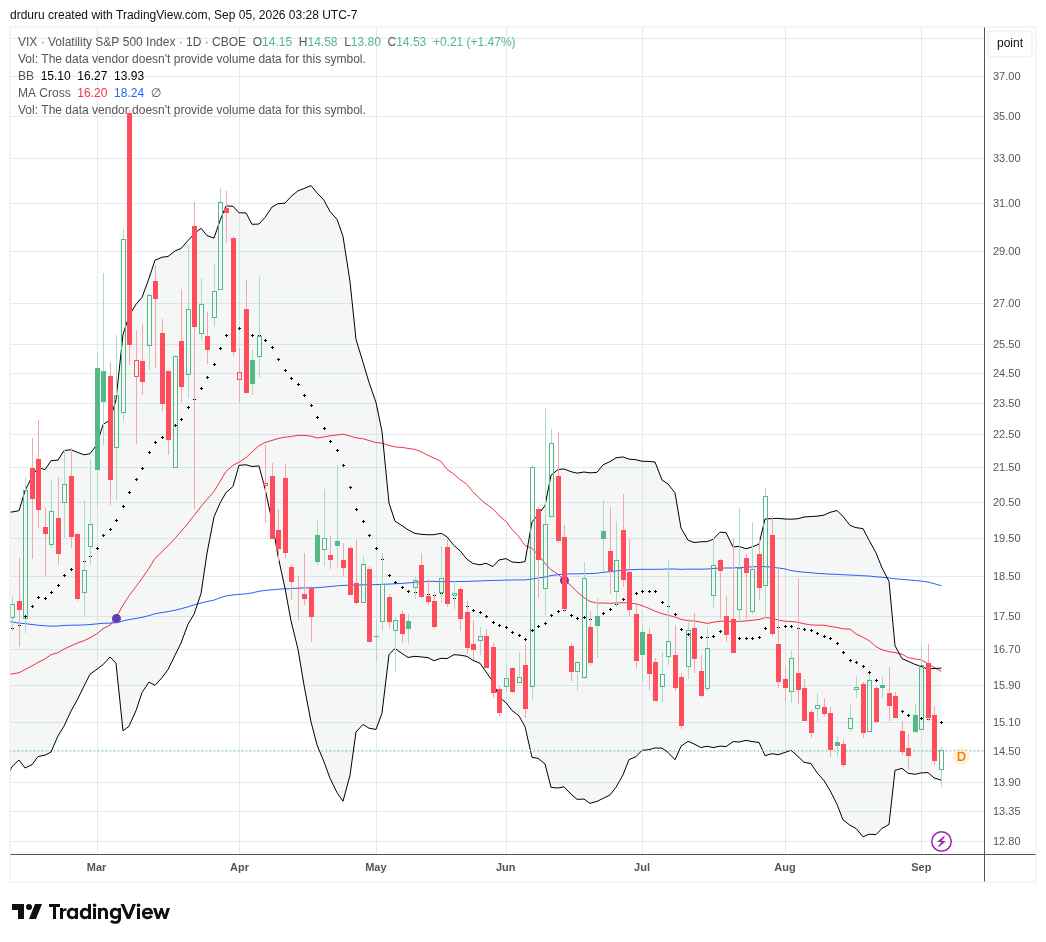
The volatility index (VIX) spiked on Tuesday but quickly settled back down the rest of the week. Market breadth nearly broke under the pressure of the VIX. Yet, the VIX’s return to lows of the year suggested that the path of least resistance still points toward more complacency amid stubbornly bullish sentiment.
The Equities
iShares Expanded Tech-Software Sector ETF (IGV)
Description: The iShares Expanded Tech-Software Sector ETF provides concentrated exposure to North American software companies and select interactive media and services businesses.
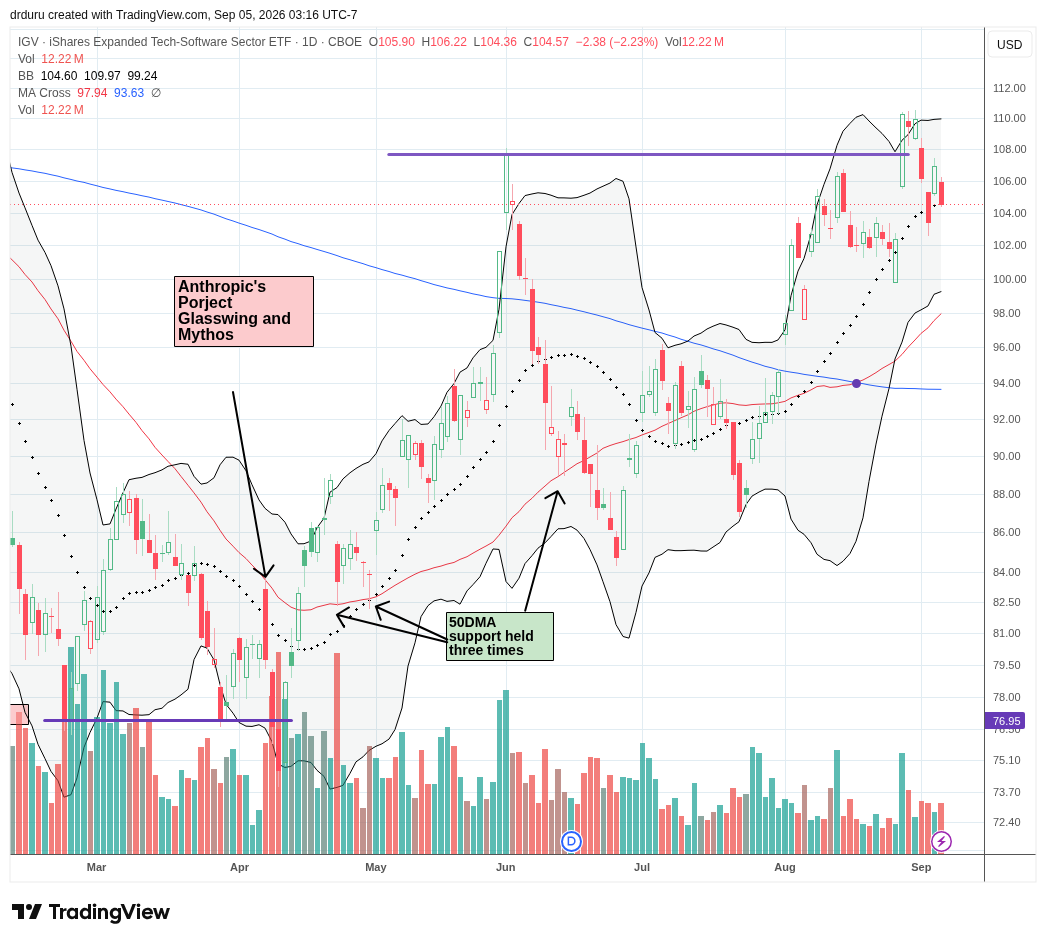
Technical Status: The iShares Expanded Tech-Software Sector ETF (IGV) dropped below its high of the year but held 20DMA support.
Trade Commentary: While IGV did not drop close to its 50DMA, its mid-week plunge was a notable source of weakness. IGV started the week off well by holding its ground on Monday, but a subsequent 2-day plunge punched the ETF of software stocks through 20DMA support. Thursday’s 3.4% leap, helped by the “Waller rate relief” was a brief respite. Sellers stepped back in on Friday and closed IGV on top of its 20DMA support. Given the sharp drop from the high and given a break below what should have been support from the June parabolic top, I am expecting IGV to return to a period of churning, perhaps pivoting around a flattening 20DMA.
Snowflake Inc. (SNOW)
Description: Snowflake operates a cloud-based data platform that allows enterprises to store, process, analyze and build applications around their data.
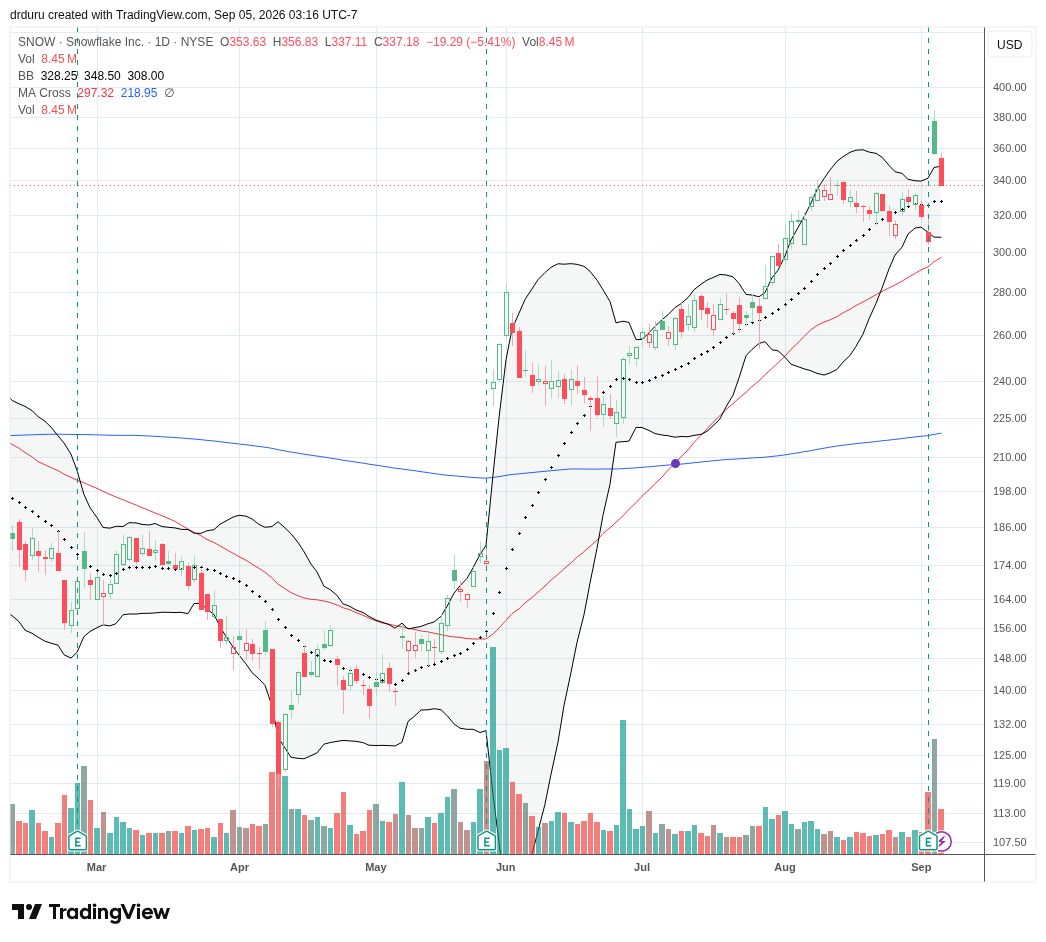
Technical Status: Snowflake Inc. (SNOW) gained 16.6% post-earnings but the downward pull of the gap and crap continued with Friday’s 5.4% loss.
Trade Commentary: SNOW enjoyed another big post-earnings day although the gap and crap response is already putting the original 20%+ gain in jeopardy. Snowflake reported that AI demand is translating into faster core platform growth. Product revenue increased 37% to $1.49 billion and management raised its fiscal 2027 product-revenue forecast to $6.07 billion. The stock captured both sides of the week’s divergence: weakness in the first half of the week and soaring strength in the back half. SNOW’s initial post-earnings gains helped boost IGV as well.
Duolingo, Inc. (DUOL)
Description: Duolingo operates a mobile learning platform focused primarily on language education and also offers an English-language proficiency assessment.
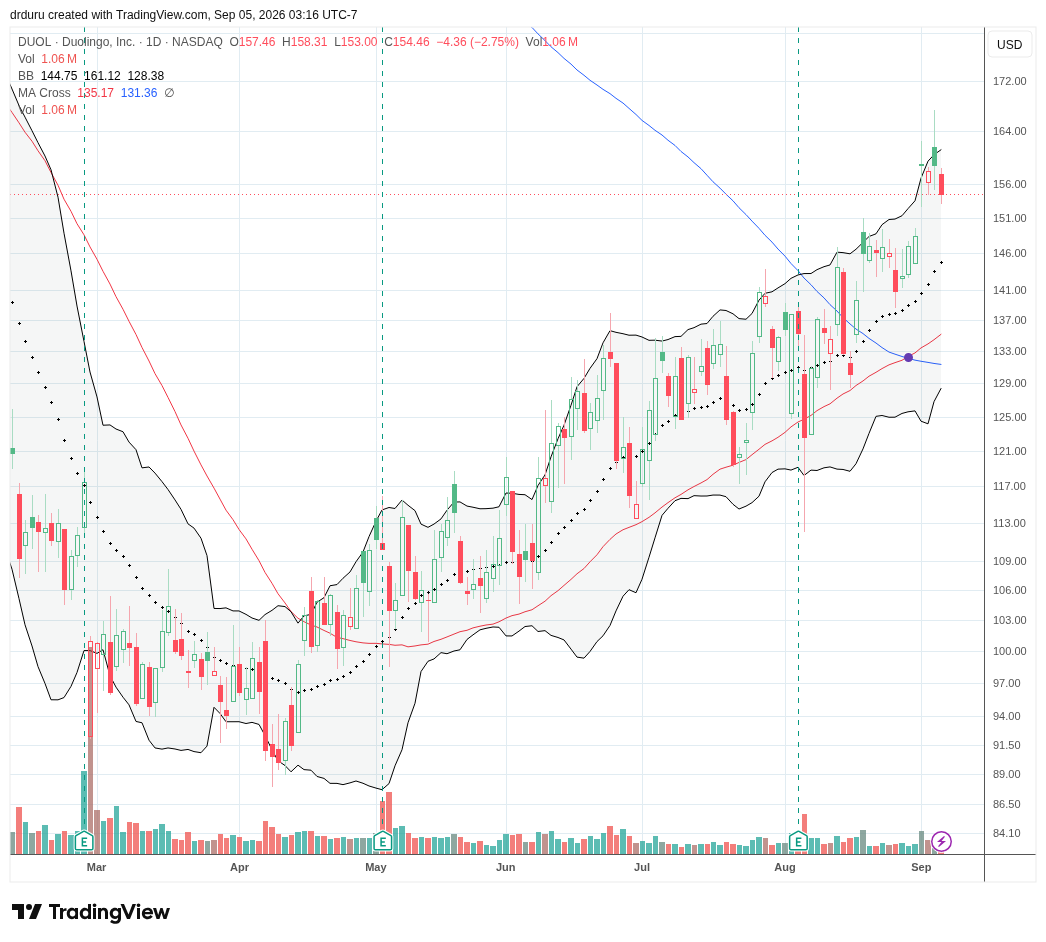
Technical Status: Duolingo, Inc. (DUOL) jumped to a 7.0% gain on Tuesday but failed to follow through to finishing a reversal of its 2026 losses.
Trade Commentary: The grinding comeback for DUOL took a big leap yesterday with an upgrade from Evercore ISI to Outperform as well as a doubling of its price target to $210. DUOL gained 7.0% and held on to most of those gains the rest of the week. This upgrade makes DUOL an incrementally more attractive trade, and I am now inclined to hold my next position for longer. Previously, I bought DUOL near 20DMA or 50DMA support and then sold on the next rally to or toward the upper Bollinger Band.
Broadcom Inc. (AVGO)
Description: Broadcom designs semiconductor products and provides infrastructure software used across data centers, networking, broadband, wireless and enterprise computing.
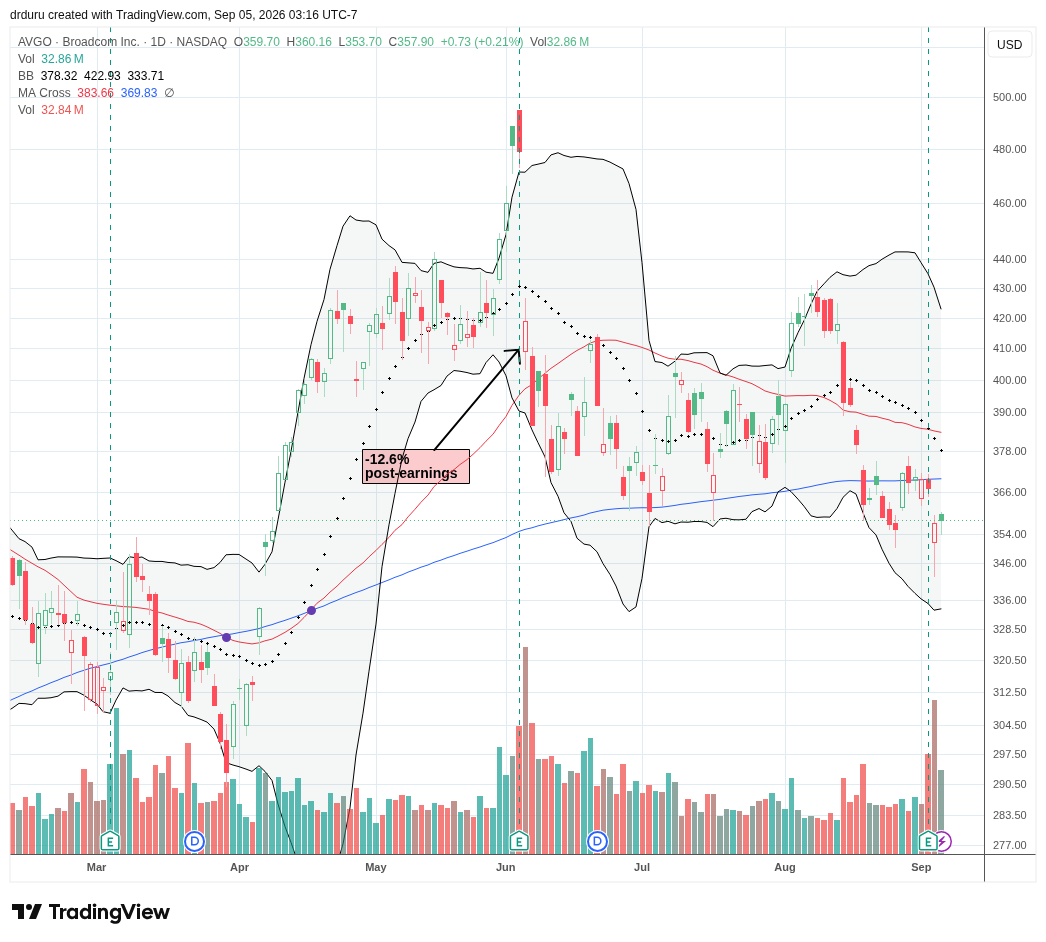
Technical Status: Broadcom Inc. (AVGO) lost 2.7% post-earnings and once again confirmed 200DMA resistance.
Trade Commentary: Broadcom reported that fiscal third-quarter revenue reached $29.6 billion, up 86% year-over-year, while AI semiconductor revenue climbed to $16.7 billion. Fourth-quarter revenue guidance was approximately $34.8 billion. AVGO still fell 2.7% post-earnings and confirmed 200DMA resistance for the second time in a month. Despite the enduring enthusiasm for AI-related trades, AVGO is a short here until it recovers 200DMA support. I would consider a pairs trade going long SMH except that I am already long a put spread as a hedge to other bullish trades!
Ciena Corporation (CIEN)
Description: Ciena supplies optical networking, routing, switching, software and related services used by telecom carriers, cloud providers and data-center operators.
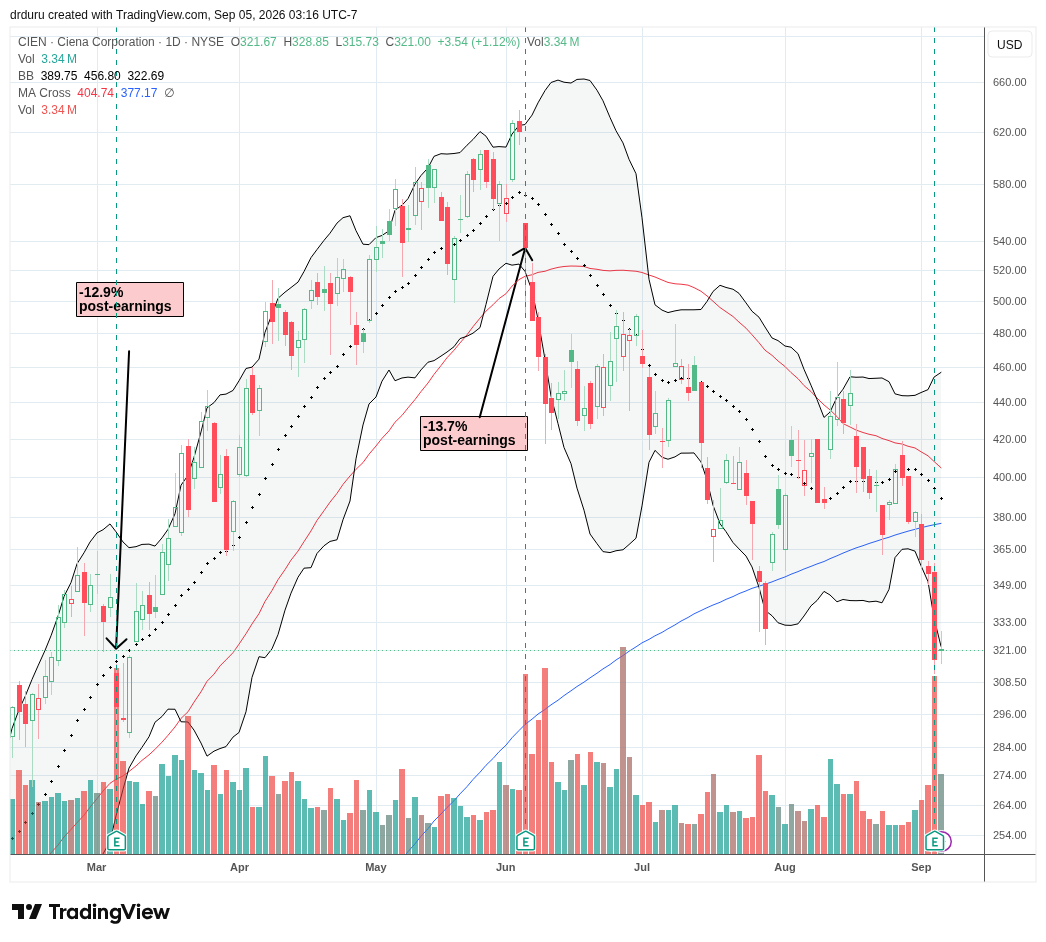
Technical Status: Ciena Corporation (CIEN) confirmed a 200DMA breakdown with a 10.4% post-earnings loss.
Trade Commentary: CIEN is now a broken AI trade with its third big post-earnings drop in a row. Last week’s was particularly devastating given the 10.4% loss and confirmed 200DMA breakdown. Ciena reported that fiscal third-quarter revenue rose 37% to $1.67 billion and adjusted EPS reached $2.11. Management raised full-year revenue guidance to approximately $6.42 billion as AI continued to drive network investment. However, it seems investors and traders reacted negatively to future gross-margin pressure and supply constraints that could limit near-term revenue growth. I am not interested in shorting CIEN here because these kinds of sentiment moves contrary to headline results can prove ephemeral. However, I would not buy the stock until it recovered 200DMA support.
Corning Incorporated (GLW)
Description: Corning develops specialty glass, ceramics and optical-fiber products used in telecommunications, displays, consumer electronics, automotive applications and life sciences.
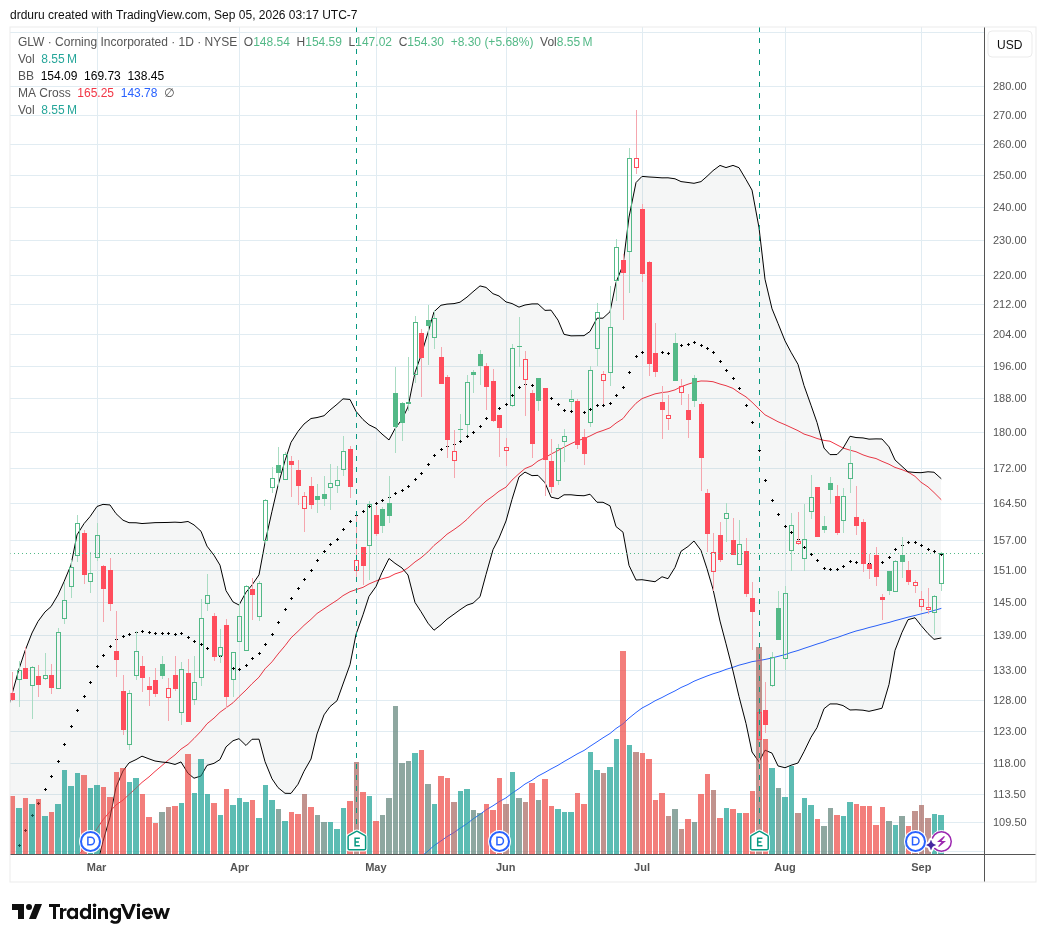
Technical Status: Corning Incorporated (GLW) confirmed 200DMA support with Friday’s 5.7% gain.
Trade Commentary: GLW diverged from CIEN’s weakness with a picture-perfect bounce off 200DMA support. The stock is now back on my buy list even though the near-term upside may get clipped by downtrending 50DMA resistance.
Alphabet Inc. (GOOG)
Description: Alphabet is the parent company of Google and operates businesses spanning internet search and advertising, YouTube, cloud computing and other technology ventures.
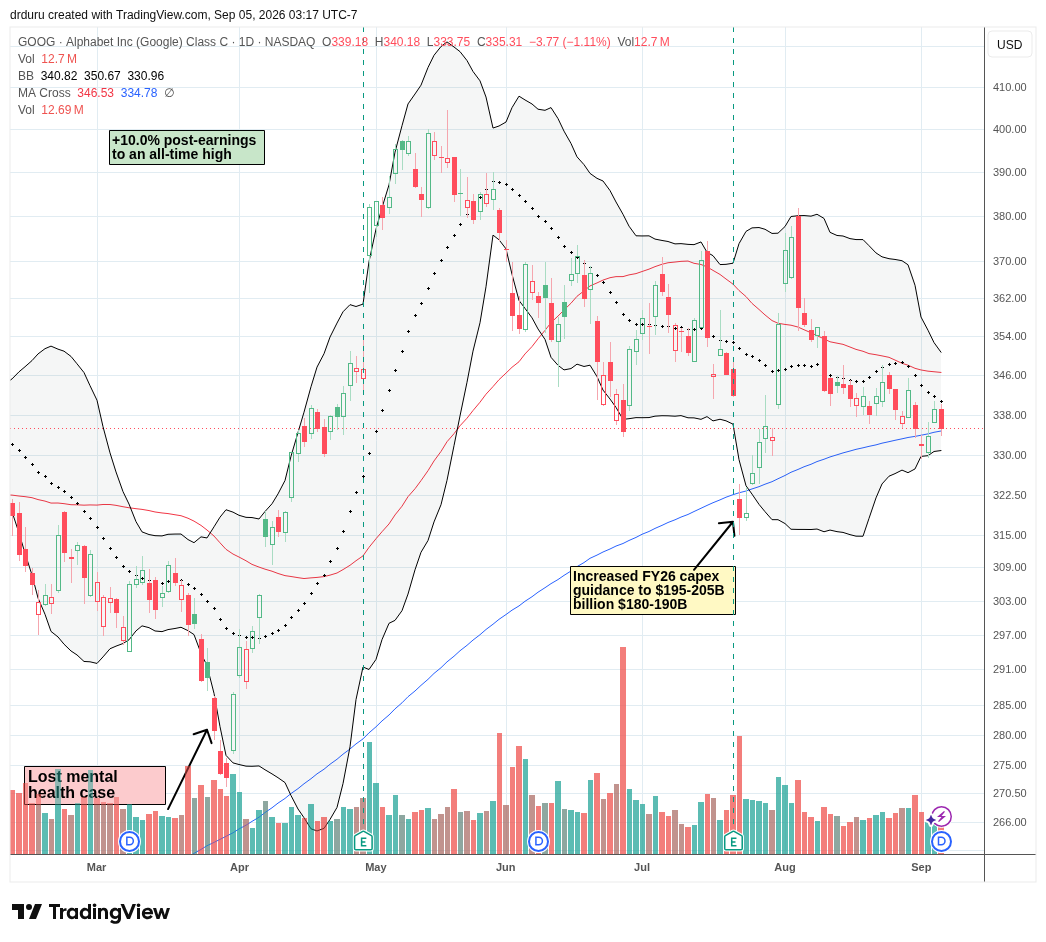
Technical Status: Alphabet Inc. (GOOG) is struggling to hold on to 200DMA support while 20DMA resistance holds firm.
Trade Commentary: Alphabet received a small boost on Wednesday when a federal judge rejected the Justice Department’s attempt to force Google to divest its AdX advertising exchange and instead imposed behavioral remedies. The stock closed the week as fragile as ever, clinging to 200DMA support. The stock is down notably from May’s high and looks topped out for the near-term.
Apple Inc. (AAPL)
Description: Apple designs and sells consumer technology products including the iPhone, Mac, iPad and wearables while operating a large ecosystem of software and digital services.
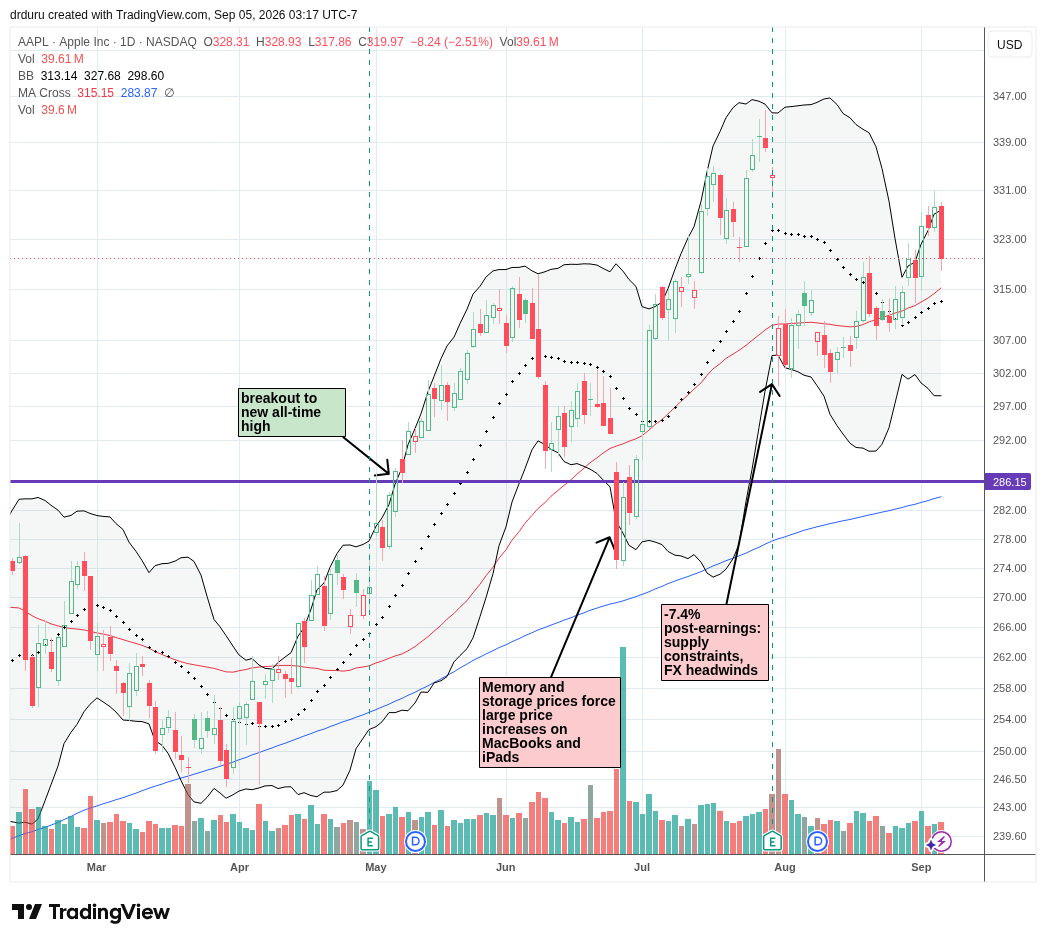
Technical Status: Apple Inc. (AAPL) resolved its Bollinger Band squeeze sharply to the upside but reversed sharply on Friday’s news about production constraints.
Trade Commentary: AAPL launched the tenure of John Ternus as CEO with an impressive upside resolution of its Bollinger Band squeeze. However, the stock promptly fell 2.5% on Friday on rumors of initial production constraints for Apple’s anticipated foldable iPhone. I jumped into the weakness with a weekly Wed/Fri call spread positioned for a rebound going into the September 9 product event. Earlier in the week I left a lot of money on the table with a calendar call spread at the $320 strike. Ironically, if I had dared to hold that position, Friday’s plunge would have created a maximum gain on that position!
Amazon.com, Inc. (AMZN)
Description: Amazon operates global e-commerce marketplaces, Amazon Web Services, advertising, subscriptions and a range of logistics, media and consumer-device businesses.
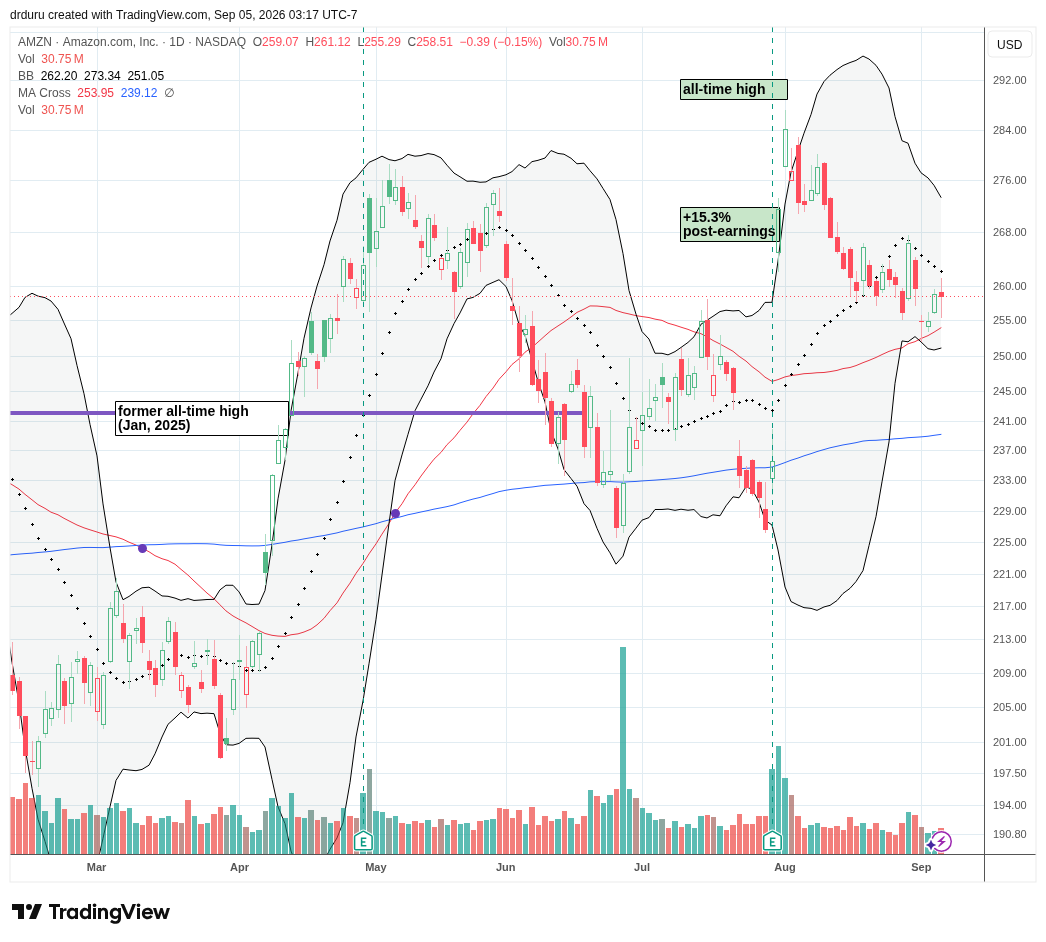
Technical Status: Amazon.com, Inc. (AMZN) confirmed 50DMA support but on Friday faded from 20DMA resistance.
Trade Commentary: My last AMZN trade went well, but I missed last week’s perfect bounce off 50DMA support. I am now watching for a close above 20DMA resistance for a buy signal.
lululemon athletica inc. (LULU)
Description: lululemon designs and sells athletic apparel, footwear and accessories through stores and digital channels around the world.
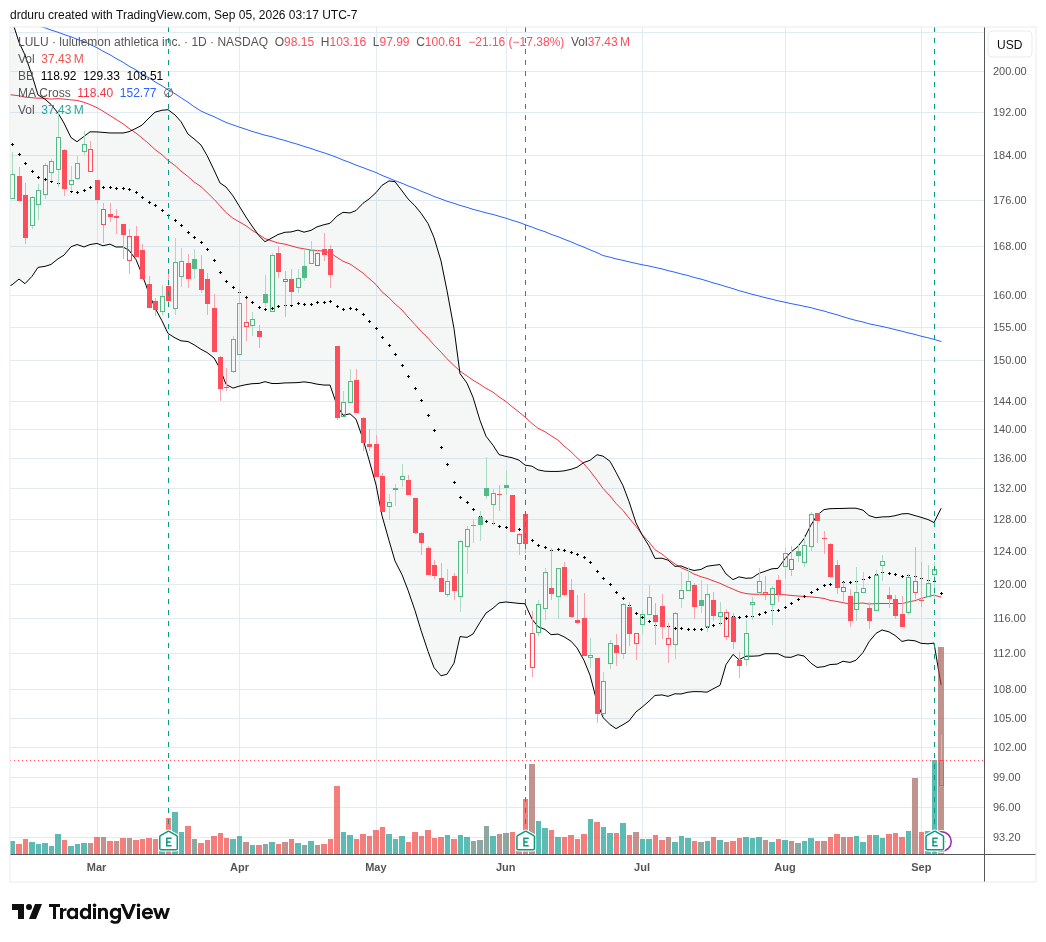
Technical Status: lululemon athletica inc. (LULU) crashed 17.4% post-earnings to an 8+ year low.
Trade Commentary: LULU has been for me a stock that looks like it will keep trading lower over time, yet I could never trade it successfully. Shorting shares would have worked, but I chose put options to eliminate the risk of an abrupt and large loss on short-covering or some temporary good news or analyst upgrade. So, while Friday’s post-earnings crash did not surprise me, I did not dare try a pre-earnings trade. At an 8+ year low, the stock looks too washed out and over-extended to the downside for new bearish positions.
Lululemon reported that second-quarter revenue declined 4% and Americas revenue fell 8%. Even worse, management cut full-year revenue guidance to $10.35 billion-$10.50 billion.
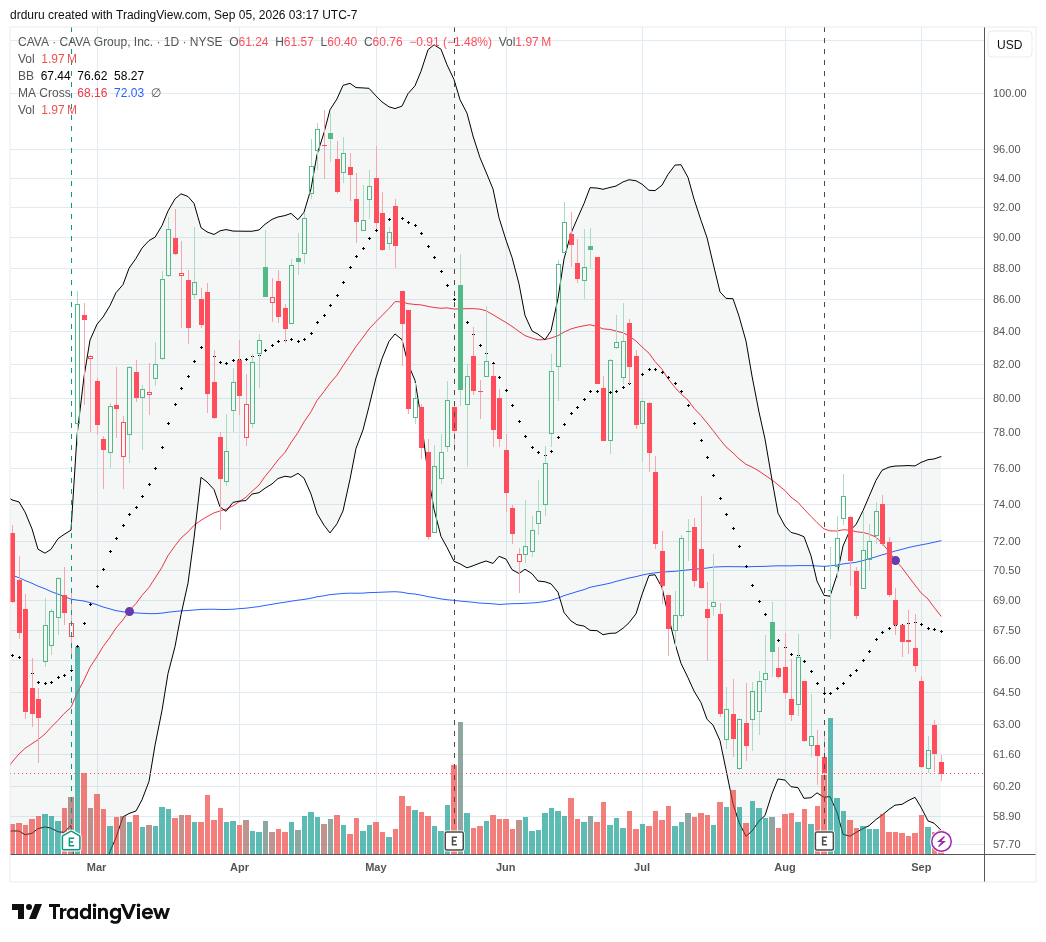
CAVA Group, Inc. (CAVA)
Description: CAVA operates a fast-casual restaurant chain focused on Mediterranean-inspired meals in the United States.
Technical Status: CAVA Group, Inc. (CAVA) finished reversing its double-digit post-earnings gains and is positioned to retest lows for the year.
Trade Commentary: CAVA roundtripped last month’s impressive post-earnings gains. The stock is now on my bearish list as the macro-economic environment runs strongly counter to such a discretionary dining option.
Robinhood Markets, Inc. (HOOD)
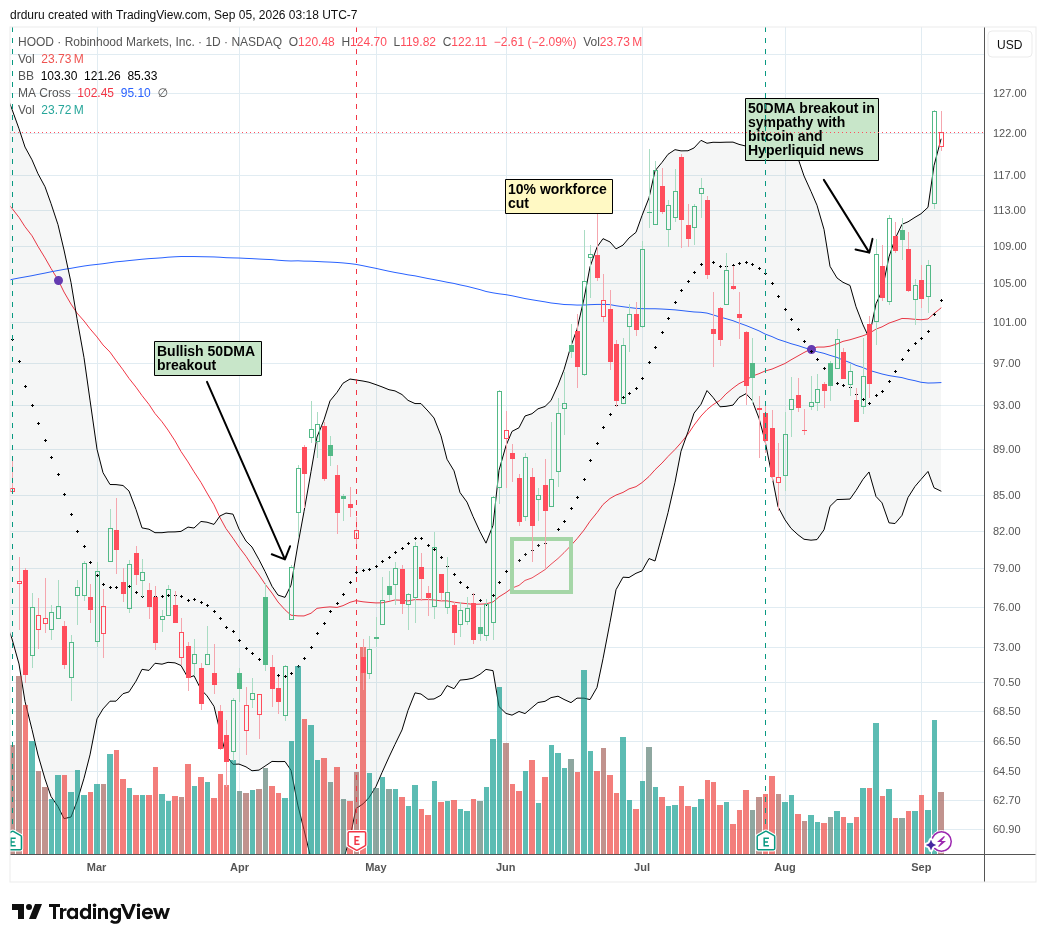
Description: Robinhood operates a financial-services platform offering retail brokerage, cryptocurrency trading, retirement products, prediction markets and other investing services.
Technical Status: Robinhood Markets, Inc. (HOOD) surged 16.6% on Thursday to a new high of the year after a Morgan Stanley upgrade.
Trade Commentary: I went into last week ready for HOOD to regain momentum alongside the renewed buying interest in cryptocurrencies. However, I was not aggressive enough as the stock surged 16.6% on Thursday at least partially thanks to a Morgan Stanley upgrade; HOOD blew right by my calendar call spread’s strike at $110. I took profits on a small amount of shares and let the short side of the calendar spread get assigned to me. The most likely outcome this week is that I exercise the long side of the spread to cover the shares short. I only profit if the stock plunges toward or through the $110 level.
Fair Isaac Corporation (FICO)
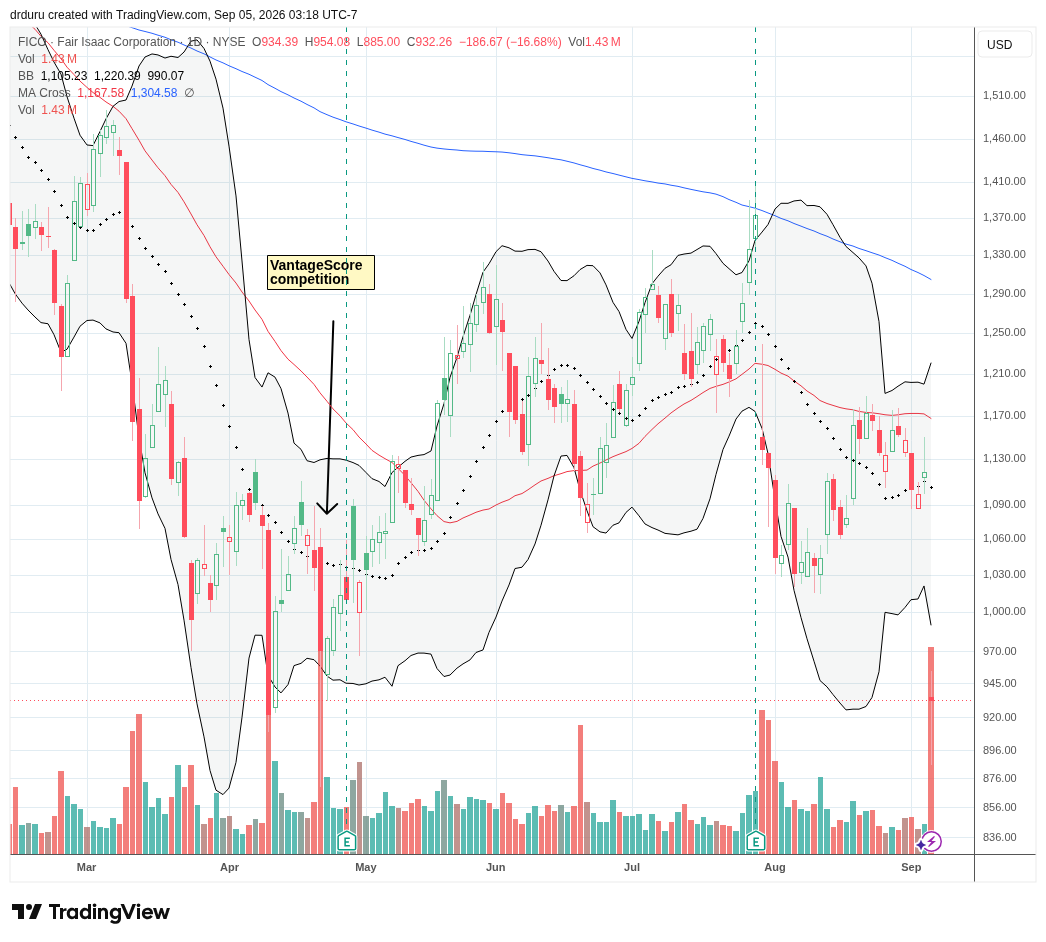
Description: Fair Isaac develops analytics and decision-management software and is best known for the FICO credit scores used throughout consumer lending.
Technical Status: Fair Isaac Corporation (FICO) crashed 16.7% and returned back to its low of the year after the Federal Housing Finance Agency moved yet again to increase competition.
Trade Commentary: Just when I thought the Federal Housing Finance Agency (FHFA) finally made peace with Fair Isaac Corporation, the agency managed to deliver more bad news for FICO shareholders. The stock crashed 16.7% after the FHFA decided to allow all lenders to use VantageScore, news I honestly thought was already released and done with back in April. Regardless, I remain uninterested in buying this stock as the company clearly remains in the crosshairs of the government.
Deere & Company (DE)
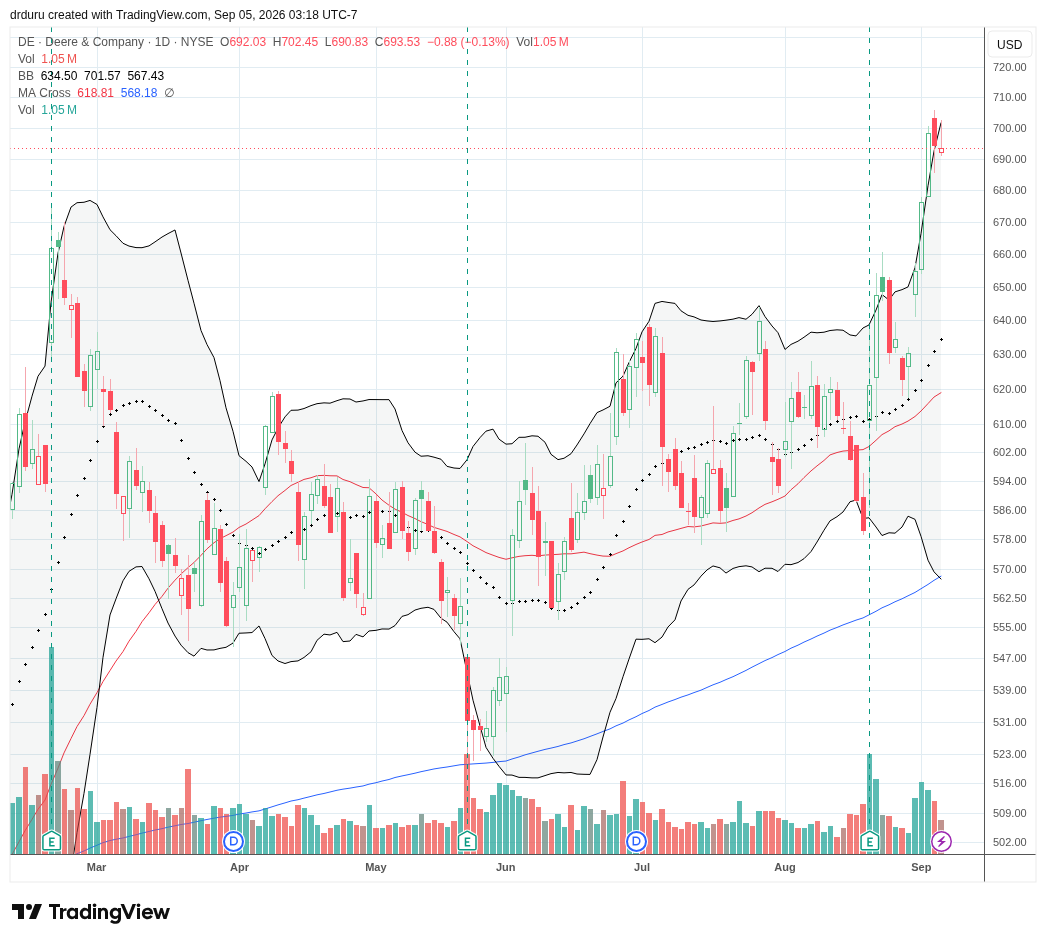
Description: Deere manufactures agricultural, construction, forestry and turf equipment along with related precision-technology and financial services.
Technical Status: Deere & Company (DE) soared to a new all-time high as post-earnings momentum continued.
Trade Commentary: Deere received an upgrade from Baird to buy and a price target increase from $640 to $800. The boost helped send the stock rising parabolically along its upper Bollinger Band. Thus, the stock maintained strong momentum from last month’s post-earnings surge. DE is a buy on the dips from here.
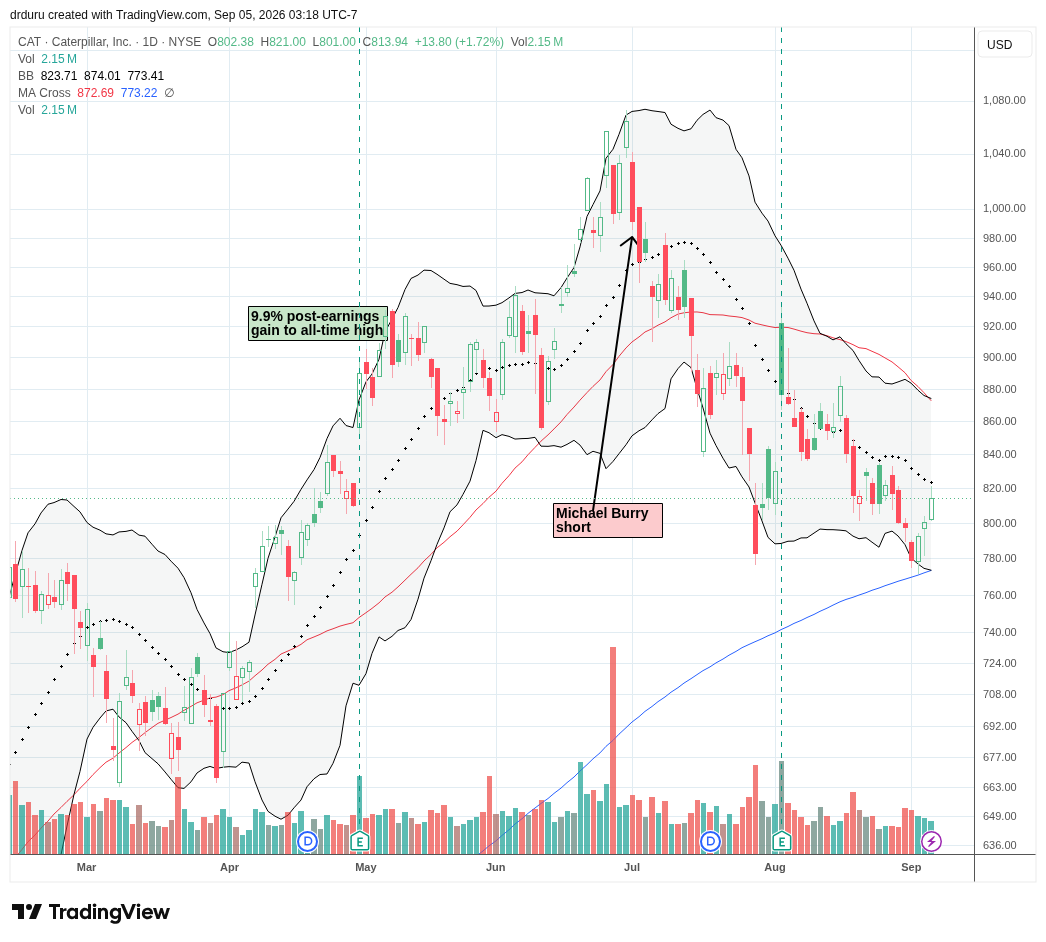
Caterpillar Inc. (CAT)
Description: Caterpillar manufactures construction and mining equipment, engines, turbines and locomotives and provides related financial services.
Technical Status: Caterpillar Inc. (CAT) confirmed 200DMA support but faded from downtrending 20DMA resistance on Friday.
Trade Commentary: I have been warily eyeing CAT ever since Michael Burry announced a short position back in June. Surprisingly, the stock has trended downward ever since even with a healthy post-earnings gain in the middle (that gain ended with 50DMA resistance). I finally dared to buy a September $820/$835 call spread after CAT bounced perfectly off 200DMA support. I almost took profits on Friday, but I decided to hold on in case the stock is gaining enough steam to punch through 20DMA resistance and challenge its 50DMA resistance in the coming two weeks.
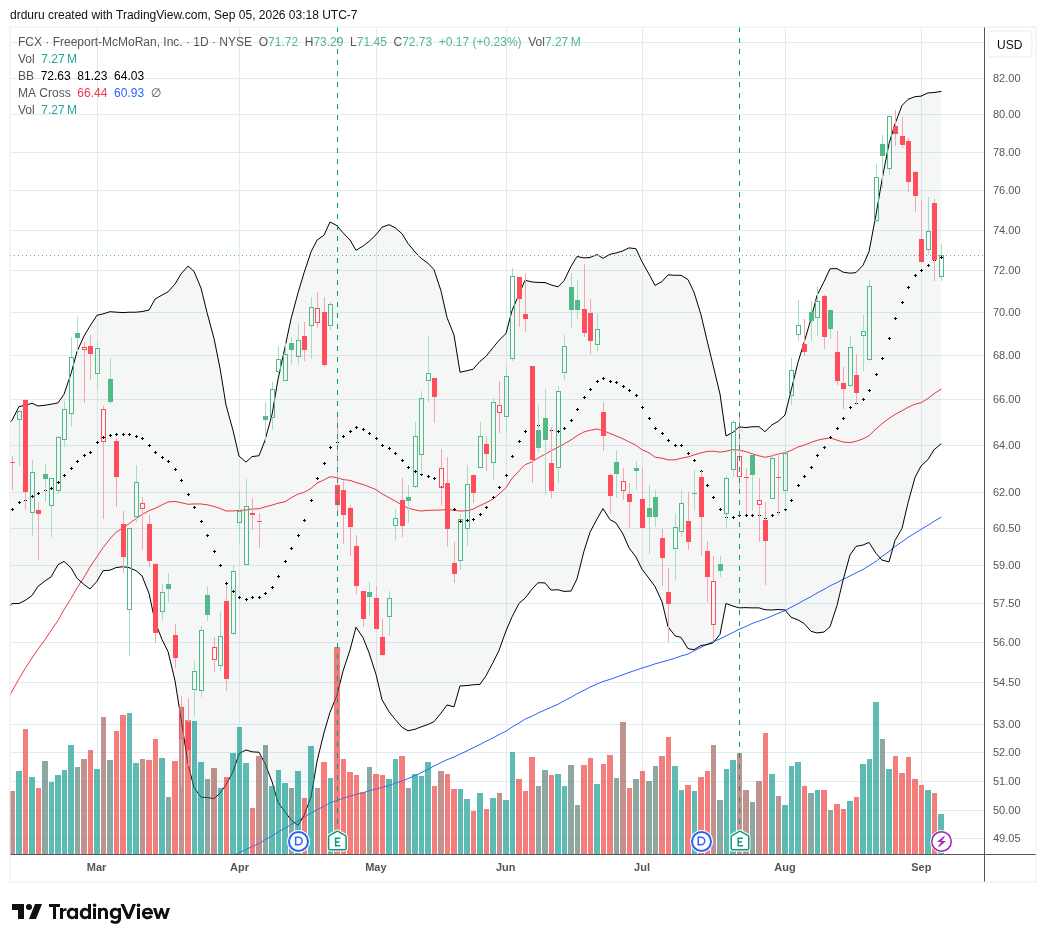
Freeport-McMoRan Inc. (FCX)
Description: Freeport-McMoRan is a global mining company whose principal commodities include copper, gold and molybdenum.
Technical Status: Freeport-McMoRan Inc. (FCX) is struggling to hold on to its breakout and 20DMA support.
Trade Commentary: FCX rewarded me for holding while it struggled to break resistance at the previous high for the year. However, last week the stock continued to sag from the recent highs, only stopping at 20DMA support. If I did not already have a position in FCX, I would buy shares here and plan to buy more at 50DMA support if such a pullback unfolded.
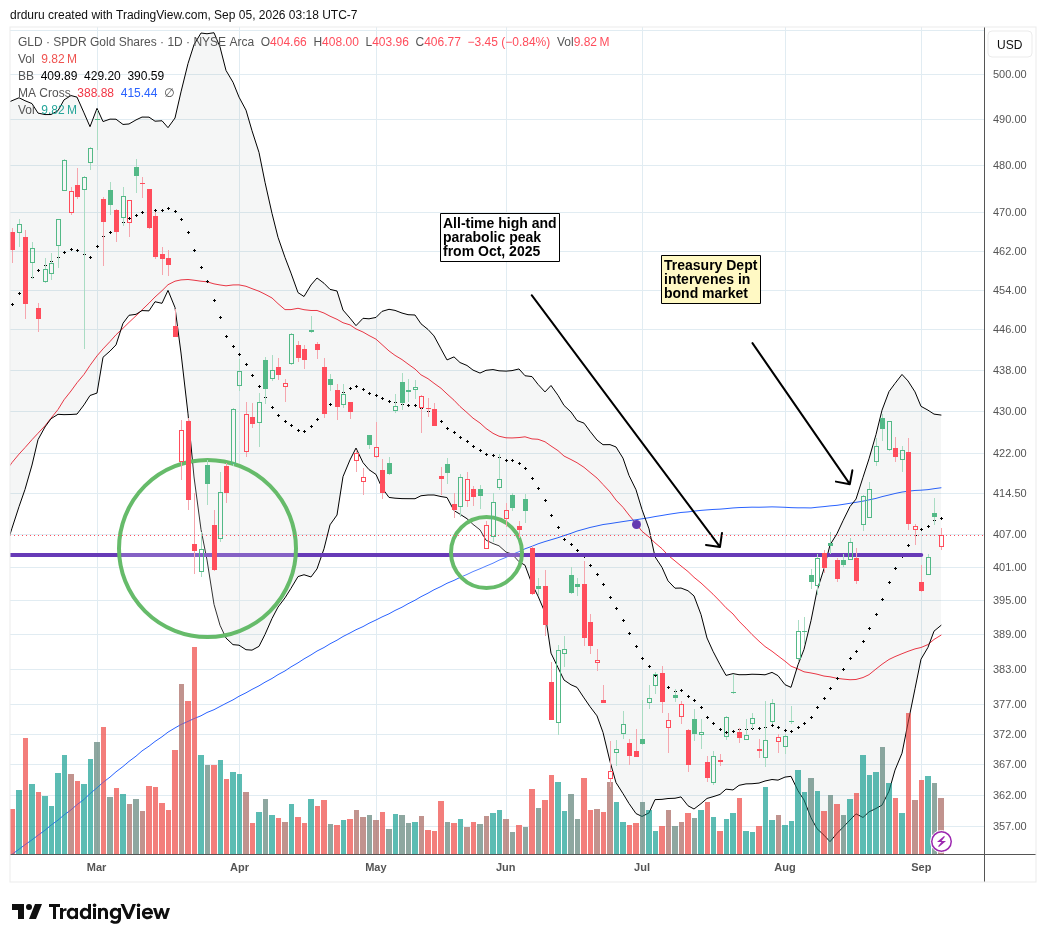
SPDR Gold Shares (GLD)
Description: SPDR Gold Shares is an exchange-traded trust designed to provide exposure to the price of physical gold bullion.
Technical Status: SPDR Gold Shares (GLD) briefly broke down below key support. The subsequent rebound stalled under 20DMA resistance.
Trade Commentary: GLD had a choppy week as interest rates buffeted rate-sensitive trades. GLD followed through on the previous Friday’s plunge with another two days of selling. Rate relief sent GLD rebounding on Wednesday and Thursday. Friday’s strong jobs report resuscitated fears of higher interest rates and thus sent GLD back down again. I expect GLD to remain choppy until a fresh 200DMA breakout.
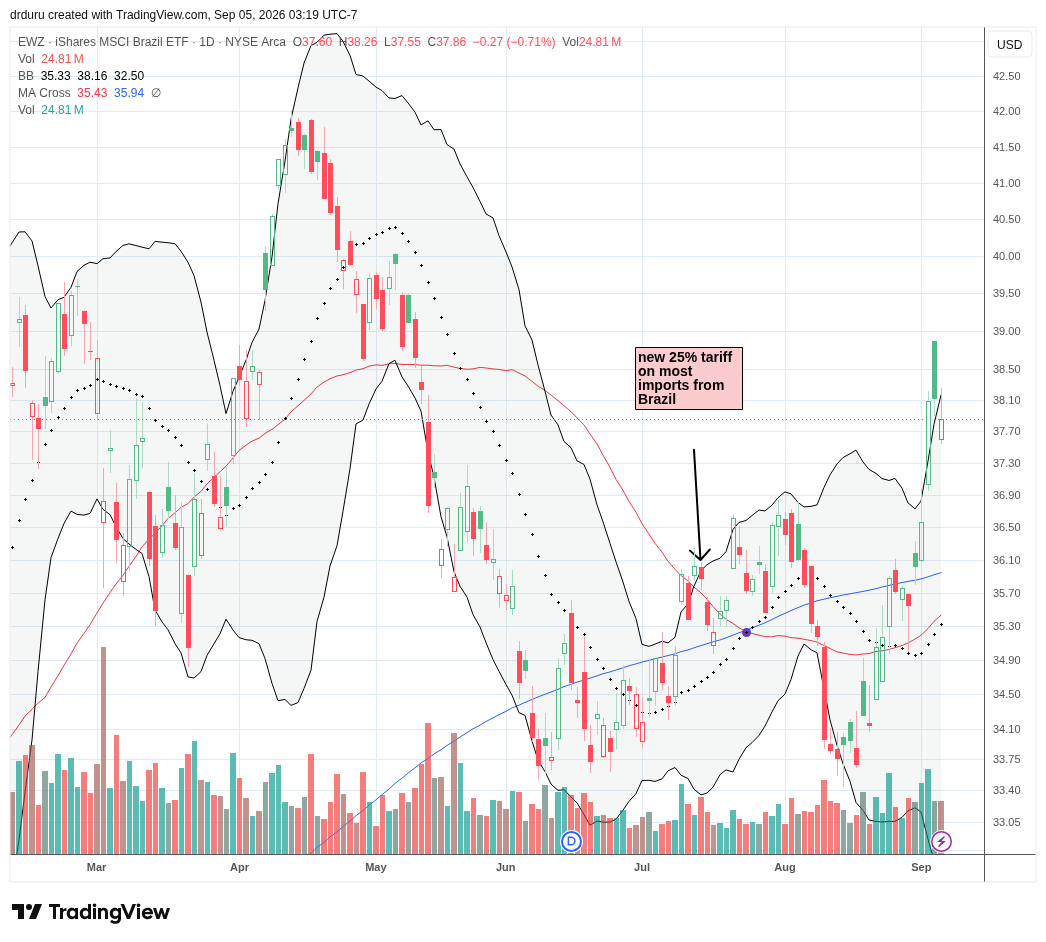
iShares MSCI Brazil ETF (EWZ)
Description: The iShares MSCI Brazil ETF provides broad exposure to large and mid-sized publicly traded Brazilian companies.
Technical Status: The iShares MSCI Brazil ETF (EWZ) soared above its upper Bollinger Band as momentum from the August lows continued, but Thursday’s gap and crap made EWZ look toppy.
Trade Commentary: The bullish commodity trade is alive and well with Brazil. My latest “20% trade” is working even better than I hoped with EWZ soaring off the August lows. Unfortunately, I may be forced to preserve remaining profits after Thursday’s gap and crap and Friday’s follow through selling.
GoPro, Inc. (GPRO)
Description: GoPro designs and markets action cameras, accessories and related subscription and cloud-based services.
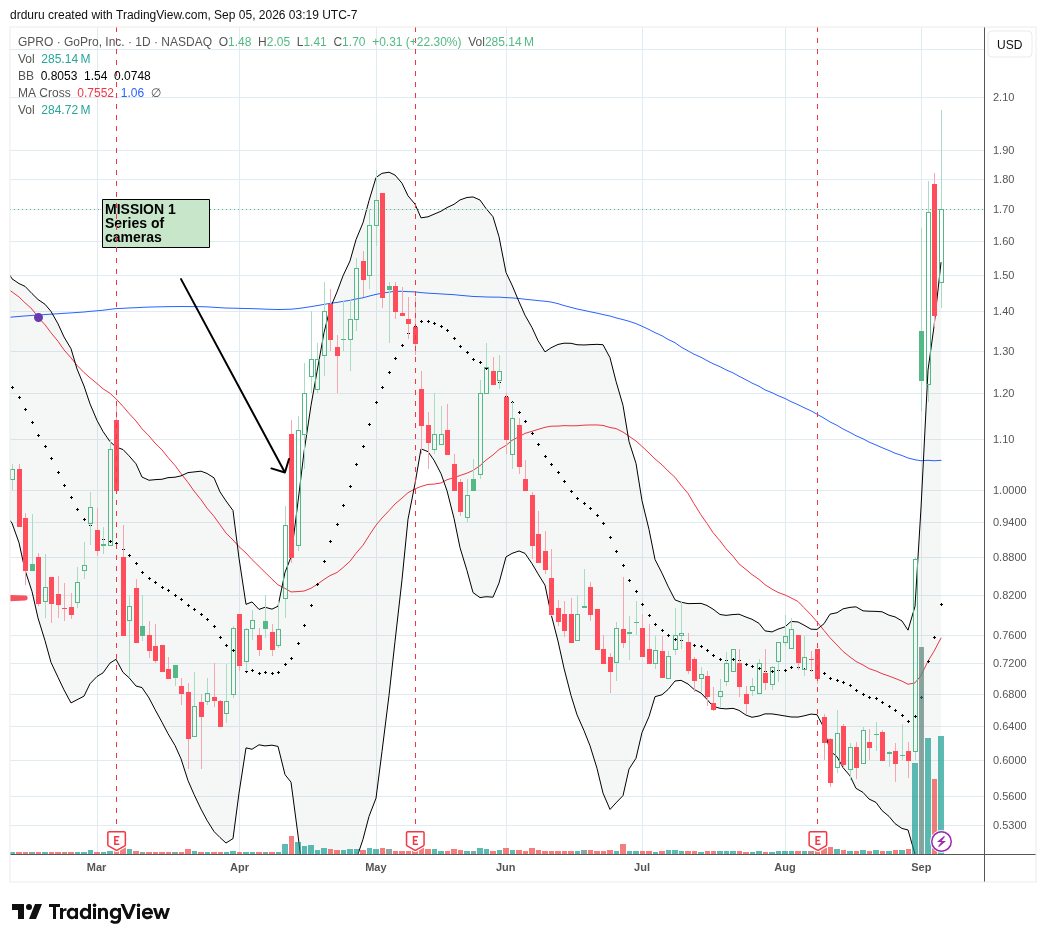
Technical Status: GoPro, Inc. (GPRO) surged from a low of the year to a near 52-week high on news of YouTuber Mark Fischbach (Markiplier) buying a large stake.
Trade Commentary: On September 1 GoPro announced a definitive merger agreement involving Starman Optical under which GoPro shareholders will receive $1.14 per share in cash, subject to adjustment, while retaining approximately 10% of the combined company’s equity. In the wake of this news, GPRO gained 40.4% Tuesday and another 37.4% Wednesday before falling 17.8% Thursday, on extremely high trading volume. Yet, the news headlines for GPRO were dominated by disclosure from YouTuber Mark Fischbach (Markiplier) who bought a large stake in the company. I honestly never heard of this celebrity, but I am grateful for the opportunity to take profits on my long-suffering shares. I bought and held GPRO shares after the CEO disclosed purchases earlier in the year. The opportunity to sell on Tuesday escaped me, and I subsequently set a limit sell order for $1.56 that closed on Wednesday. Thursday’s plunge made me feel relieved I avoided getting greedy. Friday’s resurgence and sharp fade from the intraday highs made me want to avoid this highly volatile stock for the time being.
Footnotes
Subscribe for free to get email notifications of future posts!
“Above the 50” (AT50) uses the percentage of stocks trading above their respective 50-day moving averages (DMAs) to measure breadth in the stock market. Breadth defines the distribution of participation in a rally or sell-off. As a result, AT50 identifies extremes in market sentiment that are likely to reverse. Above the 50 is my alternative name for “MMFI” which is a symbol TradingView.com and other chart vendors use for this breadth indicator. Learn more about AT50 on my Market Breadth Resource Page. AT200, or MMTH, measures the percentage of stocks trading above their respective 200DMAs.
Active AT50 (MMFI) periods: Day #282 over 20%, Day #109 over 30%, Day #105 over 40%, Day #1 over 50% (overperiod ending 4 days under 50%), Day #15 under 60% (underperiod), Day #255 under 70%
Source for charts unless otherwise noted: TradingView.com
Full disclosure: long QQQ call spread, long CAT call spread, long GLD call spread, long PHYS, long EWZ, long FCX, long HOOD call and short HOOD shares, long AAPL call spread, long GOOG
FOLLOW Dr. Duru’s commentary on financial markets via StockTwits, BlueSky, and even Instagram!
*Charting notes: Stock prices are not adjusted for dividends. Candlestick charts use hollow bodies: open candles indicate a close higher than the open, filled candles indicate an open higher than the close.
* Blog notes: I use ChatGPT to help with editing and news discovery.