

Stock Market Commentary
Welcome to the start of the stock market’s three most dangerous months of the year. A weak jobs report for July helped to send market sentiment into a sharp reversal. The bad economic news suddenly turned the prospect of rate cuts into something to fear. These rate cut fears spun the market rotation narrative right off the road as economic weakness becomes a bad thing for now. The presumed fear in the market is that the Fed is late in cutting rates because, well, a 6-week gap has proven to be the make or break stretch of time for the economy (insert sarcasm here).
The Sahm Rule
The triggering of the Sahm Rule with Friday’s rise in the unemployment rate presides over the rate cut fears. The “statistical regularity” of this rule suggests the economy is already in a recession. I imagine algorithms and analysts alike are crunching numbers fast to assess how and where to reduce exposure to economically sensitive stocks. If so, Friday’s selling pressure is a prelude of what is to come for the stock market’s most dangerous months. Thus, rallies will get faded and sold….at least until the Federal Reserve appears to save the day with the start of a rate-cutting cycle.
Google trends tells a great story about how the Sahm Rule captured people’s attention. In the screen capture below, I scribbled notes to indicate the timing of the Fed meeting and the July jobs report. As I explained on Inflation Watch, a reporter asked Powell about the Sahm Rule during the press conference. Clearly, only a small select group of people cared to understand the significance of that discussion. The mad scramble to understand this rule erupted on Friday.
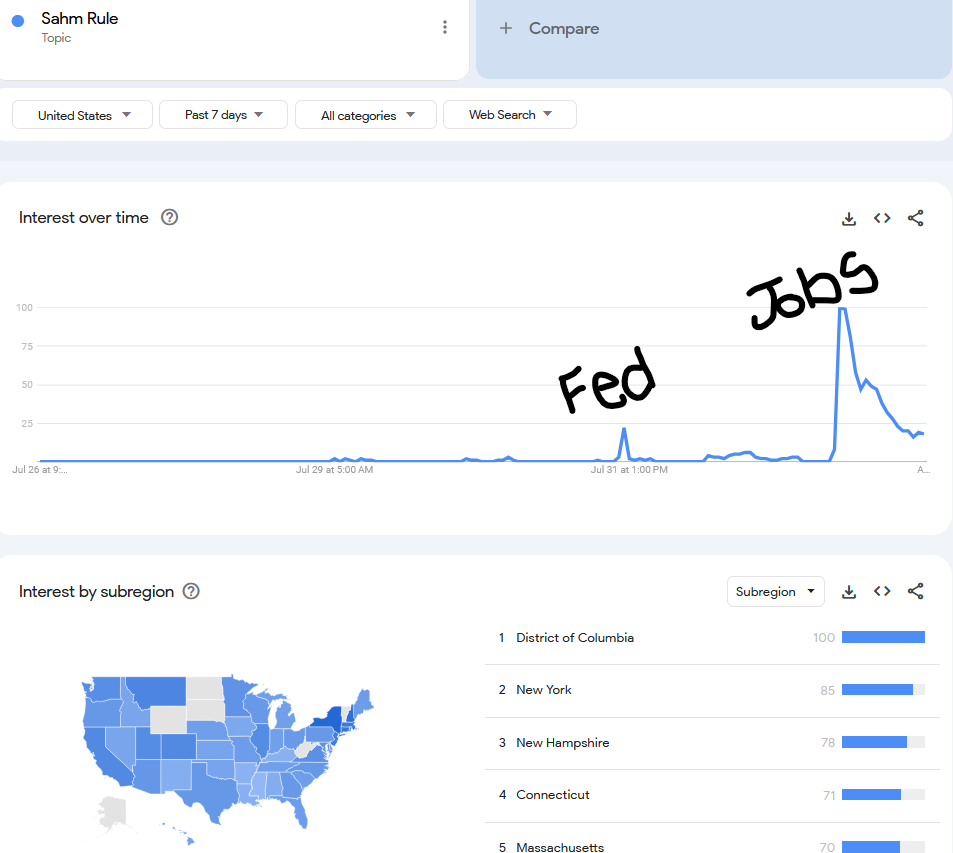
The regional breakdown of search interest is also quite telling. Northeastern states and Washington DC dominate the top 5. These regions cover much of America’s national centers of political and financial firepower. This regional concentration further confirms the importance of paying attention to how people interpret and act on the Sahm Rule.
For reference and context, I compared search interest in the Sahm Rule to search interest in “inflation.” Inflation of course has been on everyone’s minds for years now. For a brief moment on Friday (meaning intraday), search interest in the Sahm Rule matched interest in inflation.
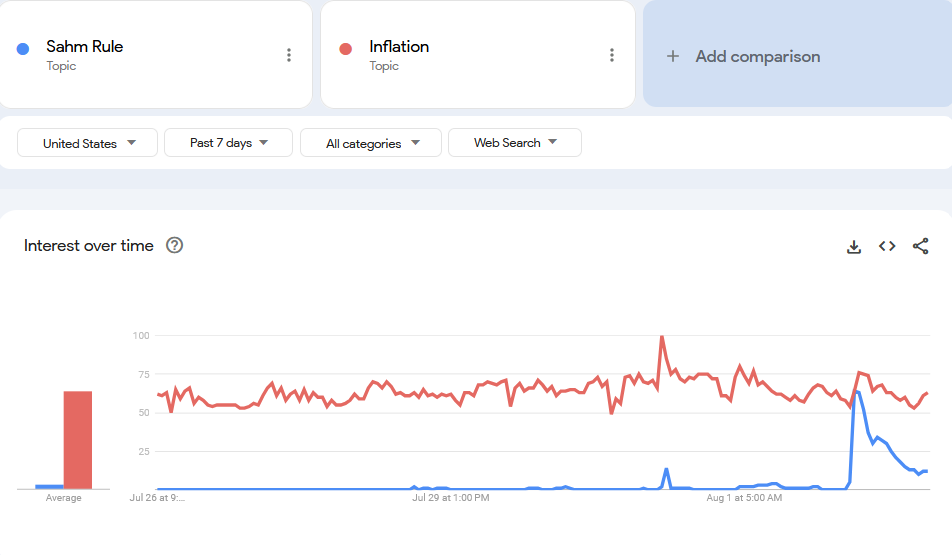
(August 5: for an update on the fast moving changes in search interest and market turmoil see “The Carry Trade Sweeps the Sahm Rule Aside“)
The Revenge of the Yen
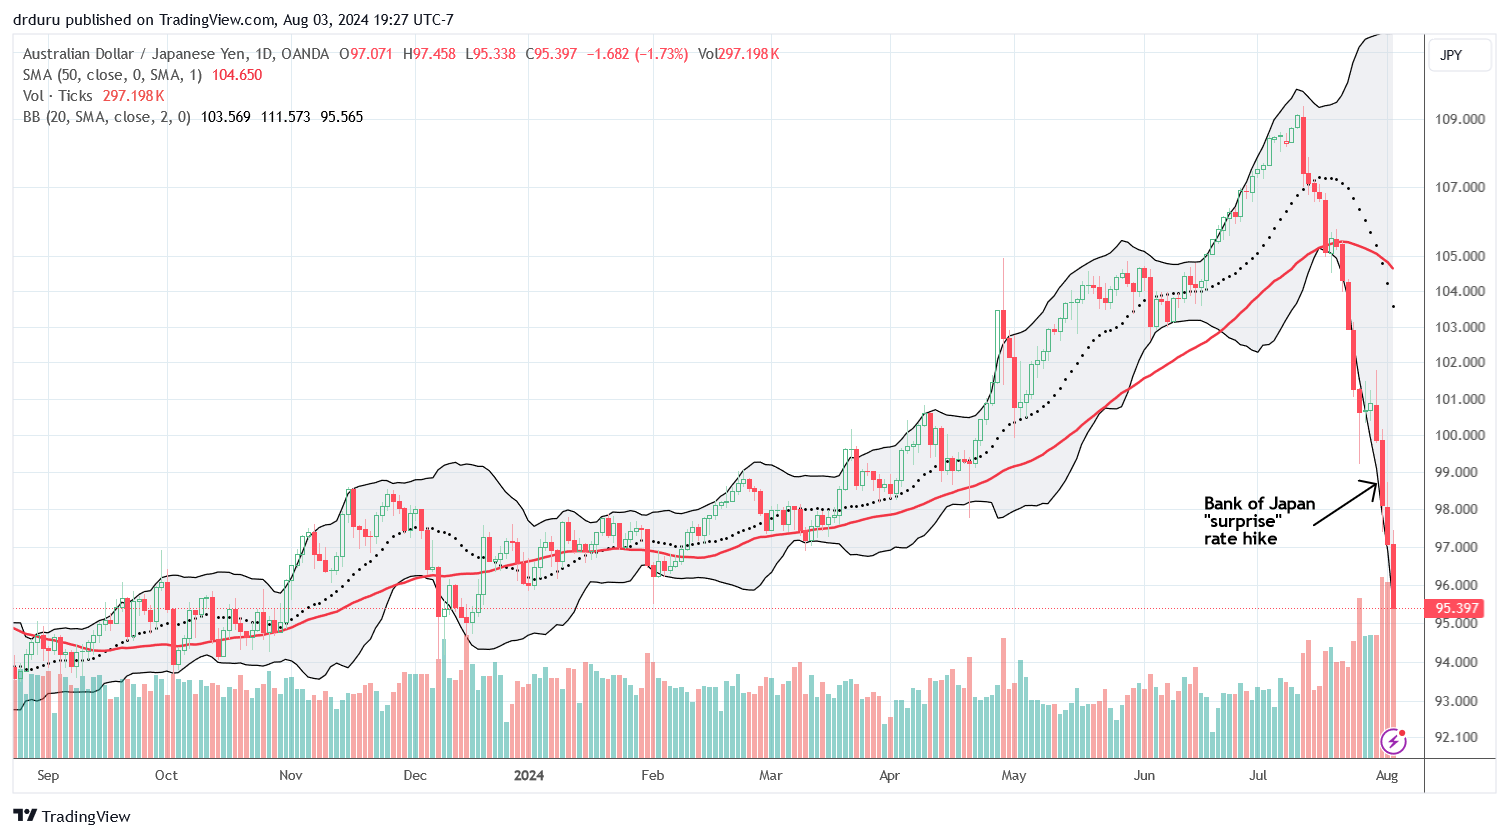
Finally, there is the rapid strength in the Japanese yen upsetting a lot of carry trades that support speculation in the stock market. I am very belated in pointing out the sharp resurgence in the significance of the Australian dollar versus the Japanese yen (AUD/JPY) to traders as a key tell on market sentiment. When I wrote about the yen two months ago, it was as a skeptic about the effectiveness of currency interventions from the Bank of Japan (BoJ). At that time, the yen looked like a currency on the brink of collapse. My trading strategy worked until soon after the revenge of the yen.
I was far too late in appreciating just how extreme the yen’s comeback could get! By the time the BoJ issued a surprise rate hike on Wednesday, the revenge of the yen was in full swing. Now, I dare not guess whether the nearly uninterrupted plunge in AUD/JPY has exhausted itself and flagged a potential (short-term) bottom for the stock market.
Needless to say, rate cuts from the Federal Reserve (and next the Reserve Bank of Australia) while the BoJ is hiking rates could further support the revenge of the yen and in turn further undermine the stock market. Talk about rate cut enthusiasm turning into rate cut fears!
The Stock Market Indices
The S&P 500 (SPY) looked ready for a fresh lift-off after the Fed meeting. The index gapped up ahead of the Fed and closed the day with a 1.6% gain despite a fade into the close. From there, resistance at the 20-day moving average (DMA) held firm and helped send the S&P 500 reversing right back to 50DMA support (the red line). Investors and traders clearly reconsidered the implications of Fed Chair Powell refusing to fully commit to a rate cut in September.
The weak jobs report spun the wheels right off the ride. The S&P 500 gapped down and finished the day with a 1.8% loss and 2-month low. The small bounce off the intraday low reduce the odds that the S&P 500 will immediately confirm the 50DMA breakdown with a lower close. Still, the index looks like it is breaking down. For reference, the 200DMA (not shown) is now at 5010 and coincides with the April low.
")
The bears did not allow the Fed to slip the NASDAQ (COMPQ) through their paws. While the tech-laden index gapped higher to reverse all of Tuesday’s loss and then some, 50DMA resistance held firm. The NASDAQ looks like it is in worse shape than the S&P 500. Friday’s gap down and 2.4% loss confirmed 50DMA resistance (even worse than confirming a breakdown). Suddenly, the former all-time high from 2021 is right back in view as potential support. The 200DMA (not shown) is rapidly converging on this support and now sits at 15,800. I go into the coming week with the remaining long side of a QQQ calendar call spread.
")
The iShares Russell 2000 ETF (IWM) brought the market rotation narrative to an abrupt halt. The fears that a rate cut will be necessary to address rapidly approaching economic weakness spun the market rotation narrative right off the road as IWM lost 3.5%. The ETF of small caps closed right on top of 50DMA support and followed a 3.3% loss the previous day as traders and investors had second thoughts about the Fed’s actions. A key tell was IWM’s fade after the Fed meeting. IWM went from invalidating the previous blow-off top signal to creating a fresh blow-off top.
I took profits on an IWM calendar call spread on Wednesday’s surge, but I held my remaining IWM positions. I added to calls and shares on Thursday and Friday. Stubbornly, I am holding on to the market rotation thesis even as it now looks like the most dangerous months of the year for the stock market may stave off the bulls and buyers. I guess I just cannot imagine the whole thing can come and go so quickly! The current close for IWM sits right on top of the previous trading range. For now, I assume the worst case scenario is an IWM which returns to its bear market line.
")
The Short-Term Trading Call With Rate Cut Fears
- AT50 (MMFI) = 48.7% of stocks are trading above their respective 50-day moving averages
- AT200 (MMTH) = 55.8% of stocks are trading above their respective 200-day moving averages
- Short-term Trading Call: neutral
AT50 (MMFI), the percentage of stocks trading above their respective 50DMAs, plunged along with small caps. My favorite technical indicator slipped from the threshold of overbought trading conditions at 70% all the way down to 48.7%. Like IWM, AT50 essentially reversed its entire breakout from last month. More importantly, AT50 confirmed bearish trading conditions with a definitive rejection from the overbought threshold. On Fed Day, AT50 traded as high as 73.4% only to close at 69.7%. Talk about a close call!
The trading action around rate cut fears sets up fresh challenges for the AT50 trading rules. The VIX surged well beyond my expectations for this cycle. Friday’s surge to the highs of 2023 are typically a buying signal for just about any trading system. Indeed, the VIX faded sharply from its intraday high near 30 all the way back to 23.4. I dutifully made purchases including call options in the ProShares Short VIX Short-Term Futures ETF (SVXY). However, I strongly prefer to make purchases on VIX spikes in or near oversold conditions. AT50 remains well above oversold thanks to the residual resilience in IWM. I also took profits on most of my put options and shorts.
Amid this swirl of signals, I held my short-term trading call at neutral. However, Michael Khouw on CNBC’s Fast Money made me want to follow the AT50 trading rules to a (cautiously) bearish short-term trading call. Khouw claimed that this particular extreme in the VIX’s behavior is a harbinger of poor performance to come. If he is correct, then oversold conditions are lingering somewhere in a near future that will underline the stock market’s most dangerous months for drawdowns.
Khouw noted that the VIX soared from general complacency to 50% above its 30-day moving average. This kind of move is in the 99th percentile of trading action for the VIX (back to the early 1990s). Historically, the returns for the S&P 500 “are typically not that good when that happens.” These statistics are concerning, but it is also precarious to extrapolate from something that happens just 1% of the time to a general rule. Regardless, I will assume the next relief rally will get sold with the 50DMA overhead resistance proving particularly stubborn for the NASDAQ.
")
On a quick sidenote, I took great interest in a CNBC special on Russian hacking of U.S. financial markets. The U.S. and several allies recently exchanged prisoners with Russia. The deal included sending convicted hacker and inside trader Vladislav Klyushin back to Russia. Coincidentally, CNBC had a special video segment ready for release right after the prisoner swap. This jaw-dropping segment demonstrated how Russia is at war with the West through hacking and disrupting financial markets.
The segment features Klyushin, his partner, and their company. Their government sanctioned hacking scheme was brilliant and brazen. The law enforcement officials who busted the scheme were equally brilliant and lucky. Next time I see a stock acting like someone “got the drop” on market-moving news, I now have to wonder whether hacking explains the trading action!
I earlier worried that the market rotation favoring small caps over big cap tech stocks would challenge my generative AI trade. And here we are… Vertiv Holdings (VRT) looked like a good post-earnings play starting in April until it broke 50DMA support in June. As a long-term position, I ignored the short-term warnings…and now I am paying the price. VRT fell 13.6% post-earnings in the previous week and finished wiping out all its gains from April earnings. On Friday, VRT added insult to injury by gapping down to a near 5-month low. The on-going selling pressure is happening despite strong earnings results and increased guidance – a very worrying sign.
Now I am both nervous about the lack of “natural” support until all of 2024’s gains are reversed and excited abut the opportunity to accumulate shares at much cheaper prices.
")
The fortunes of Advanced Micro Devices (AMD) turned sour sooner than the rest of my generative AI basket. AMD peaked in March with an ominous and classic blow-off top. In early July, I thought AMD finally regained its energy. Those hopes were quickly dashed as AMD sank in the market rotation away from tech and toward small caps. I experienced brief relief after AMD “survived” earnings with a 4.4% gain. Sellers reversed those gains and then some the very next day as a part of the market’s rate cut fears. Now at an 8-month low, AMD is in danger of falling all the way back to its October/November low in a deeper market sell-off. As with VRT, I await the verdict both with trepidation and anticipation.
")
Intel Corporation (INTC) was the disaster of the week. After INTC broke out in early July, I thought the stock was bullishly breaking out from a consolidation period. My assessment rewarded me with profits from my “between earnings” trade. I should have stuck to the short-term trades (with hindsight). I bought shares when INTC pulled back toward 50DMA support, and I held them on the 50DMA breakdown because I allocated those shares to a long-term position (sound familiar?). The hinted warning sailed over my head when INTC fell to a 14-month low ahead of earnings. INTC collapsed 26.1% the next day in a complete disaster of an earnings report. Intel is restructuring, laying off employees, eliminating the dividend, and basically hitting a major reset button.
INTC fell to levels it last saw in 2013. Perhaps a final bottom will not come until the lows from the Great Financial Crisis, another 38% loss from here. I bought a few more “no regret” shares just in case INTC never gets that low before bottoming. In the meantime, I will return to the between earnings trade when the entry conditions look good, like a post-earnings closing high. If I am fortunate, I can make up for a good portion of my losses on the shares.
")
Amkor Technology, Inc (AMKR) is not officially in the generative AI basket, but its packaging and test services are important for delivering semiconductor chips. AMKR is the US’s largest such facility. The company recently won a non-binding $400M grant as part of the CHIPS act. Trading at 1.1 price/sales and 1.7 price/book, AMKR is a rare low-valuation find in the semiconductor space. Accordingly, I bought into the 18.9% post-earnings loss as AMKR settled back into its previous trading range.
")
Amazon.com (AMZN) was almost as big a post-earnings surprise as INTC. AMZN fell 8.8% after bouncing sharply from its intraday low. I suspect part of this 6-month low comes from big cap tech stocks slowly falling out of favor. I pulled an old trade out of the playbook and bought a calendar call spread. My trade relies on a historical “tendency” that delivers rewards in roughly two weeks from buying AMZN at any point on the day after earnings. A sky high VIX and AMZN trading well below its lower Bollinger Band (BB) helped boost my motivation to play for a rebound.
")
Corning Incorporated (GLW) looked good in last month’s big breakout. GLW issued strong guidance based on the needs of generative AI. Unfortunately, the actual results failed to impress. GLW finished closing the gap after last week’s earnings. While I am not adding GLW to my generative AI basket (it’s getting a bit crowded at this point!), I did put GLW on the buy list on a close above its 50DMA and a new post-earnings high.
")
Carvana Co (CVNA) continues to be the retail stock I will never understand. Despite concerns about the health of the consumer, the stock for this online used car seller has ignored the doubts and motored higher all year along uptrending 50DMA support. CVNA gained 10.0% post-earnings and gave back some of the gains on Friday with a 6.4% pullback. CVNA is up an astonishing 159% year-to-date.
")
Dave & Busters Entertainment, Inc (PLAY) finally dropped too low to resist. I got back into the purveyor of entertainment complexes after it fell 6.3% on Friday, close to the bottom of its previous 3-year trading range. I will have to bail if PLAY breaks down below that trading range since the stock has a lot of room to fall from there.
")
So much for a comeback for online learning companies. After Coursera (COUR) pulled off a major post-earnings rally, I thought fortunes had finally turned. Udemy (UDMY) taught us that reality still weighs heavily. UDMY collapsed 18% post-earnings to a new all-time low. In the meantime, COUR is working on filling its massive post-earnings gap.
")
Investment bank Goldman Sachs (GS) has been a stellar performer for financials this year. Even with last week’s sharp pullback to 50DMA support, GS is up 22.0% year-to-date and outpacing the S&P 500. If the 50DMA holds, GS goes on my buy (the dip) list.
")
Informatica, Inc (INFA) has yet to recover its momentum after Salesforce.com (CRM) backed out of an M&A deal. INFA is now down for the year and struggling to hold on after reporting earnings last week. I remain a fan of the company, but I am still waiting for a stabilization in the stock or earnings performance before adding to my long-term position.
")
Medical device maker Edwards Lifesciences Corporation (EW) collapsed 31% post-earnings in the previous week. After a brief rebound, sellers returned to pressure the stock. EW is struggling to hold on to a 4 1/2 year low. I get interested in buying if EW tests its pandemic low.
")
Not much more to say about telehealth company Teledoc Health, Inc (TDOC). TDOC hit a new all-time low last week after an 8% post-earnings drop. I keep checking in on TDOC like someone who cannot resist staring at a car wreck on the highway.
")
So for some good news….some hamburgers are still in fashion. Shake Shack (SHAK) surged 16.9% post-earnings for a bullish 50DMA breakout. However, the buying opportunity waits for stabilization after a 5.8% pullback on Friday. A successful test of 50DMA support would provide my preferred setup.
")
Semiconductor company Arm Holdings plc (ARM) is a wild one. ARM was looking good when it made a new all-time high last month. However, ARM fell steeply from there. After an 8.4% pre-earnings pop, ARM promptly fell 15.7% post-earnings. Friday’s 6.6% follow-up selling took ARM to a 2+ month low. I have not traded ARM since the months following its post-earnings surge in February, but I am itching for a fresh set-up. Friday created a potential bottoming hammer pattern.
")
Gold is holding its own as the stock market sells off. SPDR Gold Trust (GLD) pulled back slightly from its all-time high. I am looking for a new breakout and a fresh run-up. To-date, GLD is keeping pace with the S&P 500 with a 17.9% year-to-date gain.
")
Maker of organic light emitting diode (OLED) products Universal Display Corporation (OLED) had a very rough week. The stock was punished although the company raising the lower end of its revenue guidance. OLED completely reversed its June breakout with an 18% post-earnings loss and 50DMA breakdown. I feel like there should be a trade here, but I cannot figure out one with a good risk/reward.
")
Exactly a year ago, a post-earnings pop made me bullish on the stock of Clorox Company (CLX), especially as an alternative to sinking tech stocks. That moment turned out to be a fresh top in CLX, and I eventually gave up on the stock. CLX pulled off another August post-earnings pop in the midst of sinking tech stocks. Could this time be different? My lesson from last year is to be patient and let CLX prove itself. Given CLX closed well above its upper BB, I want to see the price action cool off and stabilize before trying again.
")
My rebound play on Sprout Social (SPT) worked out well, and I exited well before earnings. This stock has a lot to prove before I am willing to sit on it through an earnings report. SPT disappointed investors again last week and fell 11.6% post-earnings. The fresh 50DMA breakdown took the stock to support from the June low. SPT is a rebound buy again on the next 50DMA breakout. Otherwise, the stock is in danger of retesting its May low.
")
Social media company Snap Inc (SNAP) is still the stock and the company no one can figure out. SNAP swings wildly from earnings to earnings, often crashing post-earnings only to rally into the next earnings report. For this cycle, SNAP actually sold off going into earnings. The stock crashed 26% post-earnings and approached its October lows. A little over a year ago, SNAP failed to recover from a post-earnings sell-off until October earnings. I suspect SNAP simply rode the wave of stock market optimism at the time. I suspect SNAP will need another strong market tailwind to have any hope of rallying into the next earnings report. SNAP is clearly falling further and further behind its social media rivals.
")
")
")
Be careful out there!
Footnotes
Subscribe for free to get email notifications of future posts!
“Above the 50” (AT50) uses the percentage of stocks trading above their respective 50-day moving averages (DMAs) to measure breadth in the stock market. Breadth defines the distribution of participation in a rally or sell-off. As a result, AT50 identifies extremes in market sentiment that are likely to reverse. Above the 50 is my alternative name for “MMFI” which is a symbol TradingView.com and other chart vendors use for this breadth indicator. Learn more about AT50 on my Market Breadth Resource Page. AT200, or MMTH, measures the percentage of stocks trading above their respective 200DMAs.
Active AT50 (MMFI) periods: Day #174 over 20%, Day #73 over 30%, Day #20 over 40% (overperiod), Day #1 under 50% (underperiod ending 16 days over 50%), Day #16 over 60%, Day #12 under 70%
Source for charts unless otherwise noted: TradingView.com
Full disclosure: long SPY put spread, long QQQ call, long IWM shares, call spread, and calls; long SVXY calls, long VRT, long AMD, long INTC, long AMKR, long AMZN calendar call spread, long PLAY, long INFA, long GLD and PHYS
FOLLOW Dr. Duru’s commentary on financial markets via StockTwits, Twitter, and even Instagram!
*Charting notes: Stock prices are not adjusted for dividends. Candlestick charts use hollow bodies: open candles indicate a close higher than the open, filled candles indicate an open higher than the close.
1 thought on “Rate Cut Fears Spin Market Rotation Off the Road – The Market Breadth”