Stock Market Commentary
Can a bullish divergence create a bottom for stocks? The stock market ended last week with an emphatic “YES!” A wild week got treacherous after Thursday’s META pricequake. Investors rushed for the exits after Meta Platforms (META) reported earnings. The sympathy selling went far and wide. Fortunately, earnings from Alphabet (GOOG) and Microsoft (MSFT) did not deliver aftershocks. Instead, the week ended with a simple test for the major indices: close higher from here and most (all?) bearish transgressions get forgiven. If the coming week starts with definitive selling, then the stock market will have failed the simple test at resistance.
The week had its share of fundamental news. U.S. Q1 GDP was weaker than “expected.” The Federal Reserve’s favorite inflation gauge, the core Personal Consumption Expenditures (PCE) price index, is still not declining fast enough to satisfy the hunger for rate cuts (similar story for core CPI). Yet, this news sounded like fading echoes compared to earnings news and related price action. The dust settled on an impressive comeback week for the stock market.
The Stock Market Indices
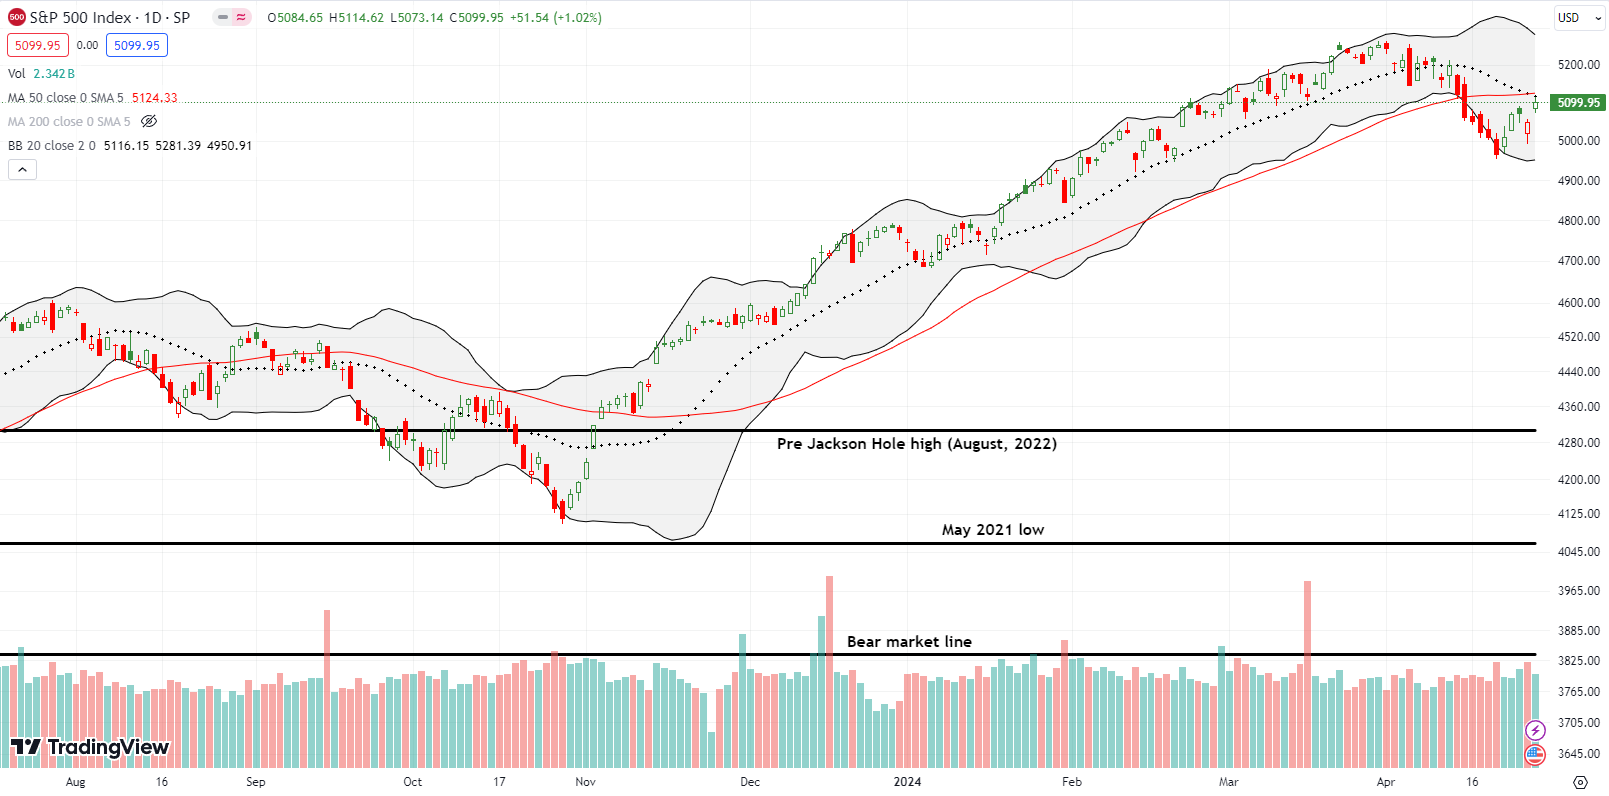
Excluding the META-induced setback, the S&P 500 (SPY) enjoyed a strong comeback week. The index gained 2.7% for the week and closed with a simple test of overhead resistance. The intraday high perfectly tapped resistance at the 20-day moving average (DMA) (the dotted line) and fell a hair short of overhead resistance from the 50DMA (the red line). This kind of technical setup makes for easier trading decisions. If the S&P 500 closes above this converged resistance at the 20DMA and 50DMA, the bearish implications of the 50DMA breakdown vaporize. A close below Friday’s intraday low confirms resistance and puts bearish trades back into play. For the week, I flipped SPY calendar call spreads twice.
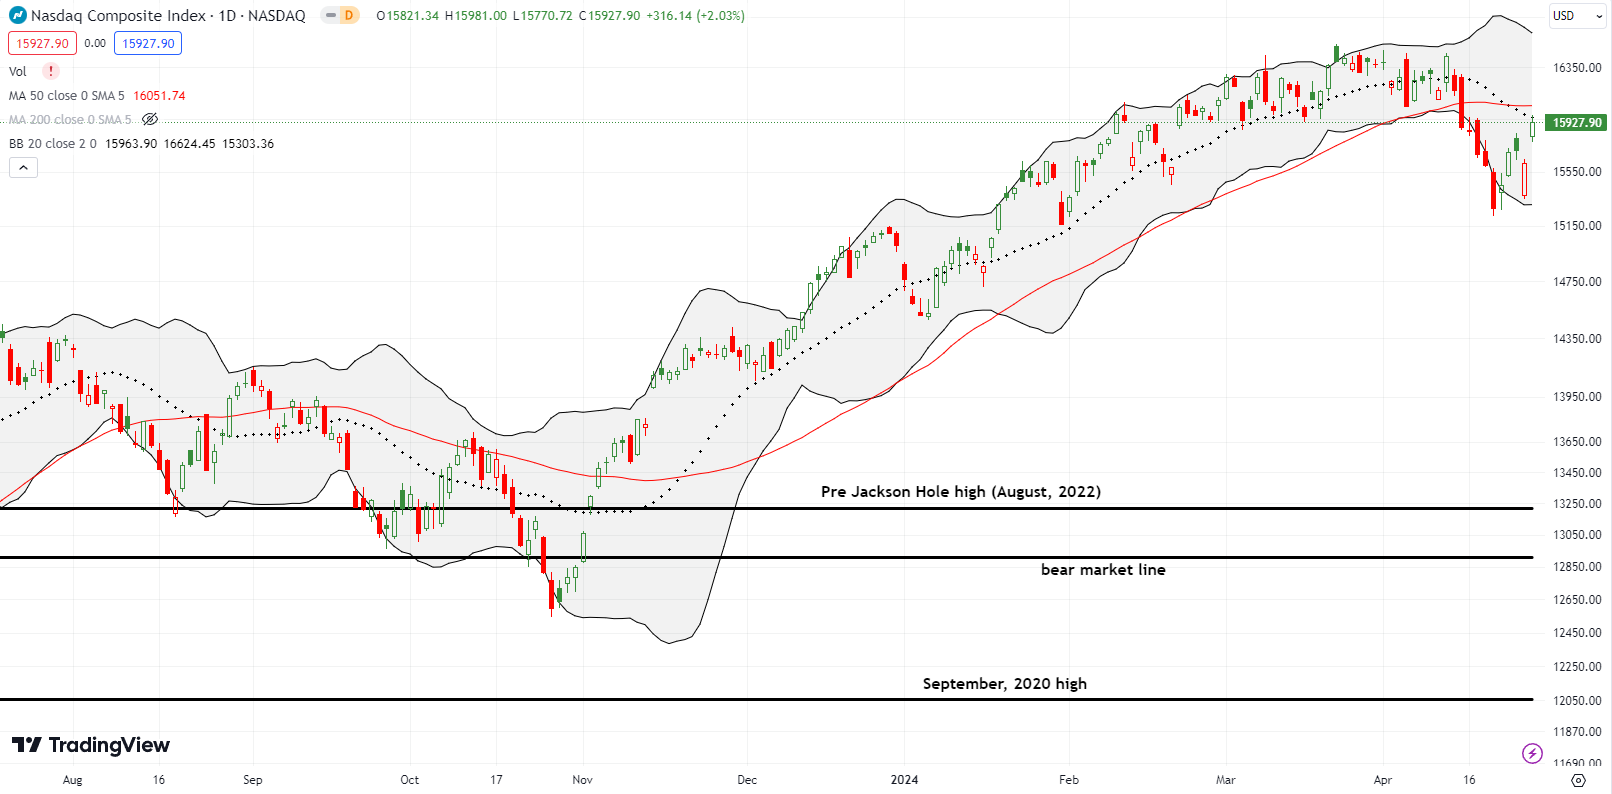
The NASDAQ (COMPQ) went from nearly losing all its gains for the year to a 4.2% gain for the week. The tech-laden index pulled off this feat despite the META-induced setback rolling back nearly all of its gains from the first three days of the week. Still, the NASDAQ failed to test 50DMA resistance and ended the week with a simple test of its 20DMA. Like the S&P 500, the NASDAQ sets up a simple trading decision going forward. If the NASDAQ closes above its 50DMA, it will be positioned to finish erasing its April loss.
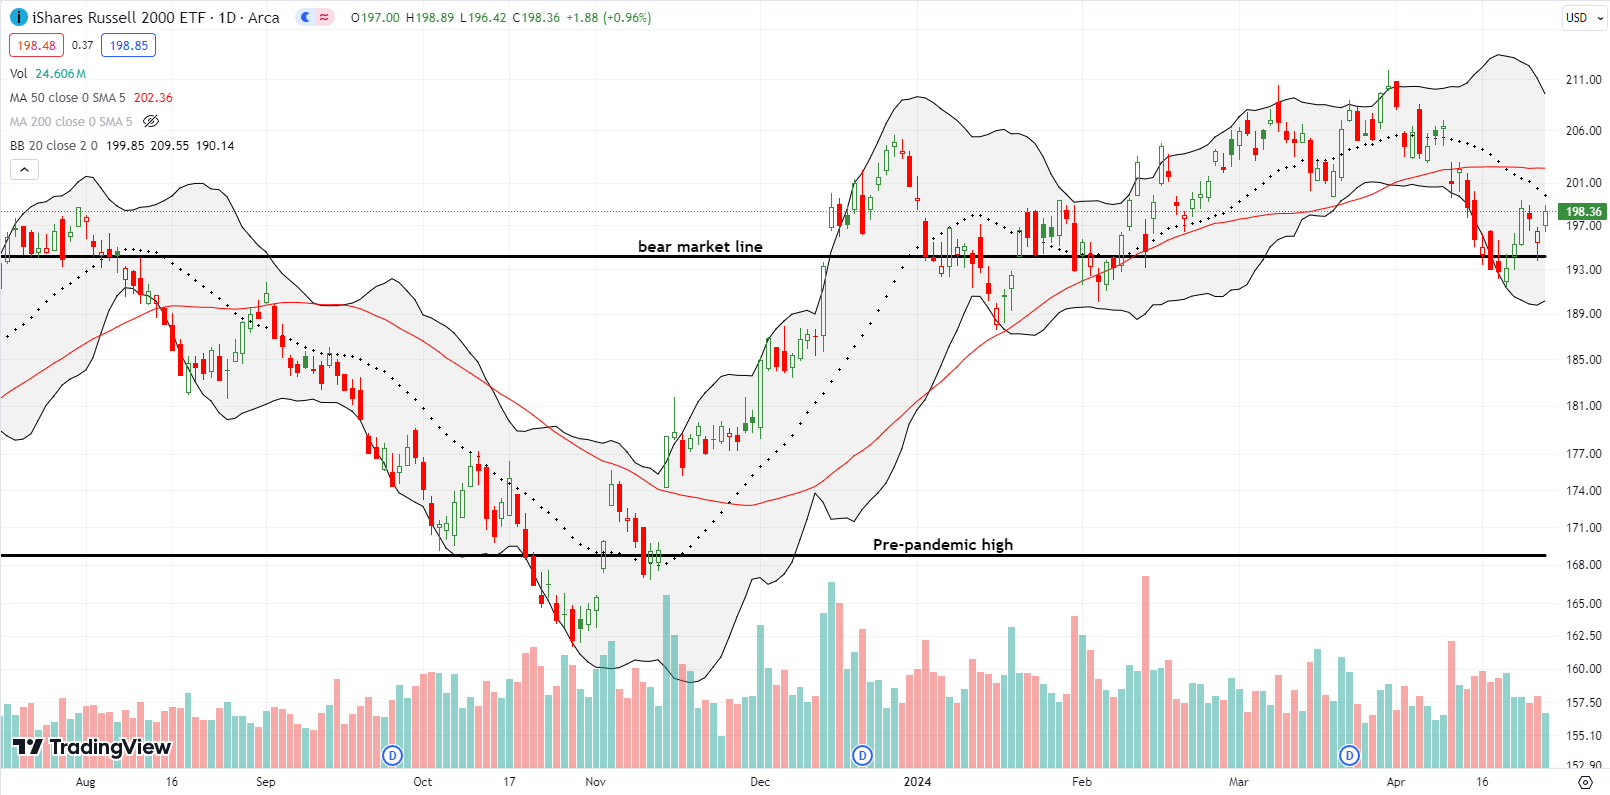
The iShares Russell 2000 ETF (IWM) did not end the week with a simple test of resistance. Instead, the ETF of small caps continued the drama with its bear market line by transforming it from resistance to confirmed support. I managed to flip IWM calls during this churn.
The Short-Term Trading Call With the Simple Test
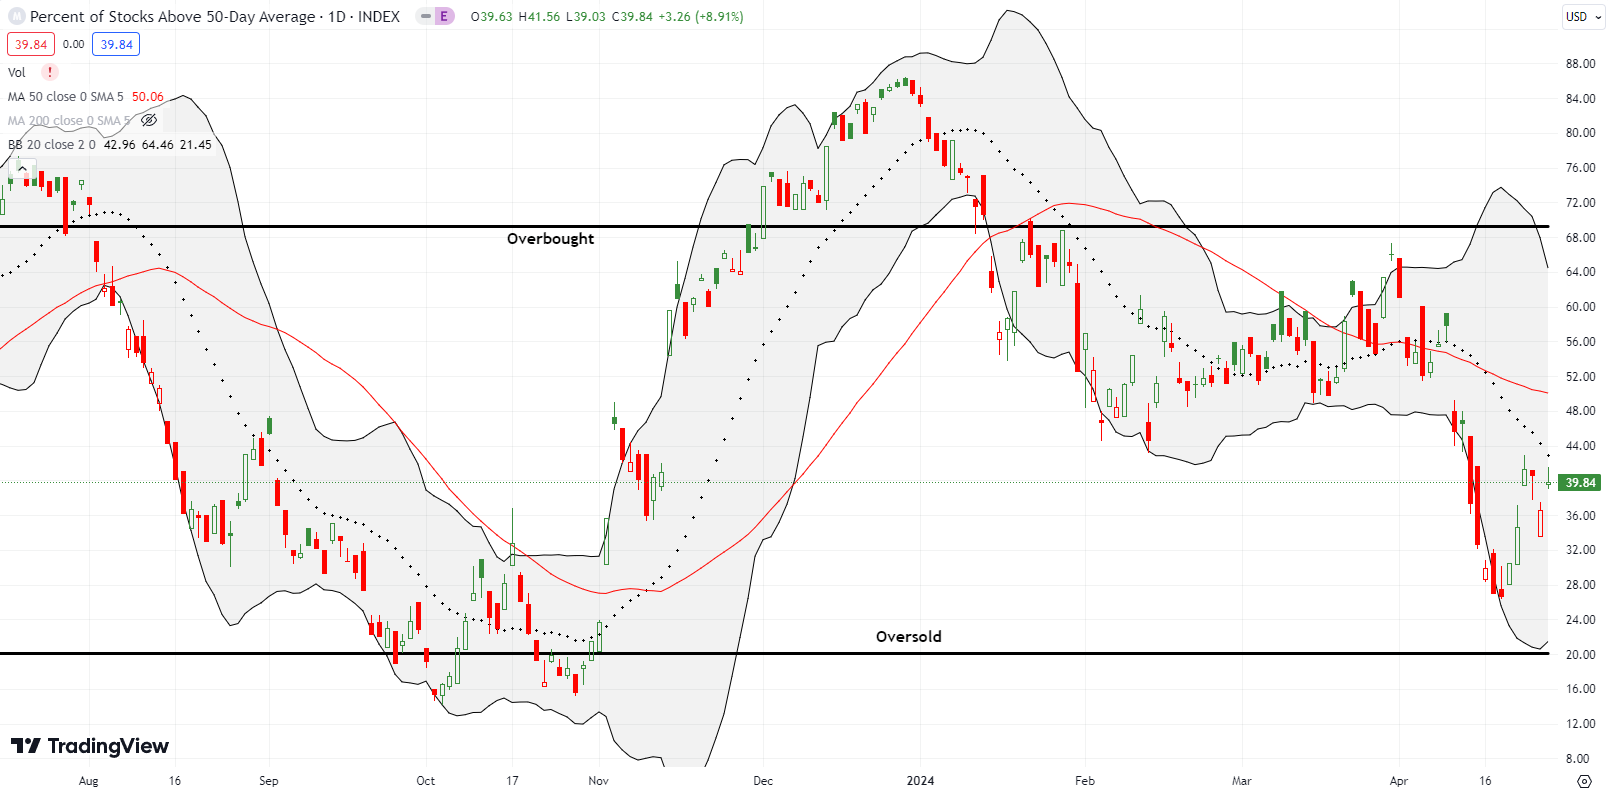
- AT50 (MMFI) = 39.8% of stocks are trading above their respective 50-day moving averages
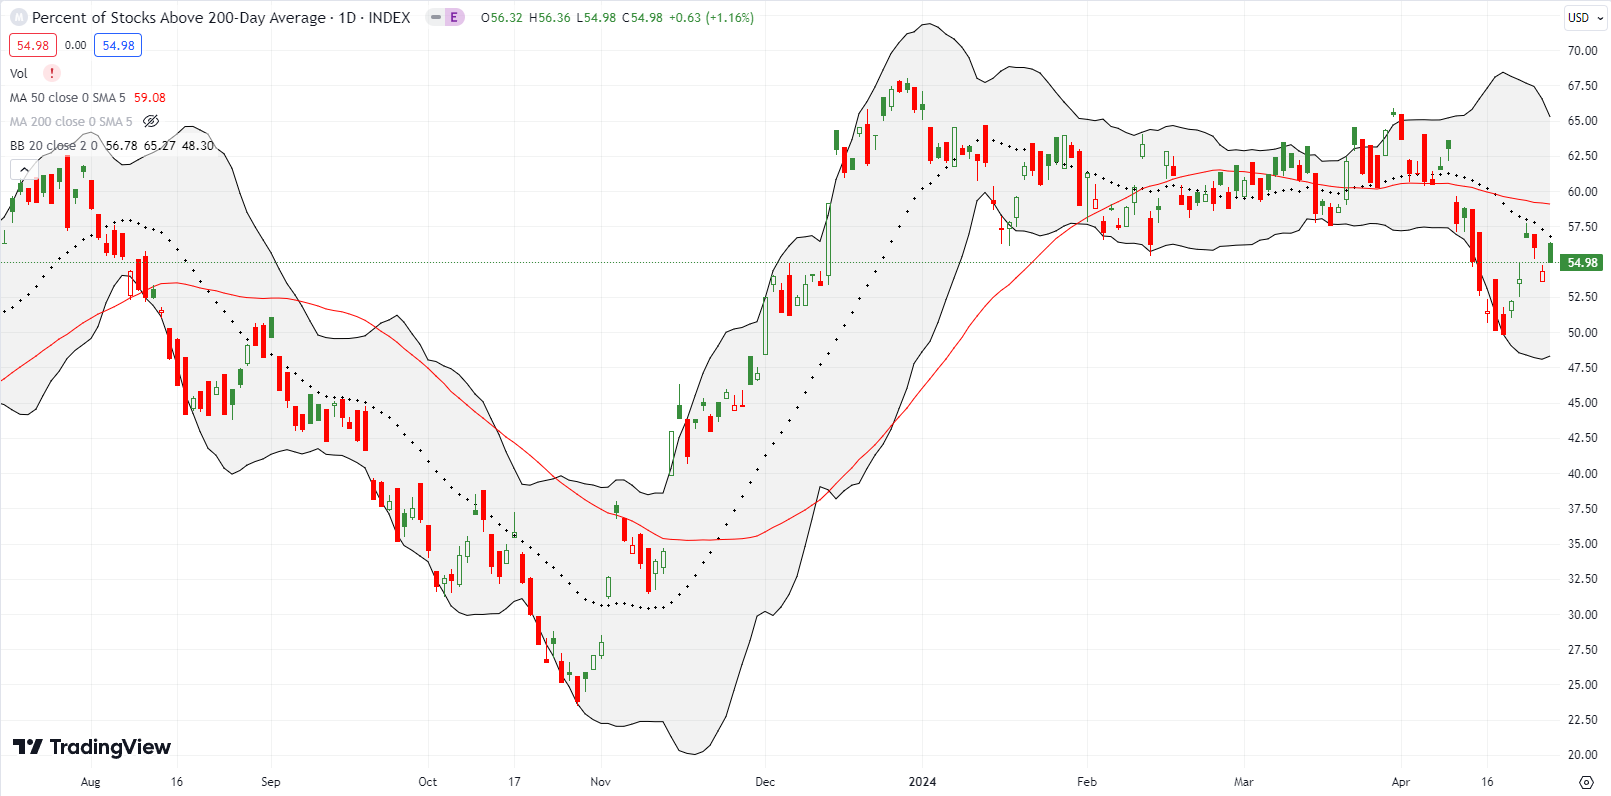
- AT200 (MMTH) = 55.0% of stocks are trading above their respective 200-day moving averages
- Short-term Trading Call: neutral
AT50 (MMFI), the percentage of stocks trading above their respective 50DMAs, closed at 39.8%. During the META-induced setback, my favorite technical indicator fell as low as 33.7% but ended the week with a 9 percentage point rebound. That day showed hints of a fresh bullish divergence in the technicals from swingtradebot.com: despite 3,764 decliners versus 1,958 advancers, there were 67 new highs versus 47 new lows and 2,409 bullish signals versus 2,151 bearish signals (stocks can trigger multiple signals).
Interestingly, AT50 closed just below its previous low of the year. Thus even this important indicator of market breadth experienced a simple test. If AT50 continues higher from here, it will confirm both the resilience of the rebound and the reduced relevance of the Magnificent Seven in determining the market’s fate in the coming months.
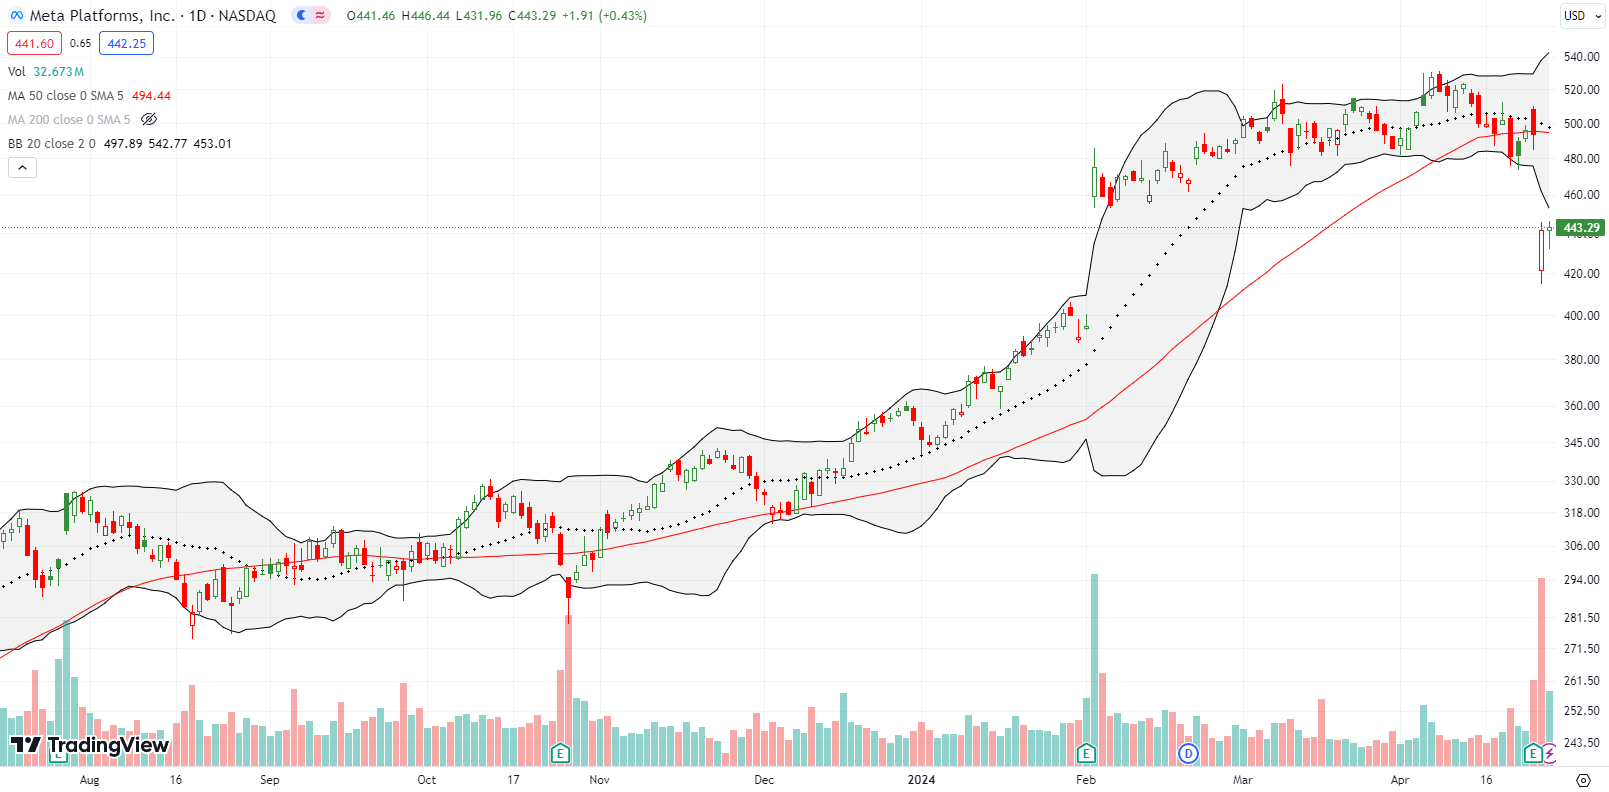
NVDA’s 10% one-day drop was the star of the show in the previous week. Last week, Meta Platforms, Inc (META) became the star of the show. Thursday was a META-induced setback as investors panicked over the company’s aggressive plans to invest in AI. The selling was violent enough to drag down a good chunk of the stock market as described above. META plunged post-earnings as much as 16.0% before closing with a 10.6% loss. At the lows, META looked ready to fill the impressive gap up from February earnings.
I missed the rebound from overstretched conditions, well below the lower BB. Instead, I bought a diagonal call spread short May 3 $460 versus long May 10 $462.50 in the hopes of profiting from stability or churn for at least the next week. The short position is basically a way to get the long call at a discount. Note that $460 is right above META’s previous post-earnings low (look for the “E” in the horizontal axis of the chart).
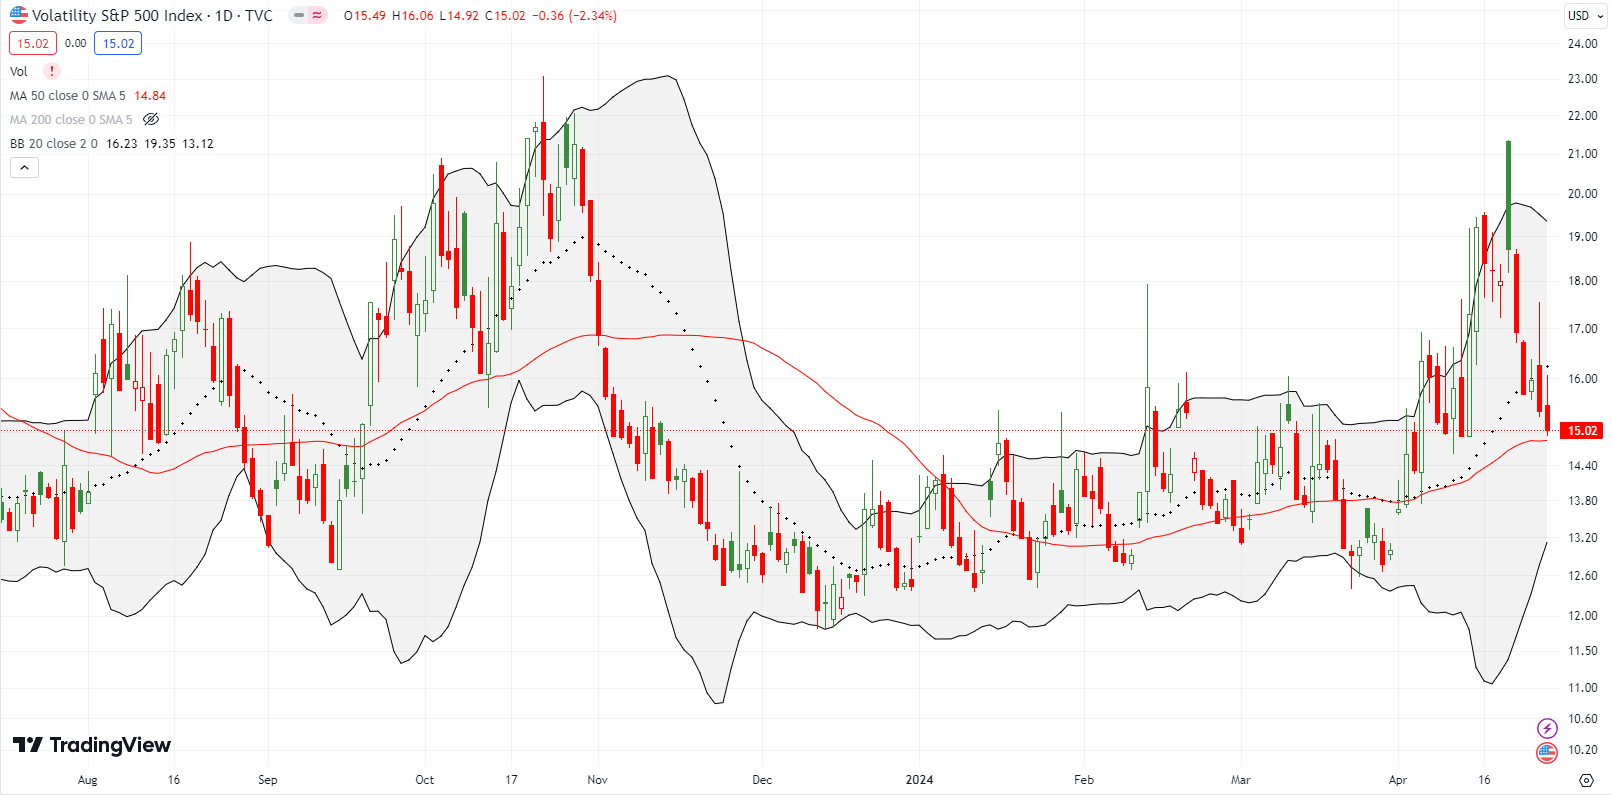
A week ago, I claimed that “the VIX’s resilient run-up is likely coming to an end for this cycle.” Sure enough, the VIX declined sharply overall for the week. Even the VIX’s META-induced surge on Thursday was faded so sharply that the VIX ended the day with a loss. The VIX closed the week completing a full reversal of the red flag surge from two weeks ago. If the on-going uptrend holds, the VIX will bounce from around current levels for a fresh cycle of angst. A continued fade would instead confirm the bullish implications of an S&P 500 breakout above its 50DMA. This additional simple test should be consistent with the others.
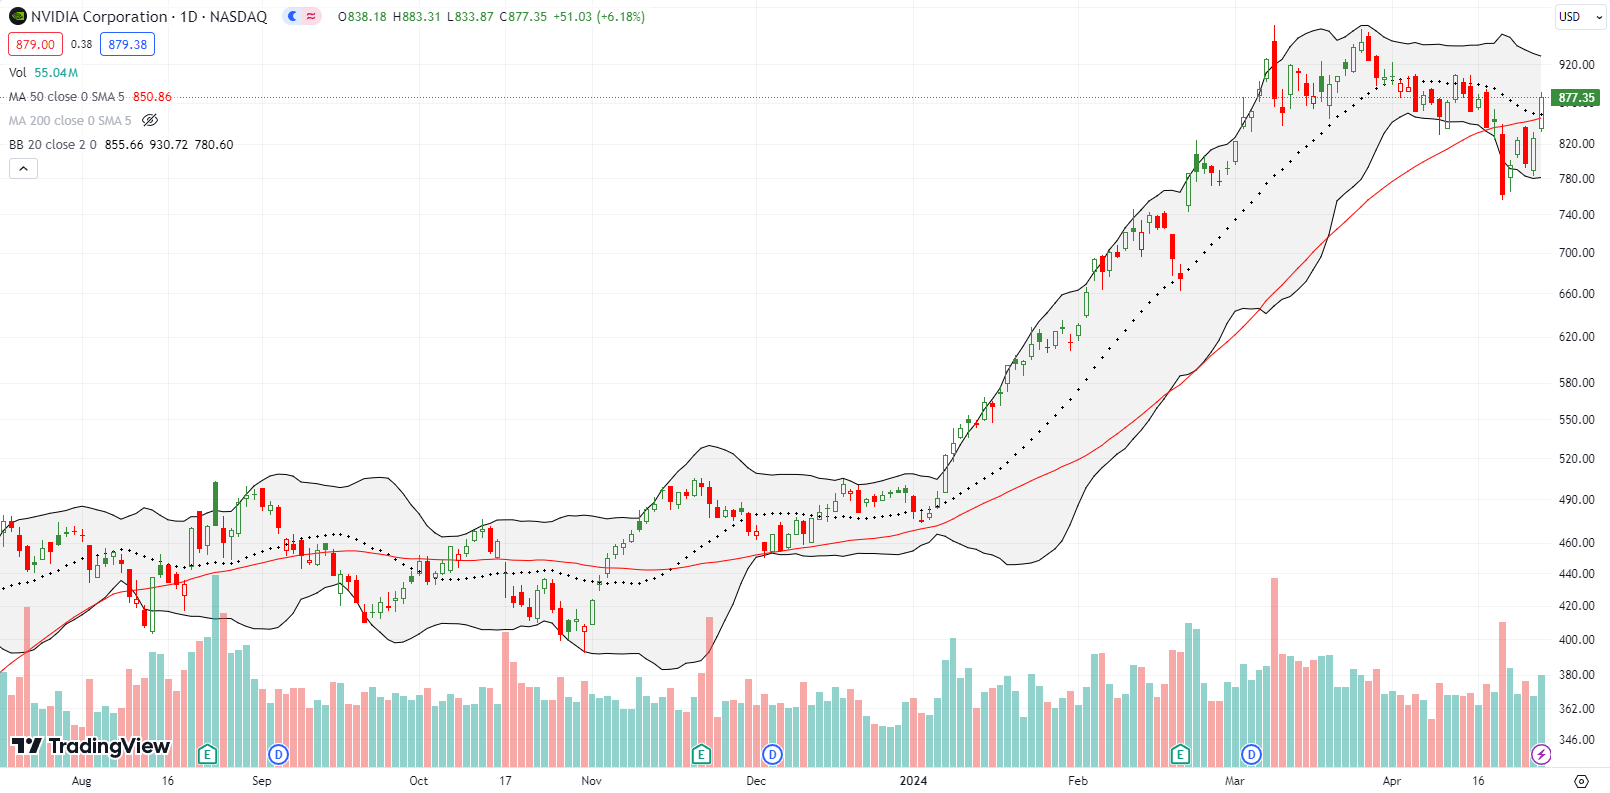
If not for META’s meltdown, NVIDIA Corporation (NVDA) would be the star of the week a second week in a row. NVDA made a valiant comeback. After losing 10% in one day two Fridays ago, NVDA rallied 15.1% for the week. NVDA even closed above its converged resistance at the 20DMA and 50DMA. A topping pattern is still in effect, but NVDA put in a strong bid by invalidating the technical warning it flashed just two days before. I could not bring myself to buy NVDA just above my (initial) $750 target, but I did add to my Robo Global® Artificial Intelligence ETF (THNQ) position which has a 2.6% allocation to NVDA.
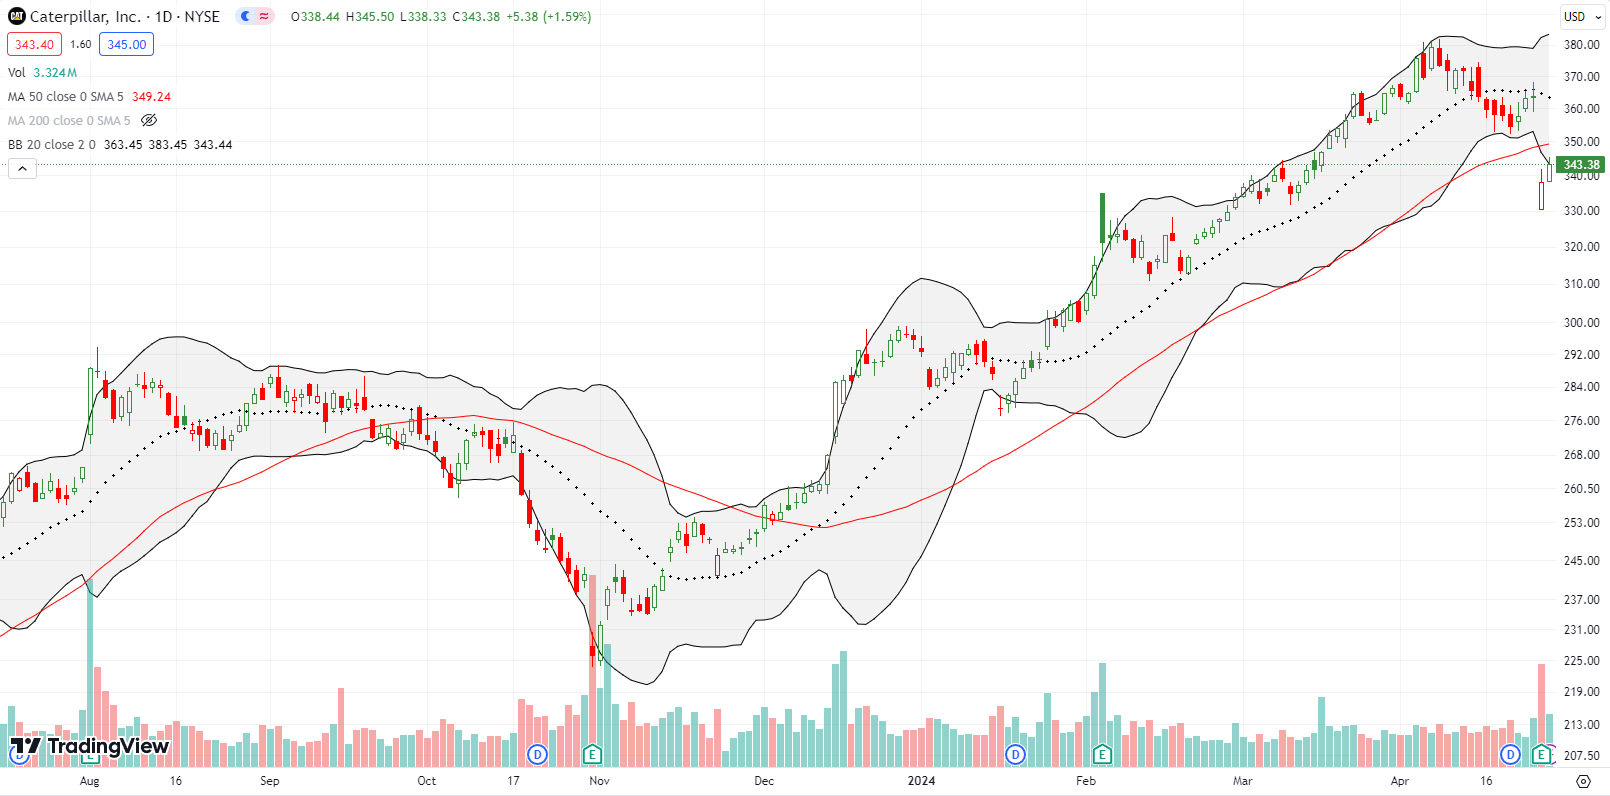
Caterpillar, Inc. (CAT) is my favorite hedge against bullishness, yet I did not think to buy CAT put spreads ahead of earnings. As a result I missed a tremendous opportunity with CAT falling as much as 9.1% post-earnings. CAT closed with a 7.0% loss and a rebound continued the next day with a 1.6% gain. I will fade CAT at 50DMA resistance no matter the tone in the rest of the market. I own a fading put option that remains from a calendar put spread.
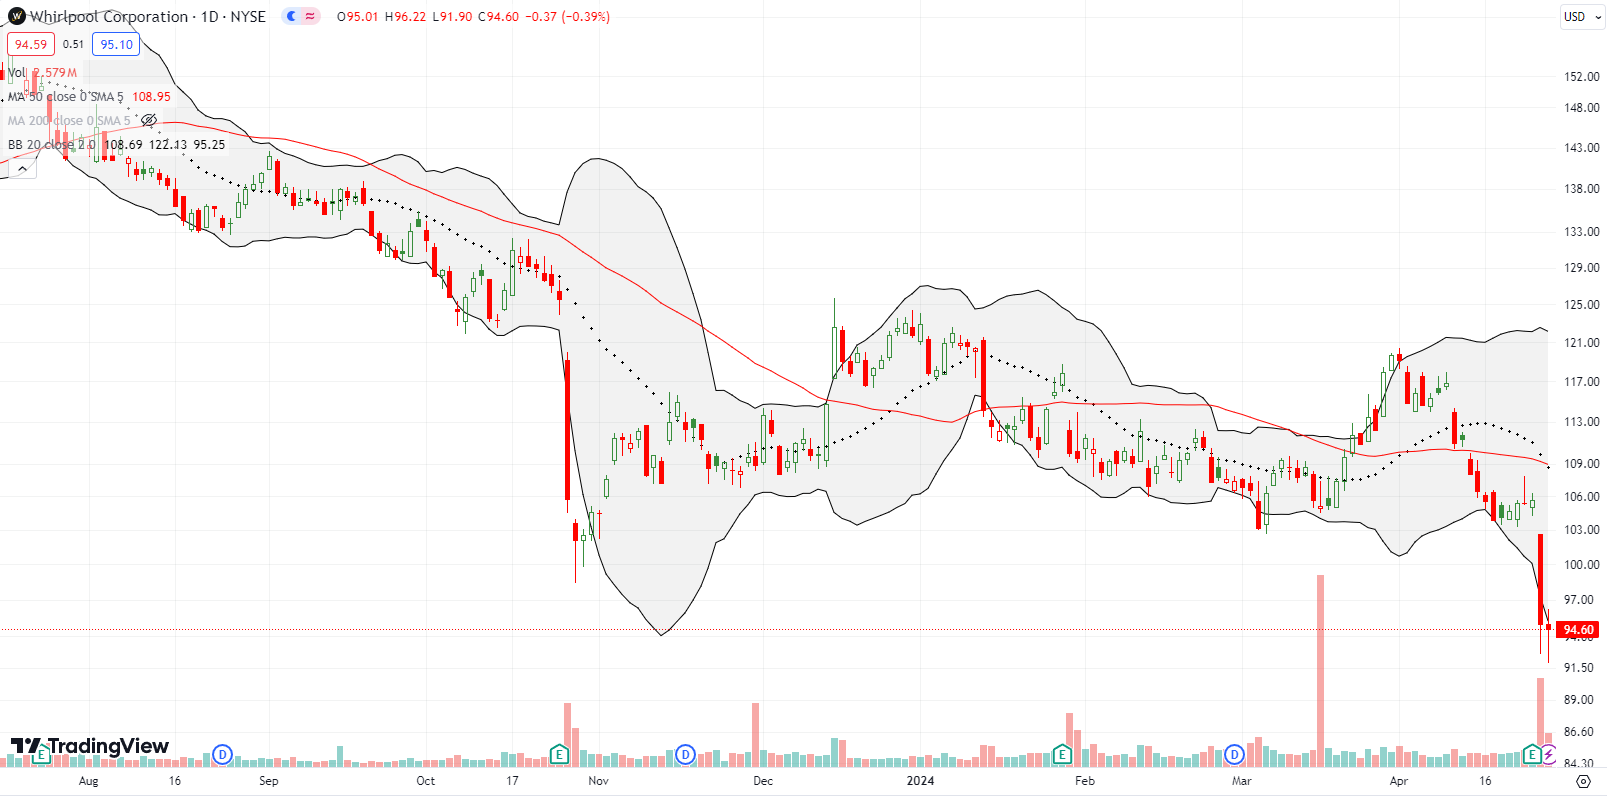
Appliance-maker Whirlpool Corporation (WHR) has struggled since its all-time high in 2021. WHR failed to follow the rebound in the housing market over the past year. The stock’s resilience since last October’s earnings disaster gave way to a fresh earnings disaster. WHR lost 10.1% and set a 4-year low. Buyers made a bid for a bottom with two straight rebounds from the intraday lows.
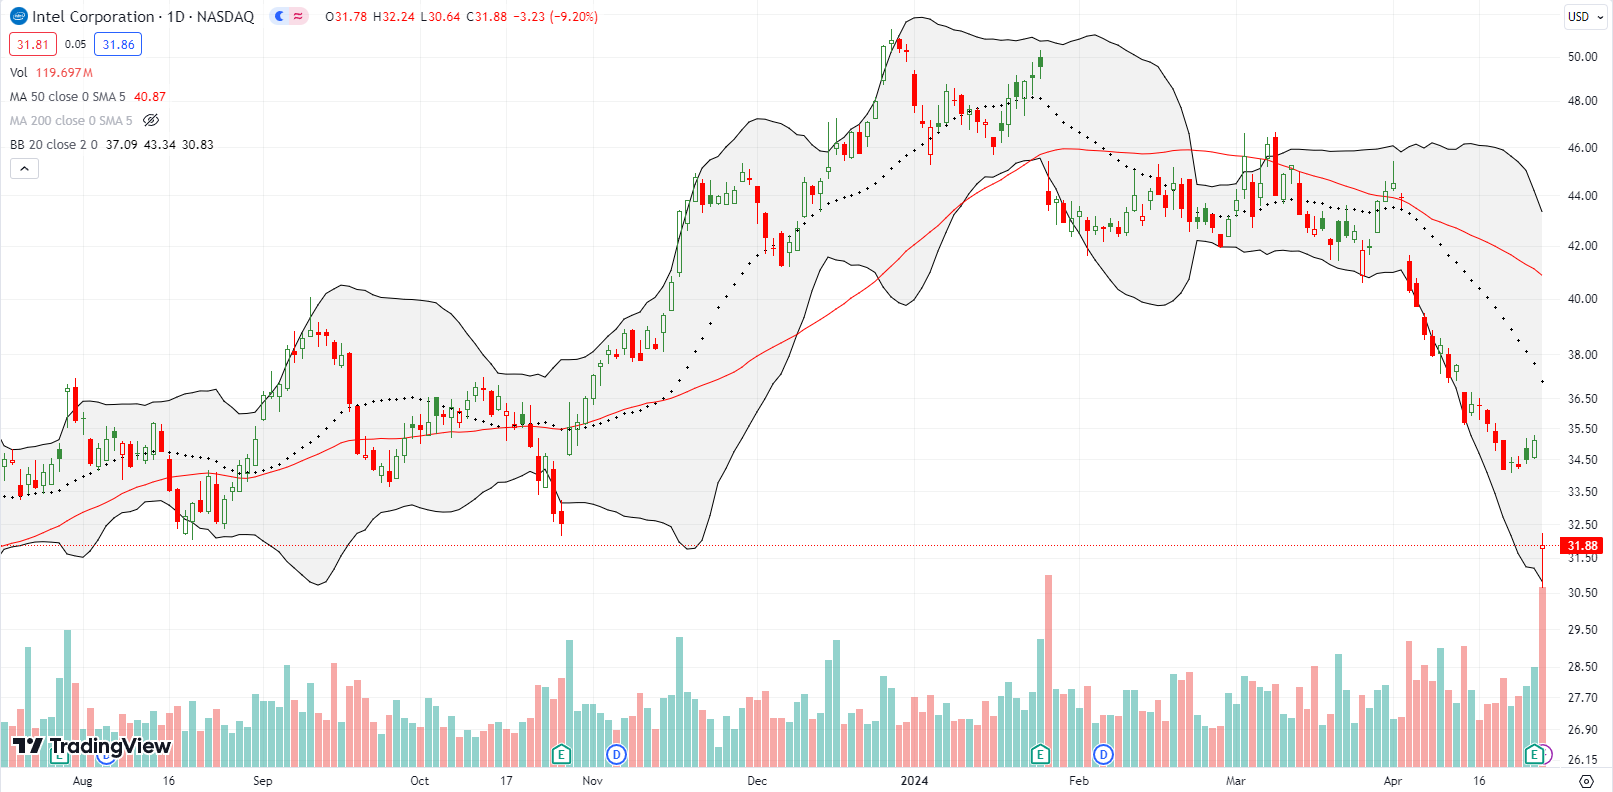
Intel Corporation (INTC) was already having a disastrous April thanks to a business update earlier in the month. INTC will end the month with an exclamation point after a 9.2% post-earnings loss. At a 9-month low, I would like to think INTC is primed for my between earnings trading strategy for the stock. A post-earnings closing high pulls me to the speculation table.
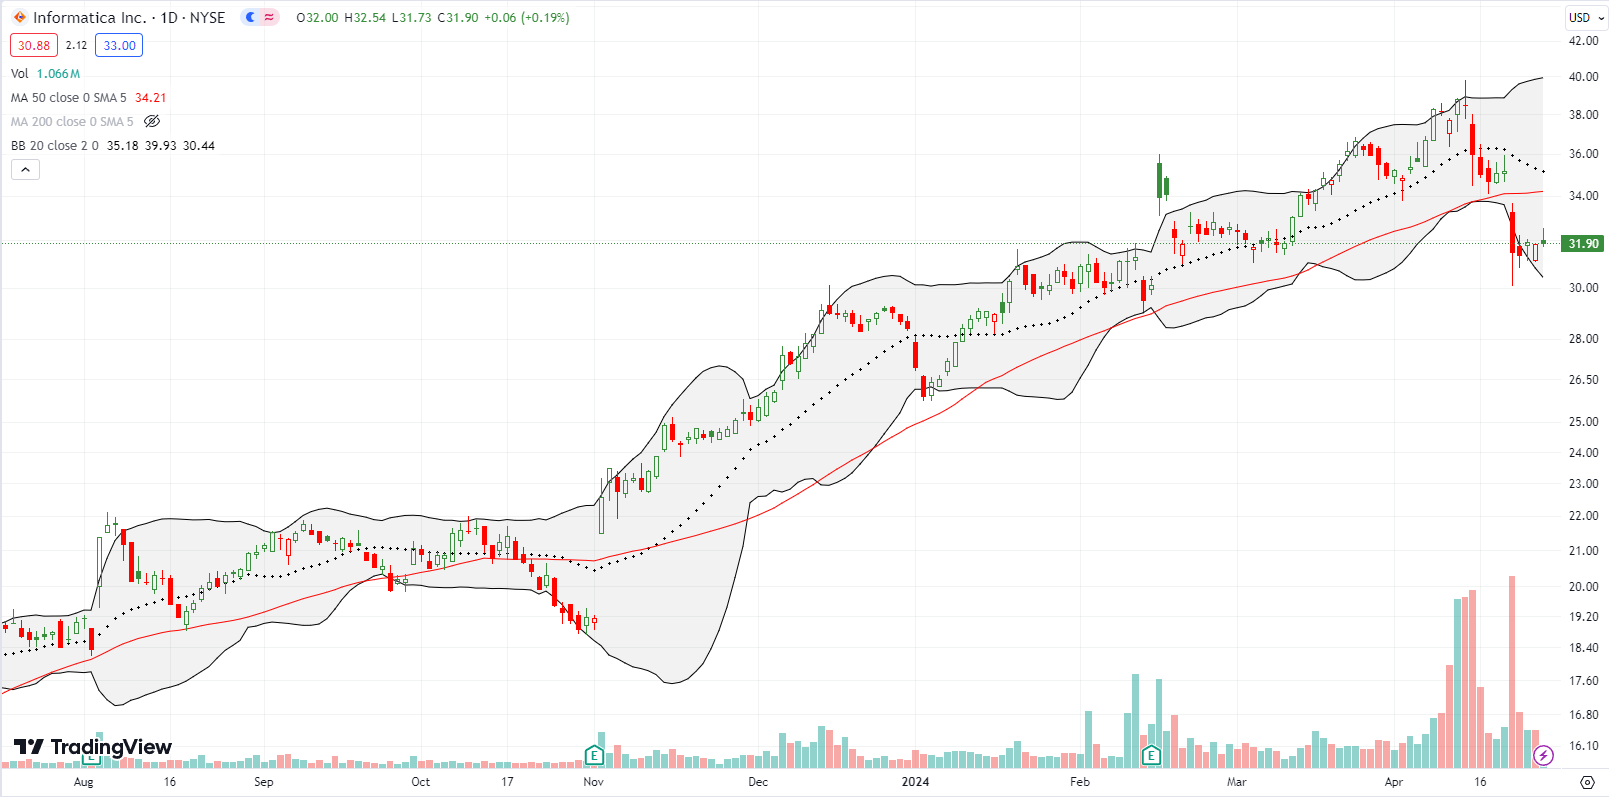
The drama continues for Informatica Inc (INFA). INFA fell 10.5% to start the week with a 50DMA breakdown. Investors did not like the company’s business and financial update clarifying that “it is not currently engaged in any discussions to be acquired.” This news was even worse than the earlier rumors that acquisition talks stalled between INFA and Saleforce.com (CRM) because of pricing. Suddenly, the entire run-up that apparently was at least partially fueled by M&A rumors is in danger. Still, INFA somehow managed to hold the gap up from last earnings. I broke technical trading rules by adding to my position on the pullback: I am still a fan of the company.
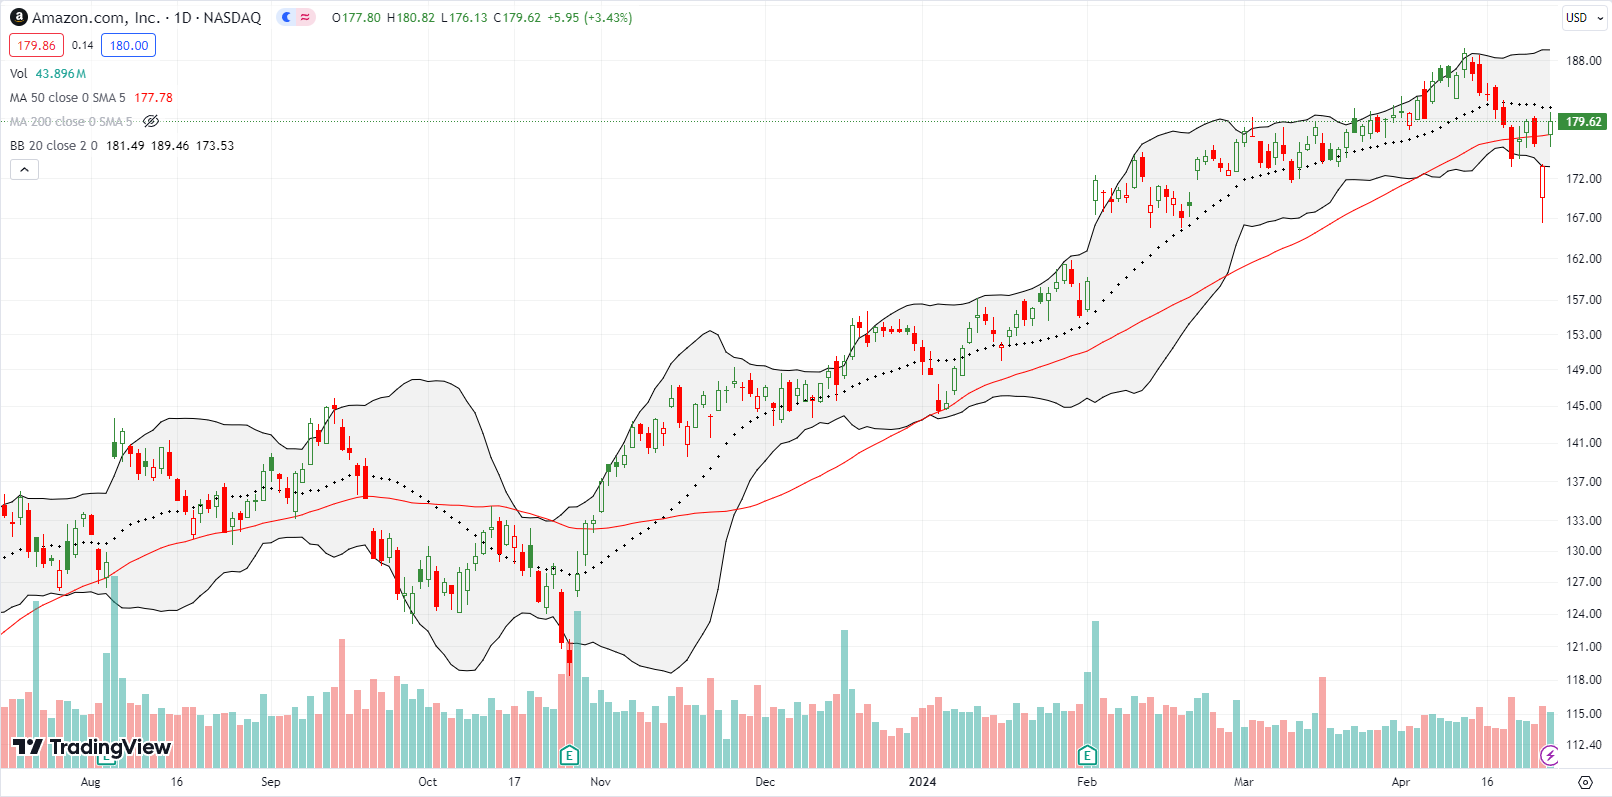
Amazon.com (AMZN) flipped from flashing a danger sign to restoring hope for big cap tech stocks. AMZN plunged in big cap tech sympathy with META on Thursday with a gap down and a loss as large as 5.8%. Buyers jumped on the overstretched condition well below the lower BB and closed AMZN with a 1.7% loss. Buyers next proceeded to strand sellers and bears with a gap up and 50DMA breakout. This action essentially created an abandoned baby bottom and positions AMZN to help hold the mantle for big cap tech.
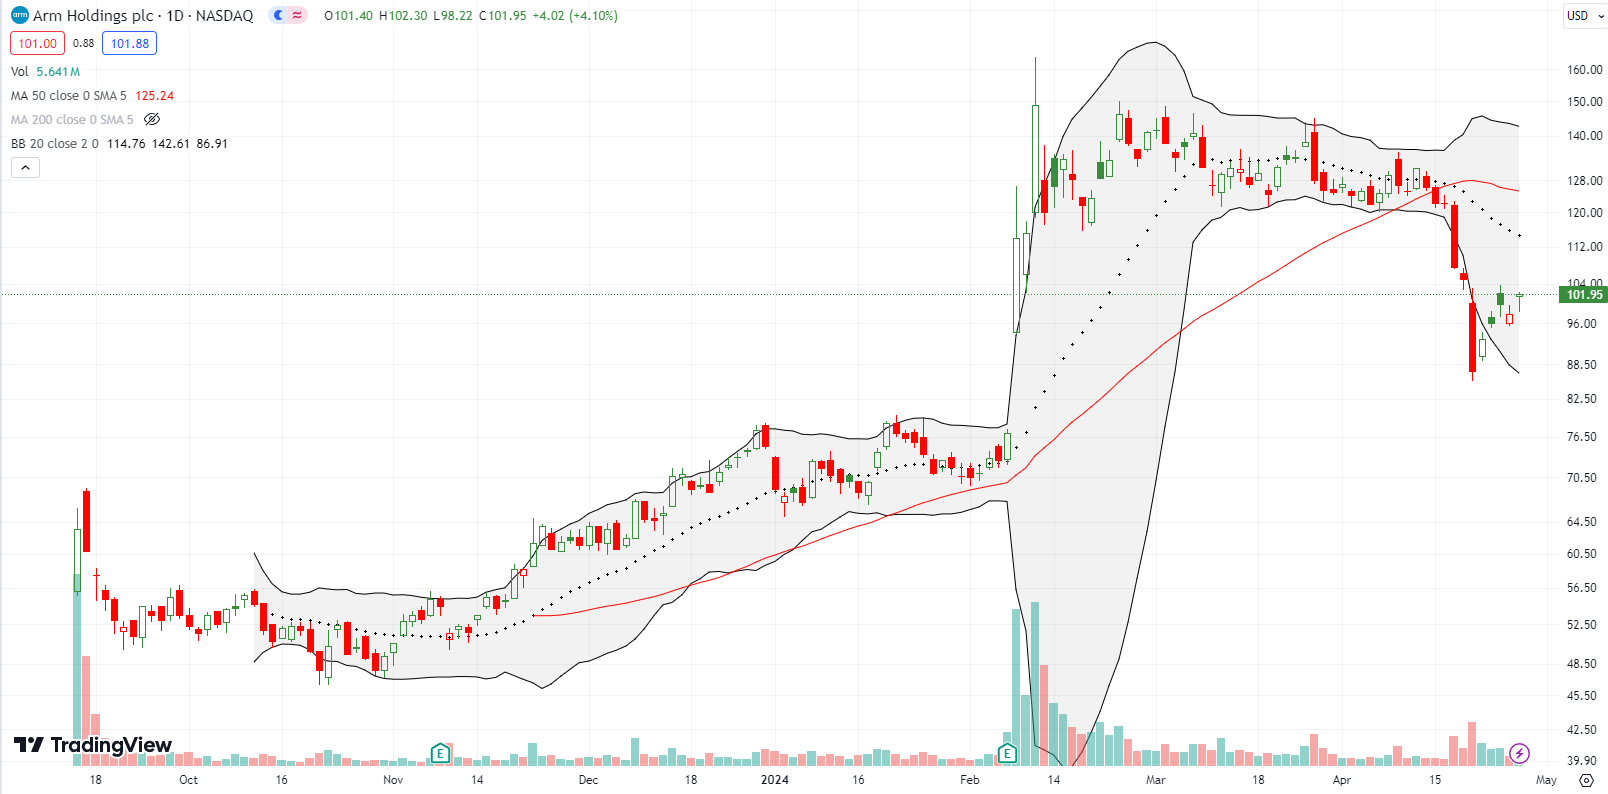
Led by NVDA, semiconductor stocks got crushed in the prior week. Arm Holdings plc (ARM) not only lost a stunning 16.9% that Friday, the stock lost 31.0% for that week! Still, ARM did not close the monster post-earnings gap up from February. Buyers stepped in last week and reversed last Friday’s loss. If semiconductor stocks continue to recover, ARM presents a tremendous comeback opportunity. I flipped two ARM trades last week. Unlike NVDA, I thought ARM was so incredibly (short-term) extreme, I jumped into bullish trades.
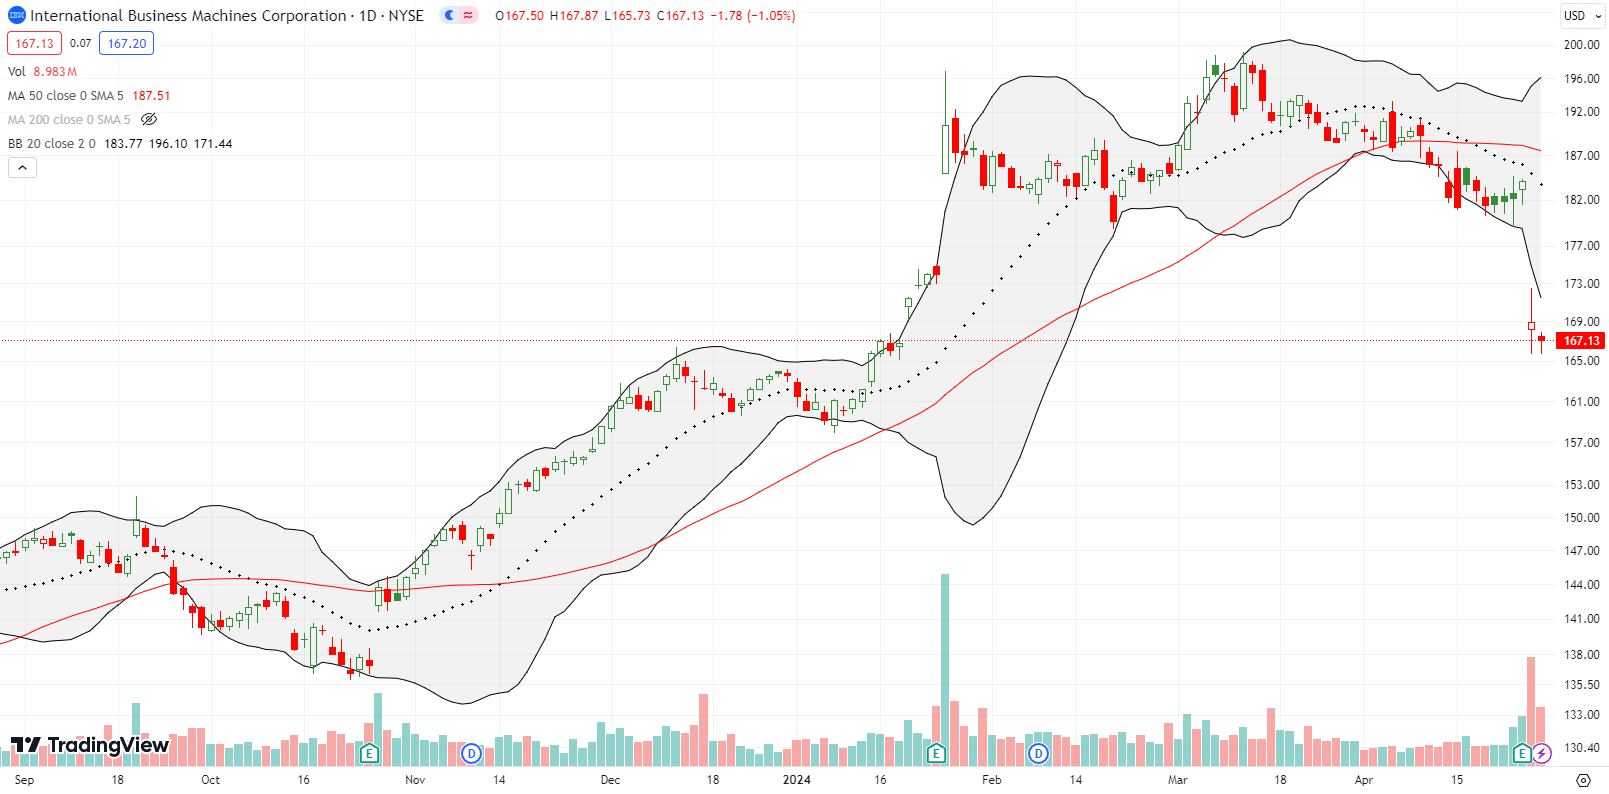
International Business Machines Corporation (IBM) made an earlier bid to enter my generative AI trading basket. An 8.3% post-earnings loss made me lose interest (and money as I had a pre-earnings call spread in play). This loss not only reverses IBM’s post-earnings gap higher from January, but also reversed IBM’s entire 2024 breakout. Technically, this sets IBM up for a rebound, but I am barely interested. Part of IBM’s loss was likely from confirming the acquisition of HashiCorp (HCP) however it seemed to be a done deal before earnings.
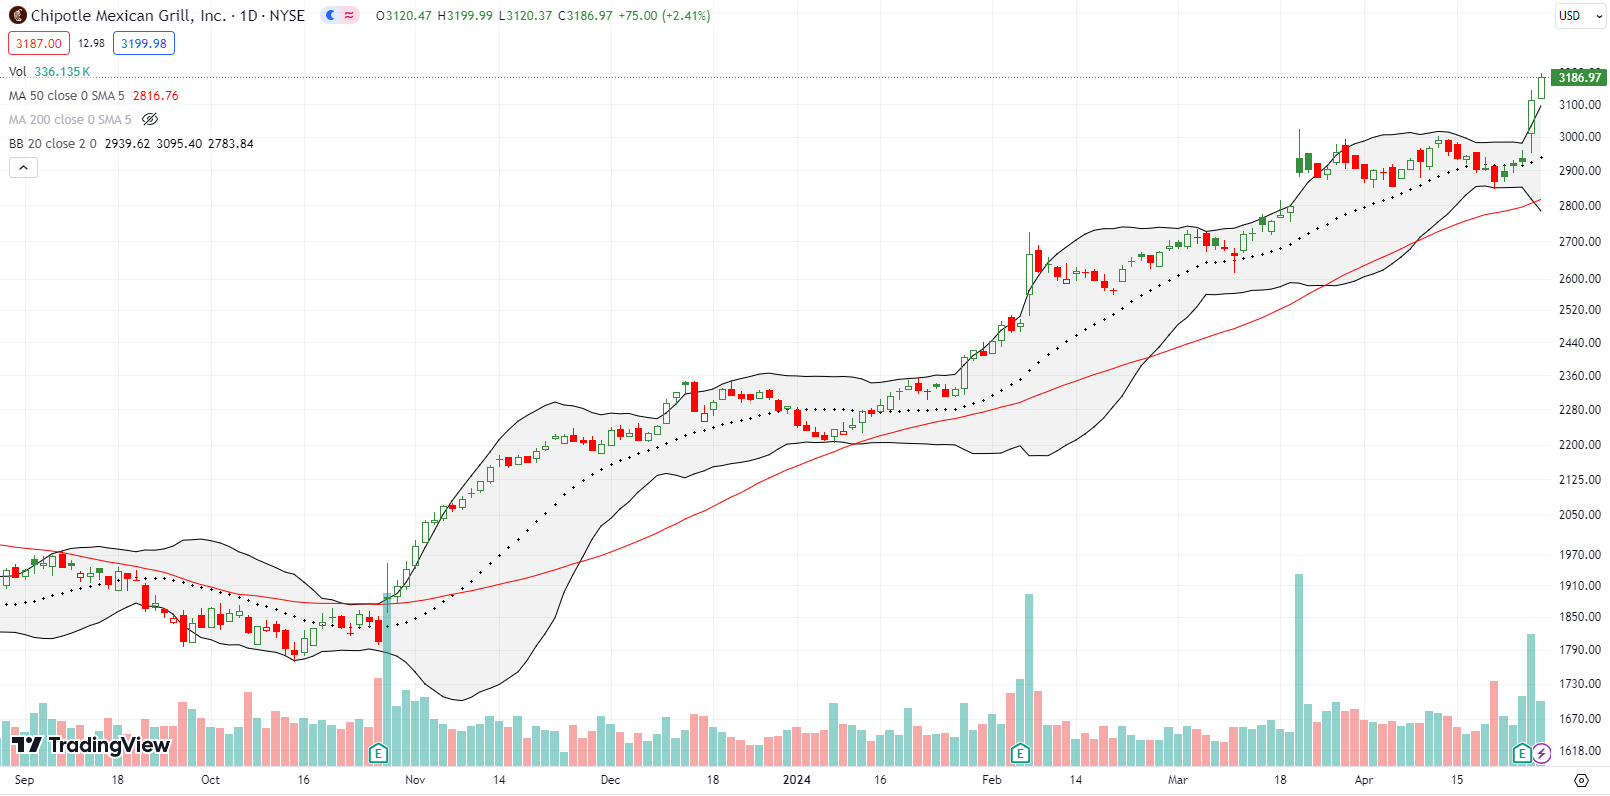
Chipotle Mexican Grill, Inc (CMG) gained 3.5% on March 20th after news of a 50:1 stock split. At the time I warned against buying CMG just for the split. No matter. CMG earnings once again astounded investors. The stock gained 6.3% post-earnings on Thursday. Buyers set another all-time high the next day with a 2.4% follow-up. While CMG is over-stretched above the upper BB, CMG’s uptrend is as strong as ever.
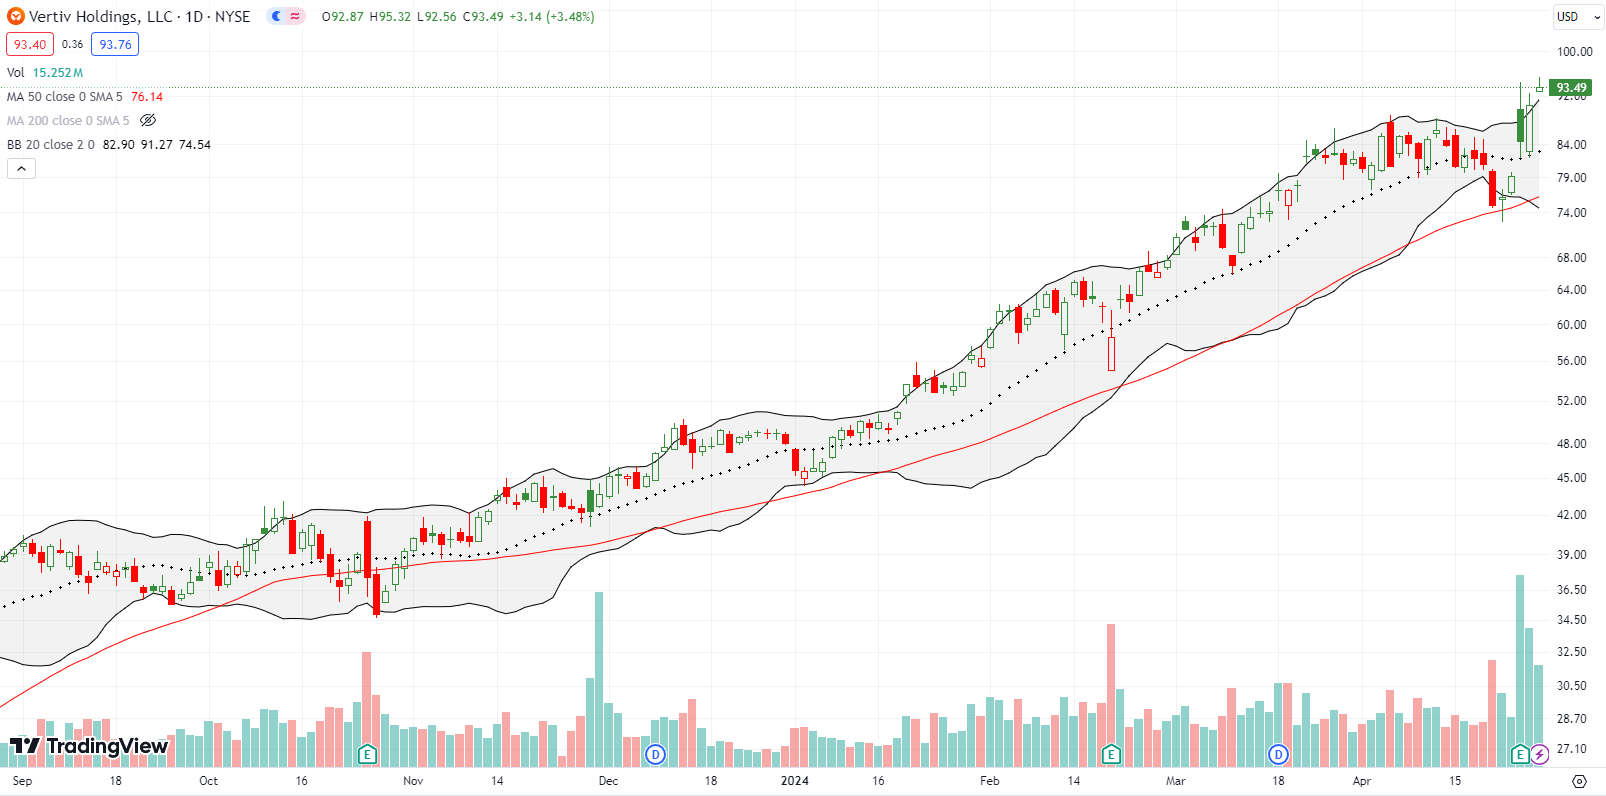
I am not sure how I missed Vertiv Holdings, LLC (VRT) for so long. This company is a critical player in the generative AI race with its technology for data centers. Vertiv “designs, manufactures, and services critical digital infrastructure technologies and life cycle services for data centers, communication networks, and commercial and industrial environments.” I prepared to buy shares after another strong earnings performance. I bought two tranches and ended the week happy I decided to get aggressive. Welcome to the generative AI basket VRT! Hopefully, it is better late than never for me.
This CEO interview from 4 months ago is enough said….
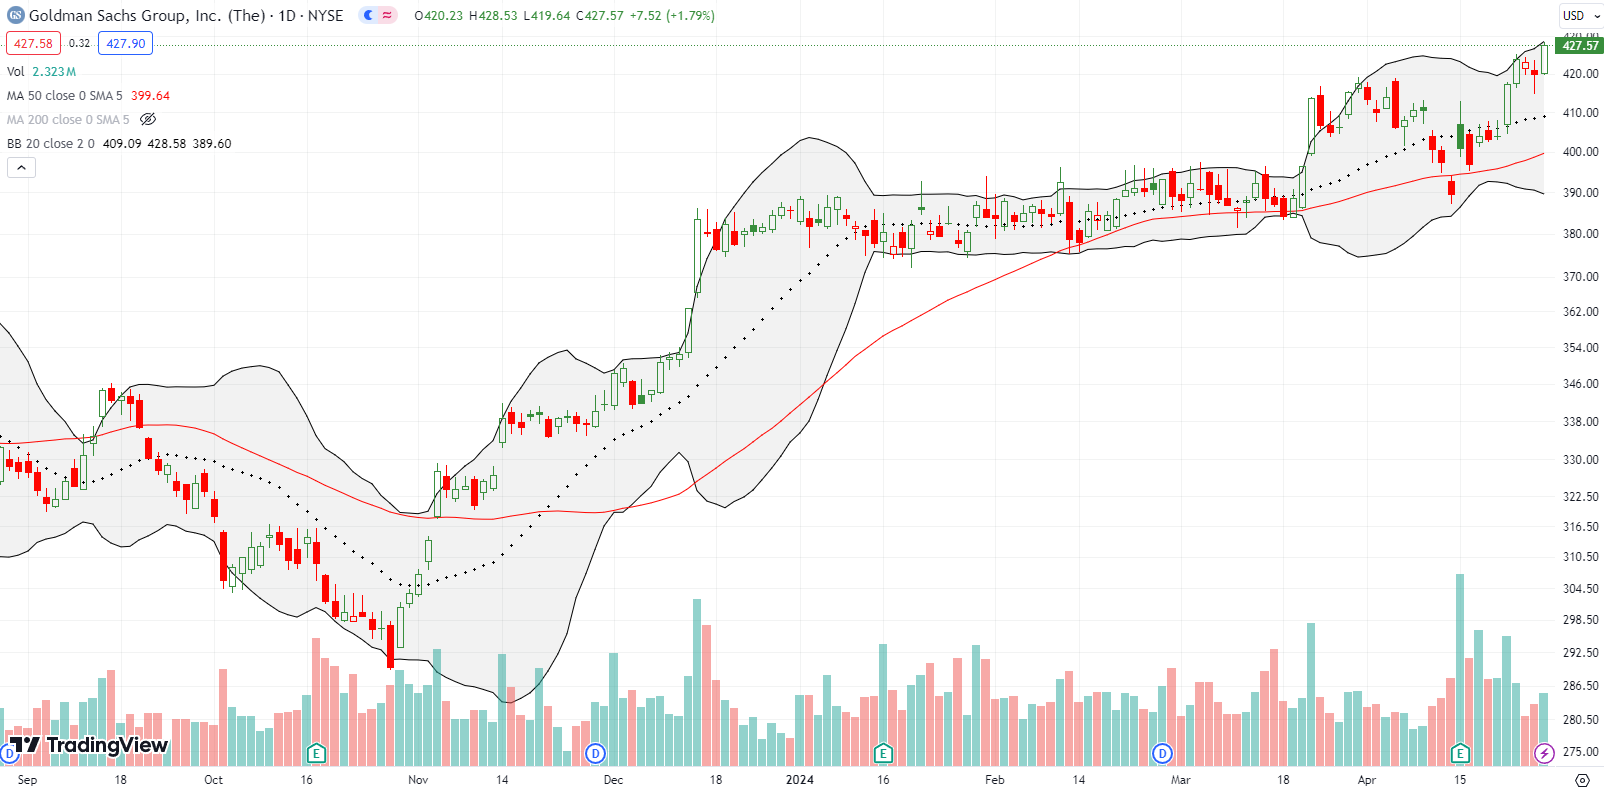
First it was Wells Fargo (WFC) surprising me with a breakout to an all-time high. Now here comes Goldman Sachs (GS). The post-earnings reaction the week prior was deceptive. A 50DMA breakout and 2.9% gain was almost completely reversed the next day. However, the 50DMA held as support, and GS ground higher from there. GS closed last week at an all-time high. I am a buyer on dips.
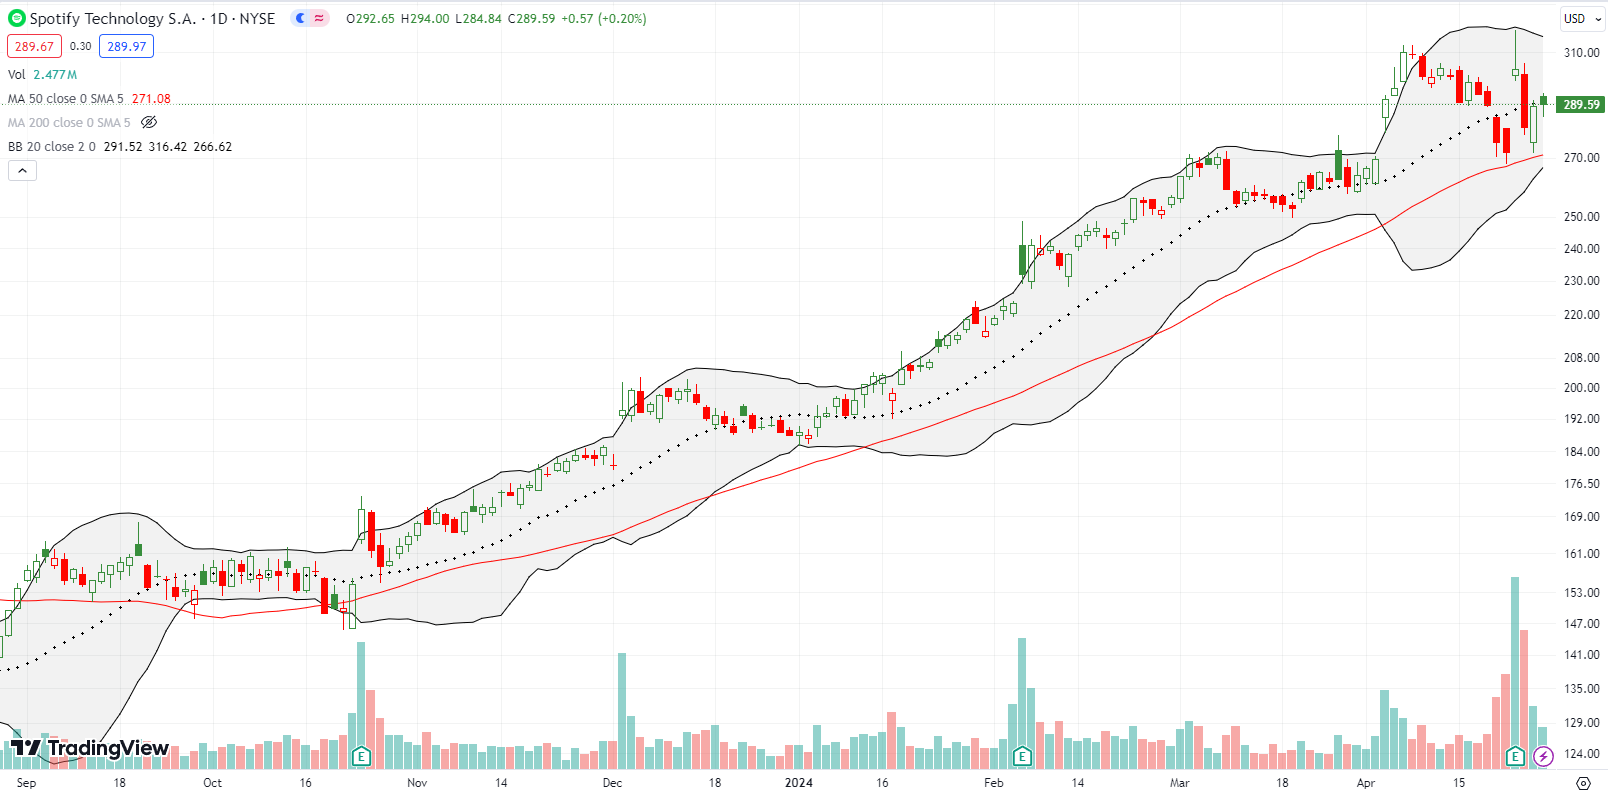
Audio-streaming service Spotify Technology S.A. (SPOT) surged as much as 17% post-earnings to a new all-time high. However, sellers faded SPOT from there and in the next two days reversed the entire post-earnings gain with a test of 50DMA support. That support held with a 2.8% rebound despite the META-induced pullback in the market. I over eagerly bought a call spread on the first post-earnings fade. The position will be a close call.
Be careful out there!
Footnotes
Subscribe for free to get email notifications of future posts!
“Above the 50” (AT50) uses the percentage of stocks trading above their respective 50-day moving averages (DMAs) to measure breadth in the stock market. Breadth defines the distribution of participation in a rally or sell-off. As a result, AT50 identifies extremes in market sentiment that are likely to reverse. Above the 50 is my alternative name for “MMFI” which is a symbol TradingView.com and other chart vendors use for this breadth indicator. Learn more about AT50 on my Market Breadth Resource Page. AT200, or MMTH, measures the percentage of stocks trading above their respective 200DMAs.
Active AT50 (MMFI) periods: Day #107 over 20%, Day #6 over 30% (overperiod), Day #2 under 40% (underperiod), Day #13 under 50%, Day #19 under 60%, Day #74 under 70%
Source for charts unless otherwise noted: TradingView.com
Full disclosure: long META calendar call spread (unbalanced), long CAT put, long INFA, long VRT, long SPOT call spread
FOLLOW Dr. Duru’s commentary on financial markets via StockTwits, Twitter, and even Instagram!
*Charting notes: Stock prices are not adjusted for dividends. Candlestick charts use hollow bodies: open candles indicate a close higher than the open, filled candles indicate an open higher than the close.

LOVED the Chipotle video! 🤣
Thanks!