Stock Market Commentary
The stock market delivered a gift on Friday as I scrambled to de-risk following the Bank of Japan’s drama on monetary policy. I braced for selling into bearish pressure and instead was pleasantly greeted by a broad push higher for stocks from the open. After the dust settled on the day, I finished climbing down from my aggressively bullish perch and rested on a pillow that will allow me to sleep at night.
Market breadth returned to overbought trading conditions as buyers made their push to invalidate the topping patterns that appeared just a day before. Some important sector ETFs like semiconductors and home builders promptly returned to all-time highs. The remarkable turn-around spoke volumes about the initial over-reaction to the potential change in monetary policy from the Bank of Japan. The actual policy, and then, presumably, a favorable inflation print from the June Personal Consumption Expenditure (PCE) report, reinvigorated buyers.
Traders could see the coming rebound as I wrote in the last “Market Breadth” post showing AUD/JPY (the Australian dollar versus the Japanese yen) was on the rebound. Per Reuters, the yen drama is far from over. We will likely look back at this moment as the week that the yen (FXY) finally began a process of bottoming out. If so, the stock market will need different fuel than the carry trade to continue higher. This is an important wildcard to consider as the stock market heads into its most dangerous three months of the year.
The Stock Market Indices
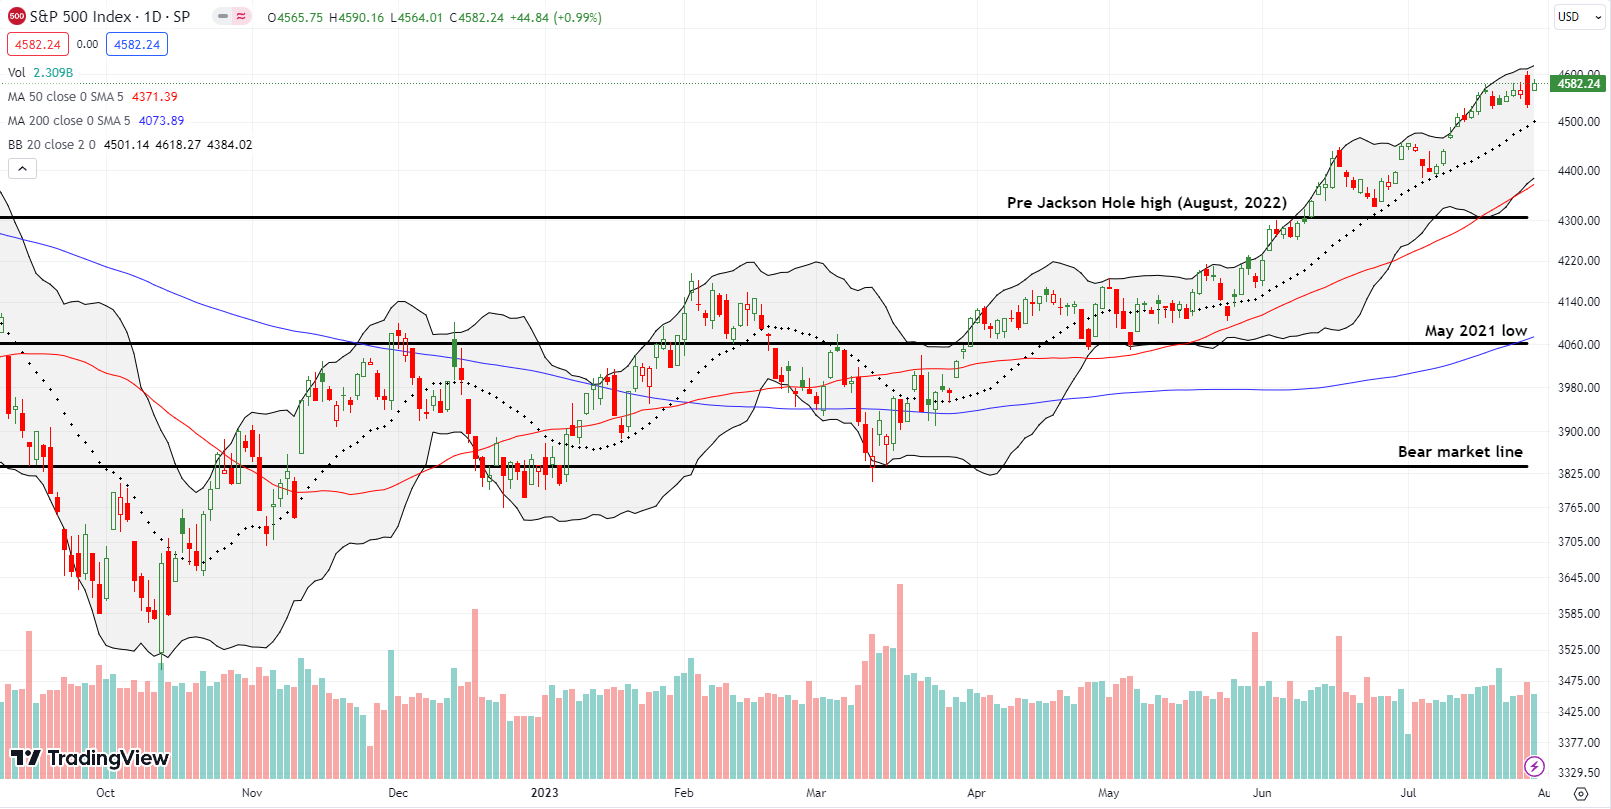
The S&P 500 (SPY) gained 1.0% for the week. The persistent uptrend, still defined by the 20-day moving average (DMA) (the dotted line below), was sharply interrupted by the drama over the Bank of Japan’s monetary policy. Friday’s gap higher and 1.0% rebound defined all the gains for the week as buyers push against the bearish engulfing pattern that holds as a top for the index for now.
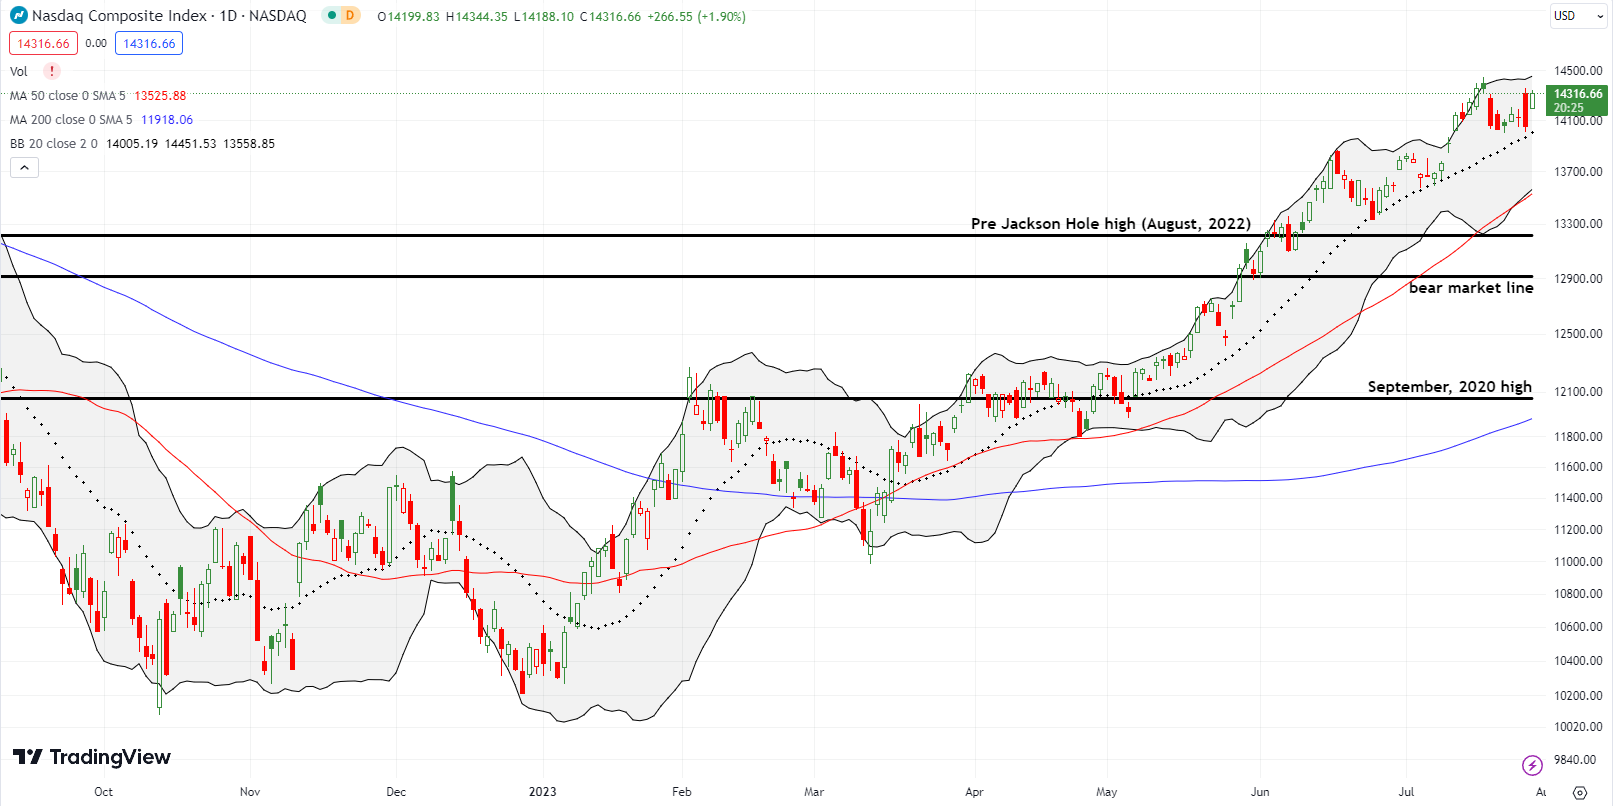
The NASDAQ (COMPQ) also gapped higher. Also like the S&P 500, the tech-laden index scored almost all its gains for the week with Friday’s 1.9% surge. The NASDAQ’s topping pattern barely remains in place as Friday’s sharp rebound also confirmed the 20DMA as support.
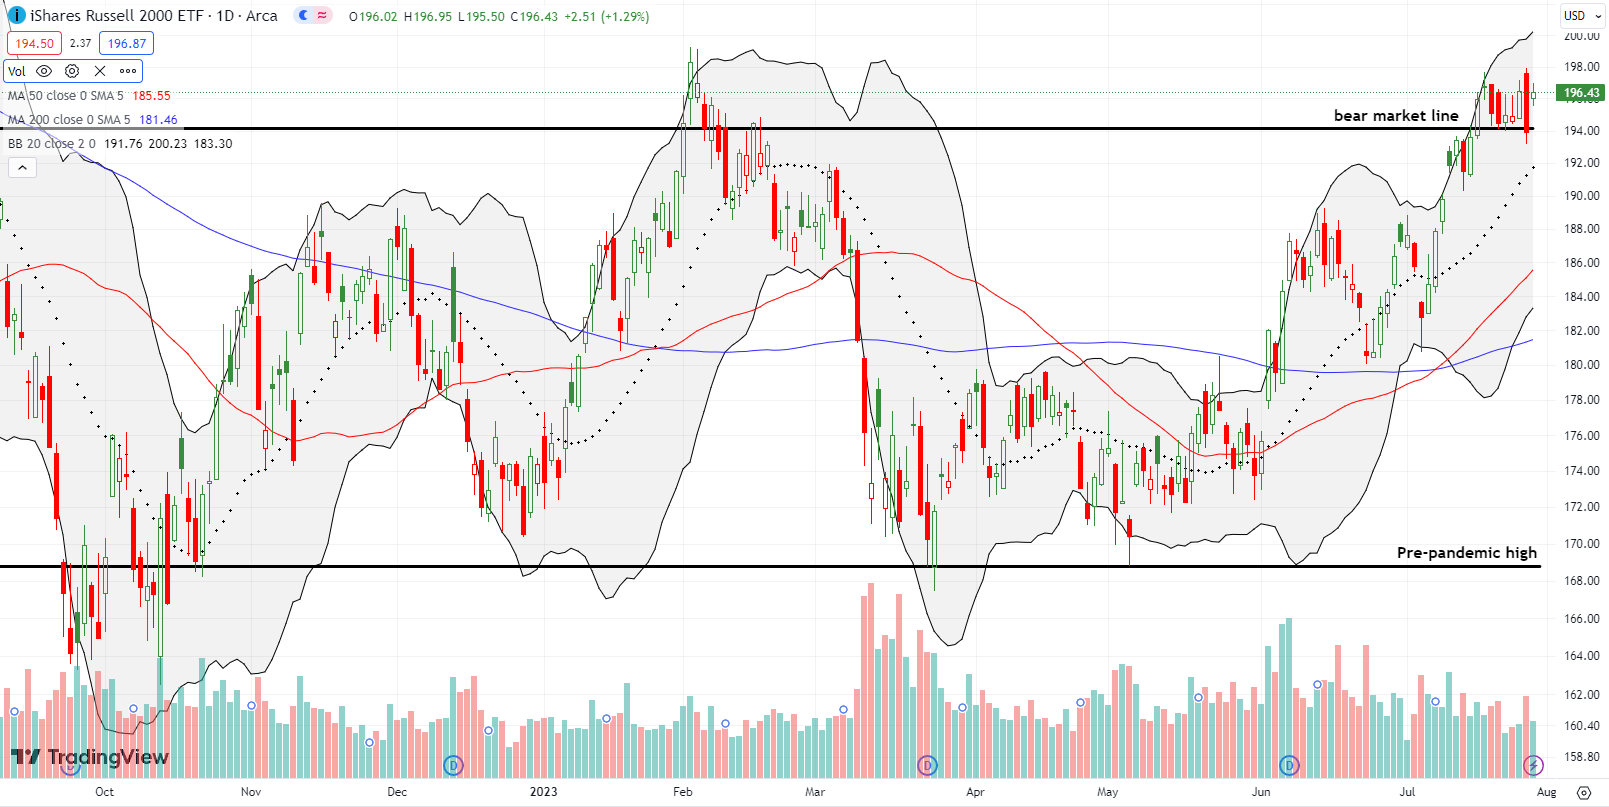
The iShares Russell 2000 ETF (IWM) gapped higher along with the other major indices. The ETF of small caps is playing for even higher stakes. IWM is struggling to separate itself from a bear market. The 1.3% gain on the day saved IWM from confirming a bear market restart, but IWM now remains stuck churning below key resistance from the February high.
The Short-Term Trading Call with A Push Against Topping
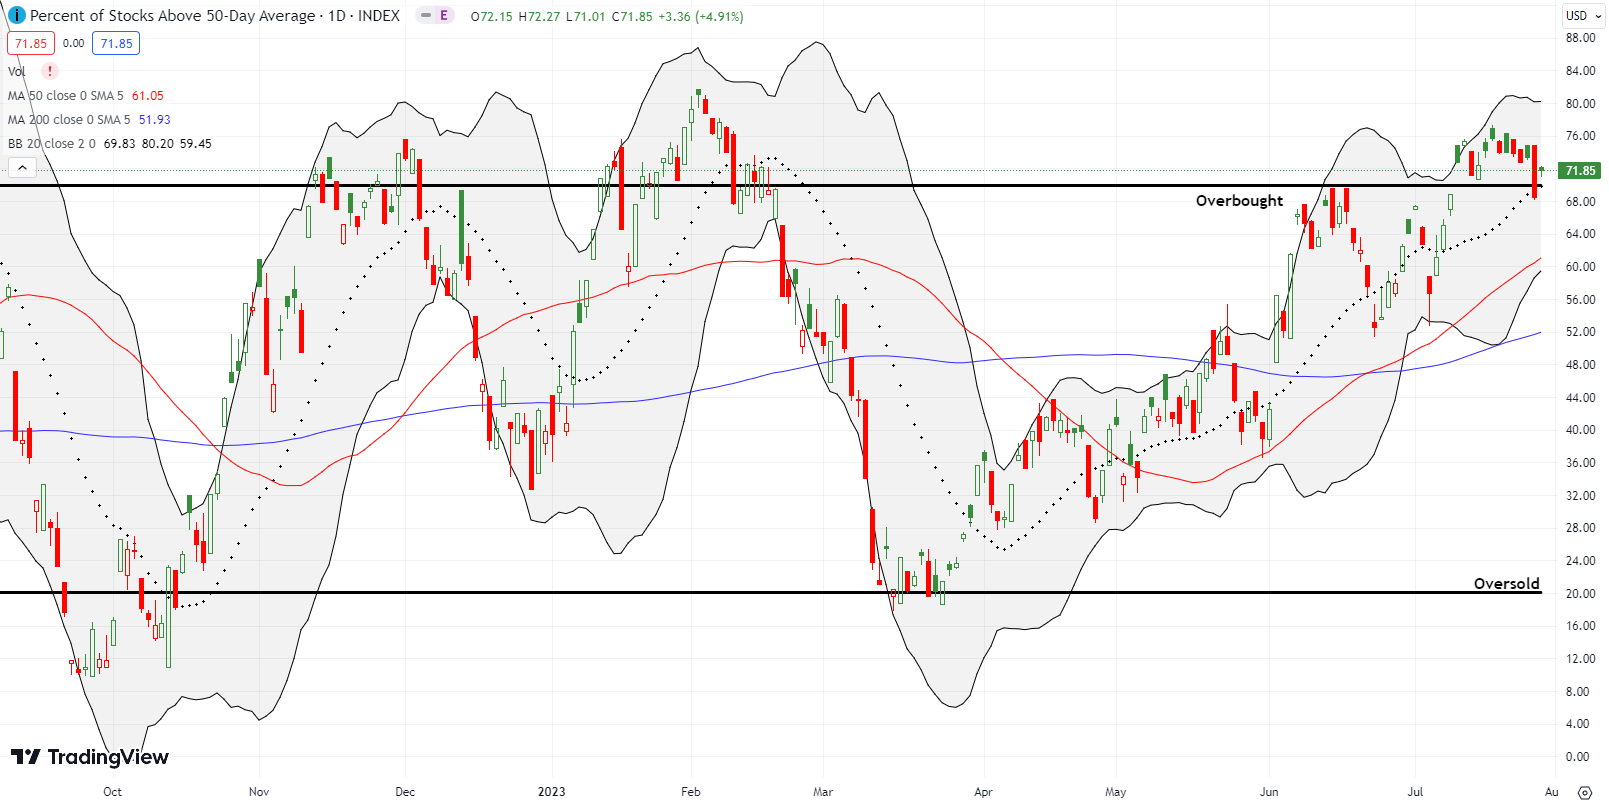
- AT50 (MMFI) = 71.9% of stocks are trading above their respective 50-day moving averages (day #3 overbought)
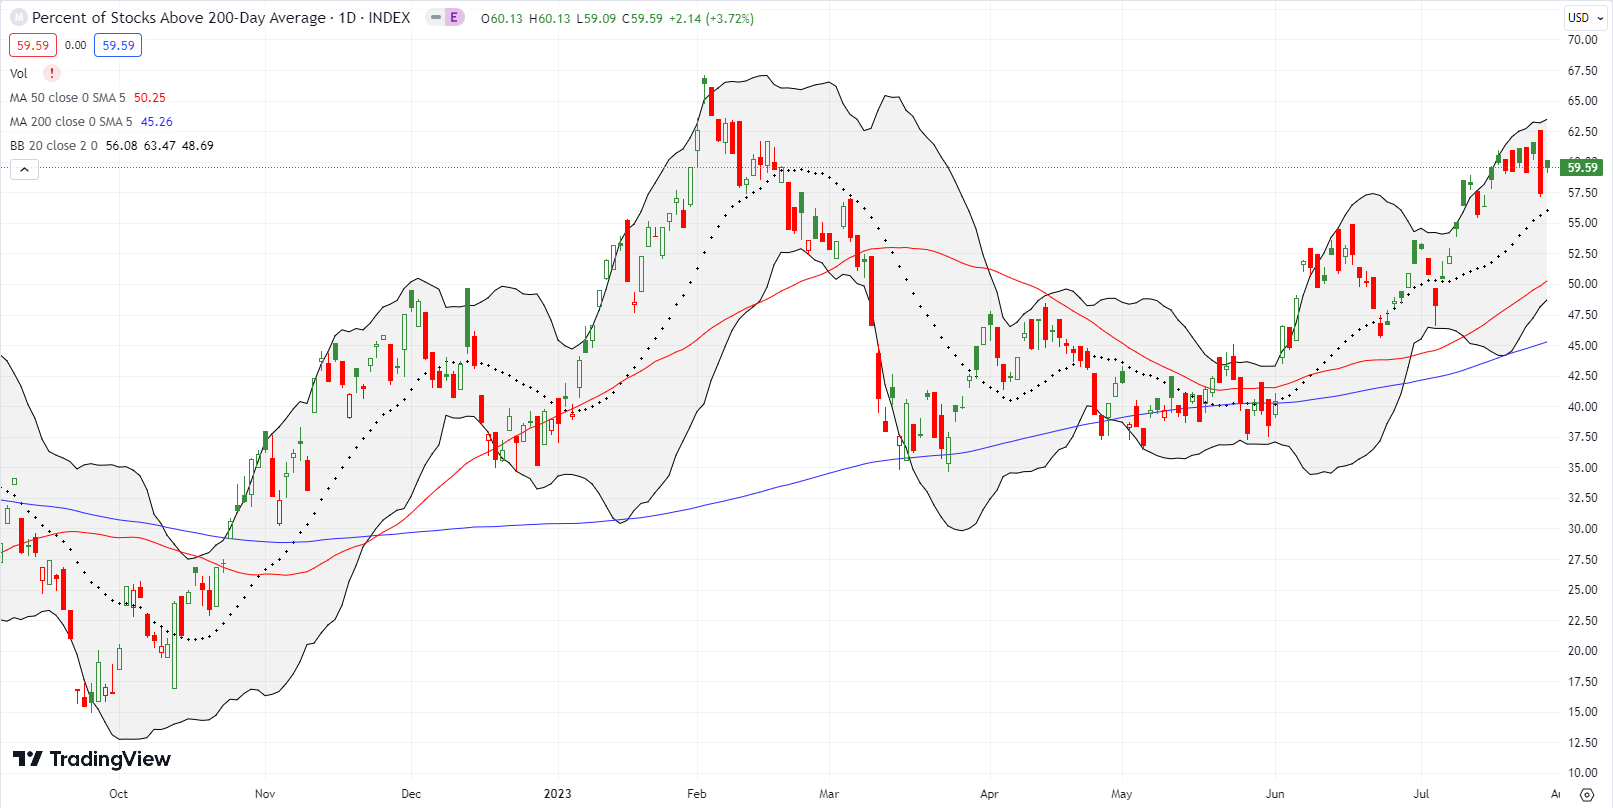
- AT200 (MMTH) = 59.6% of stocks are trading above their respective 200-day moving averages
- Short-term Trading Call: neutral
AT50 (MMFI), the percentage of stocks trading above their respective 50DMAs, reentered overbought trading conditions with a close at 71.9%. However, a subtle downtrend remains in place for my favorite technical indicator from the peak of the last overbought period. Accordingly, I am not nearly as optimistic I was at the start of the last overbought period. I left the short-term trading call at neutral and do not anticipate becoming bullish again until the next sell-off to 50DMA support (the red line in the S&P 500) and/or the next oversold period.
The main question is whether along the way I will ever dare to become bearish. I doubt it. The uptrends are simply too strong to want to bet against the market as a bear.
These strong uptrends have important implications based on history. Yahoo Finance published a timely piece titled “What historically happens after stocks soar through July.” Here are the key performance points:
“Looking at the six prior times the S&P 500 was up five straight months in July, the return for the balance of the year was 8% on average with a 100% win rate.
Broadening out the analysis to include only those years when the January-through-July returns were 10% or more yields a more robust sample size of 21 instances going back to 1960.
These years return on average 4.8% from August to December with 95% of the results positive. (The only negative return was 1987, famous for its Black Monday crash in October.)”
That last caveat is important because August through October are the stock market’s most dangerous months based on historical maximum drawdowns. The averages hide the volatility along the journey to gains. The coming period is typically a bad time to chase uptrends but a great time to trade and buy dips. Since I significantly reduced my risk profile, I feel well-positioned for this period.
This particular earnings season is another reason for reducing risk profiles. Stocks that have significantly run up into this earnings season carry significant risk of disappointment. The large collection of stock charts below provides a sample of both the disappointments and the triumphs that have unfolded so far. There are warnings and promise in these charts.
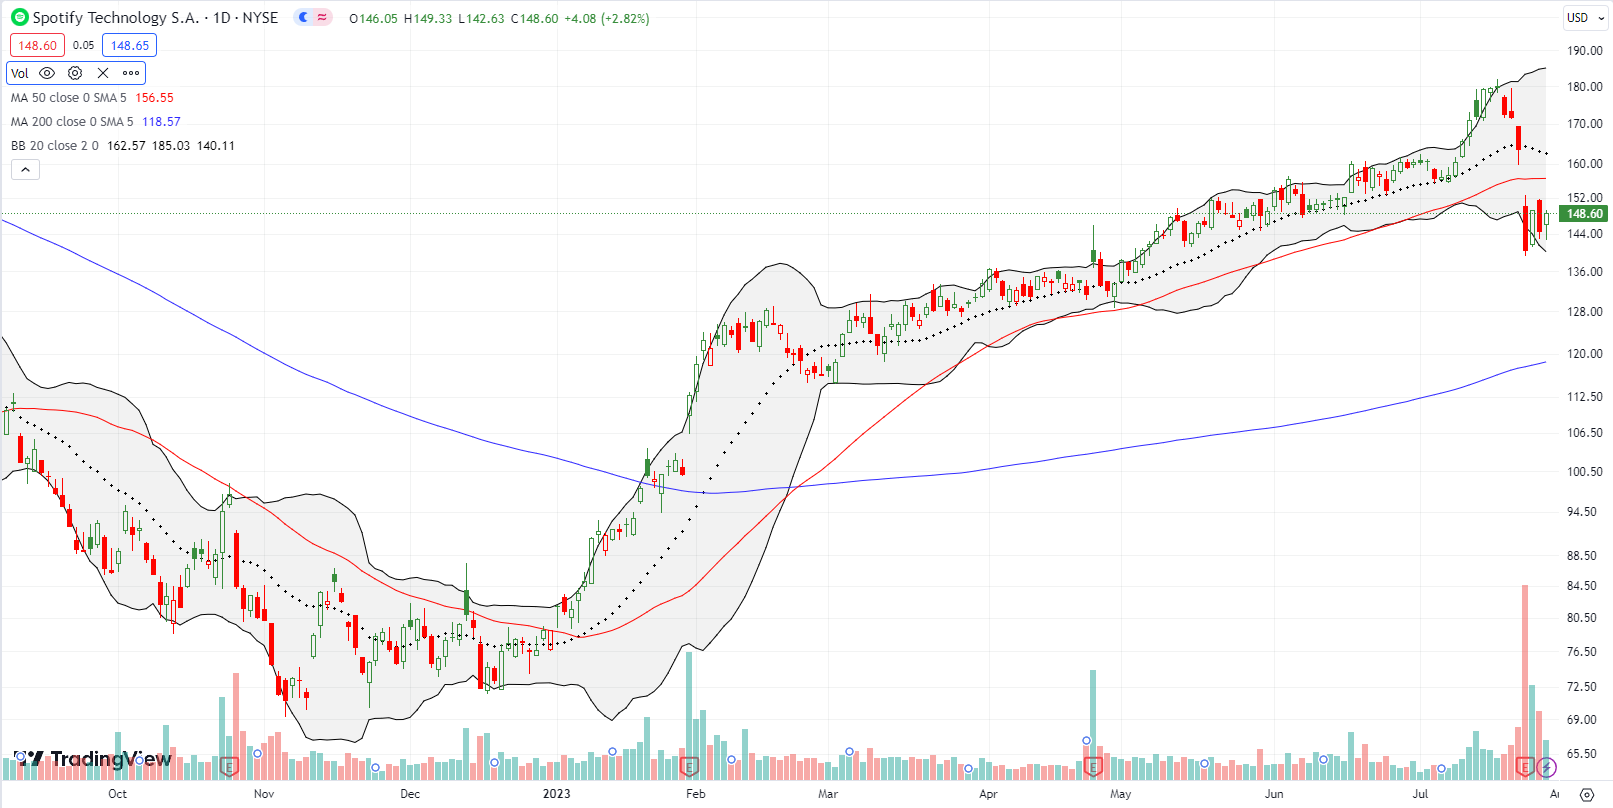
Music and podcast streaming service Spotify Technology S.A. (SPOT) was up an incredible 127.8% for the year at its pre-earnings peak. While SPOT is still a shadow of itself when it soared close to $400 intraday in 2021, this year’s rally still speaks to a high level of relative optimism.
That optimism was tested as the stock declined sharply into earnings. Those who heeded the warning were likely relieved after watching SPOT plunge 14.3% post-earnings. SPOT apparently disappointed revenue and margin expectations; the downward revision to revenue guidance was minimal though. This 50DMA breakdown mark’s SPOT first close below its 50DMA all year. The move is bearish but sellers have not yet confirmed the breakdown with a lower close. I have no interest in shorting SPOT here, but I am a buyer on a recovery of the 50DMA as support.
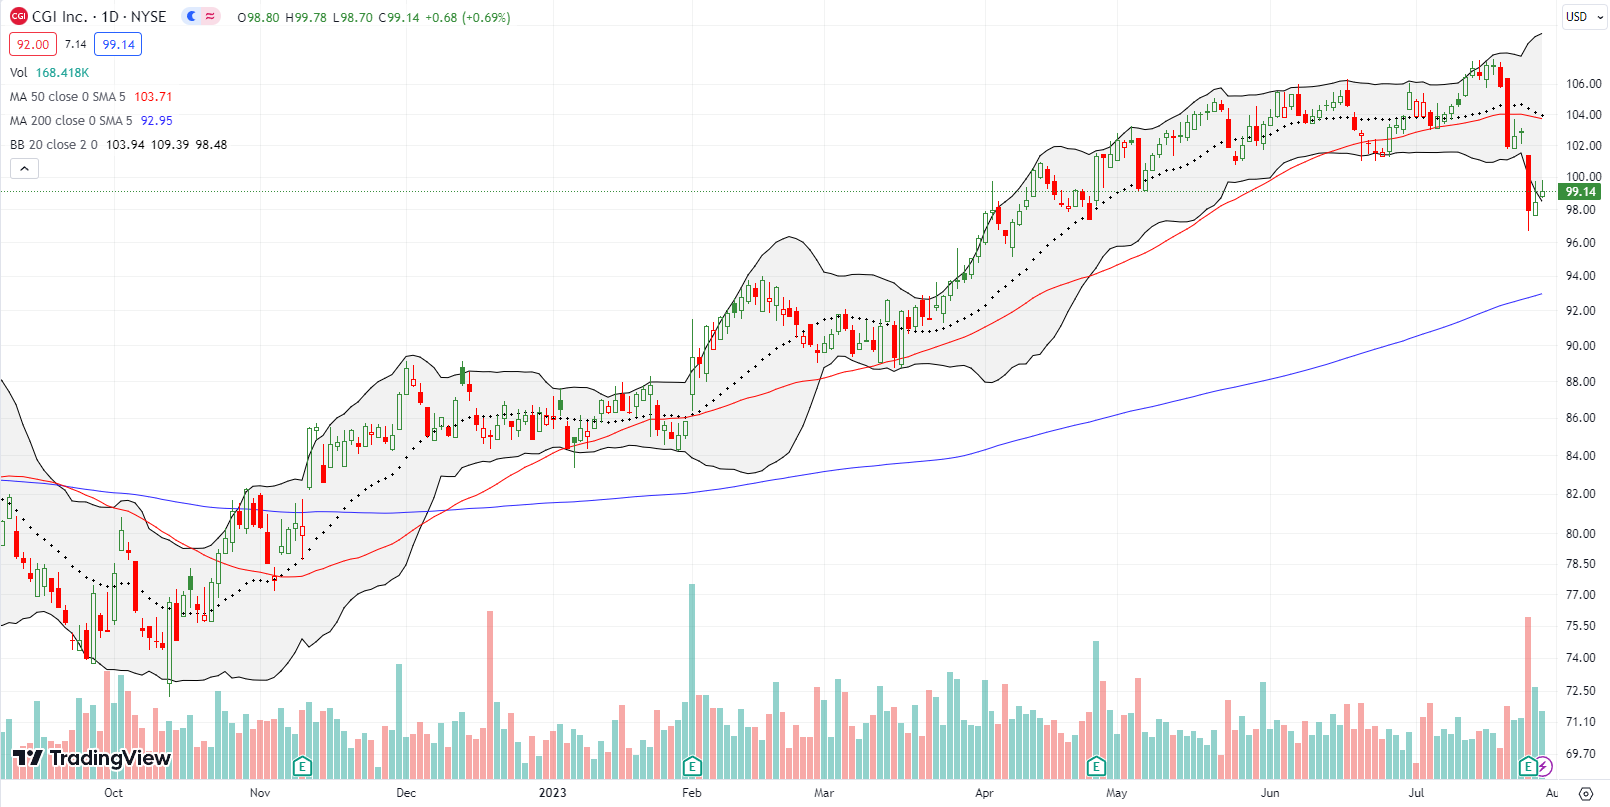
I am on the lookout for indicators of health for IT spending. CDW Corporation (CDW) recovered all its post-earnings losses but faces earnings again next week. Canadian IT services company CGI Inc. (GIB) added to the intrigue after falling 4.8% post-earnings. This loss provided follow-through selling to the 50DMA breakdown that served as a warning in the previous week. Still, sellers have yet to follow through on the post-earnings plunge. Note that ahead of earnings, GIB announced a major investment in AI-related technology and services.
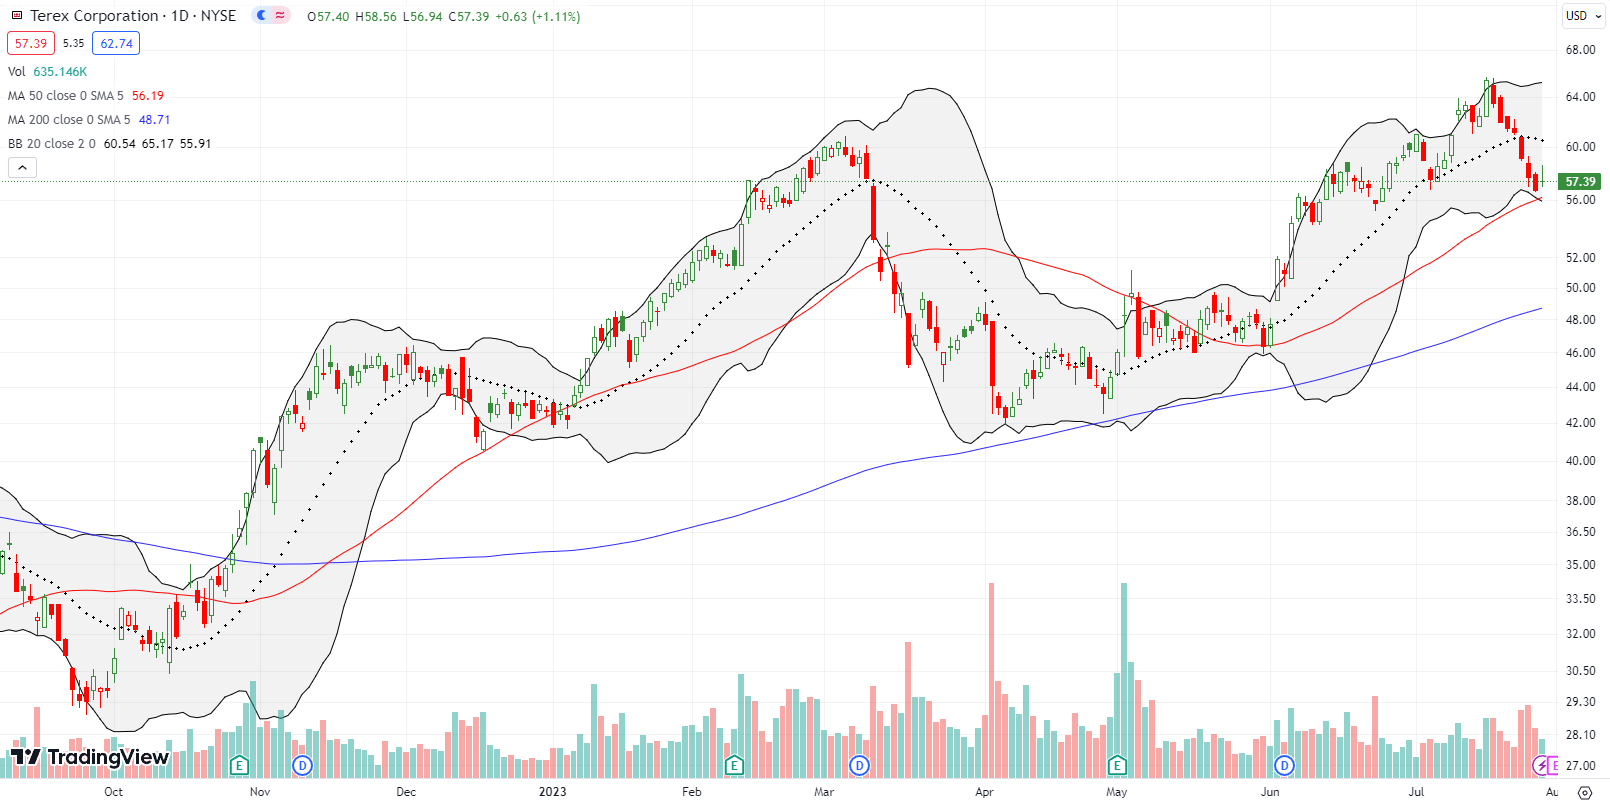
Industrial equipment maker Terex Corporation (TEX) was flying high just two week ago. At the time, TEX traded at a 15-year high and was up 53.0% year-to-date. The subsequent sell-off featured 7 straight days of selling until Friday’s rebound away from 50DMA support. I am watching TEX closely to see whether the pre-earnings sell-off was indeed a warning or whether it turns out to be a buy-the-dip opportunity.
Vacant office buildings have been a hot topic since the onset of the pandemic. Work-from-home has persisted long after the pandemic ended and kept commercial real estate in freefall…until this spring.
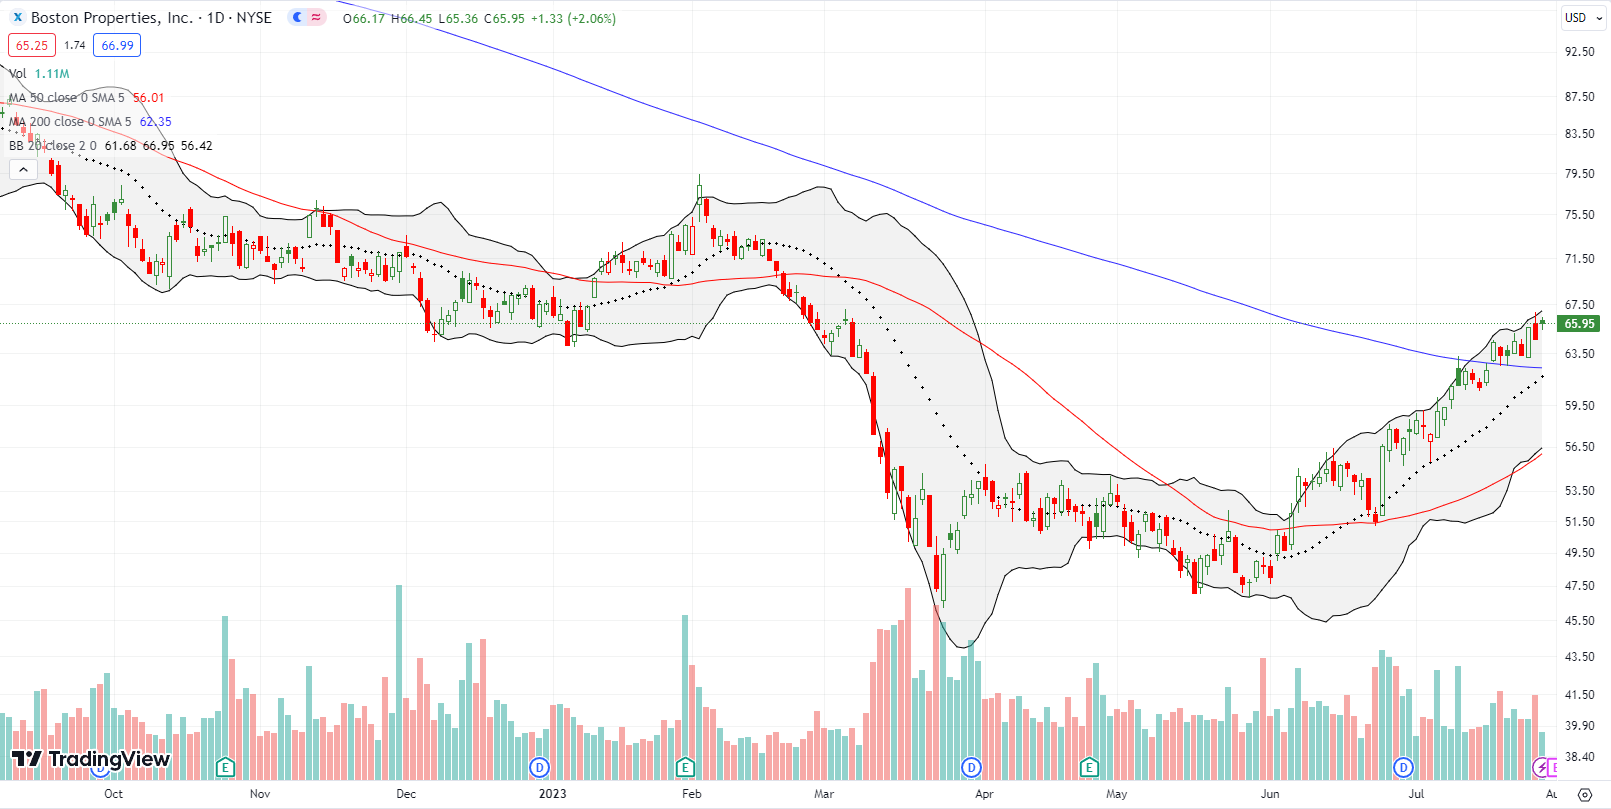
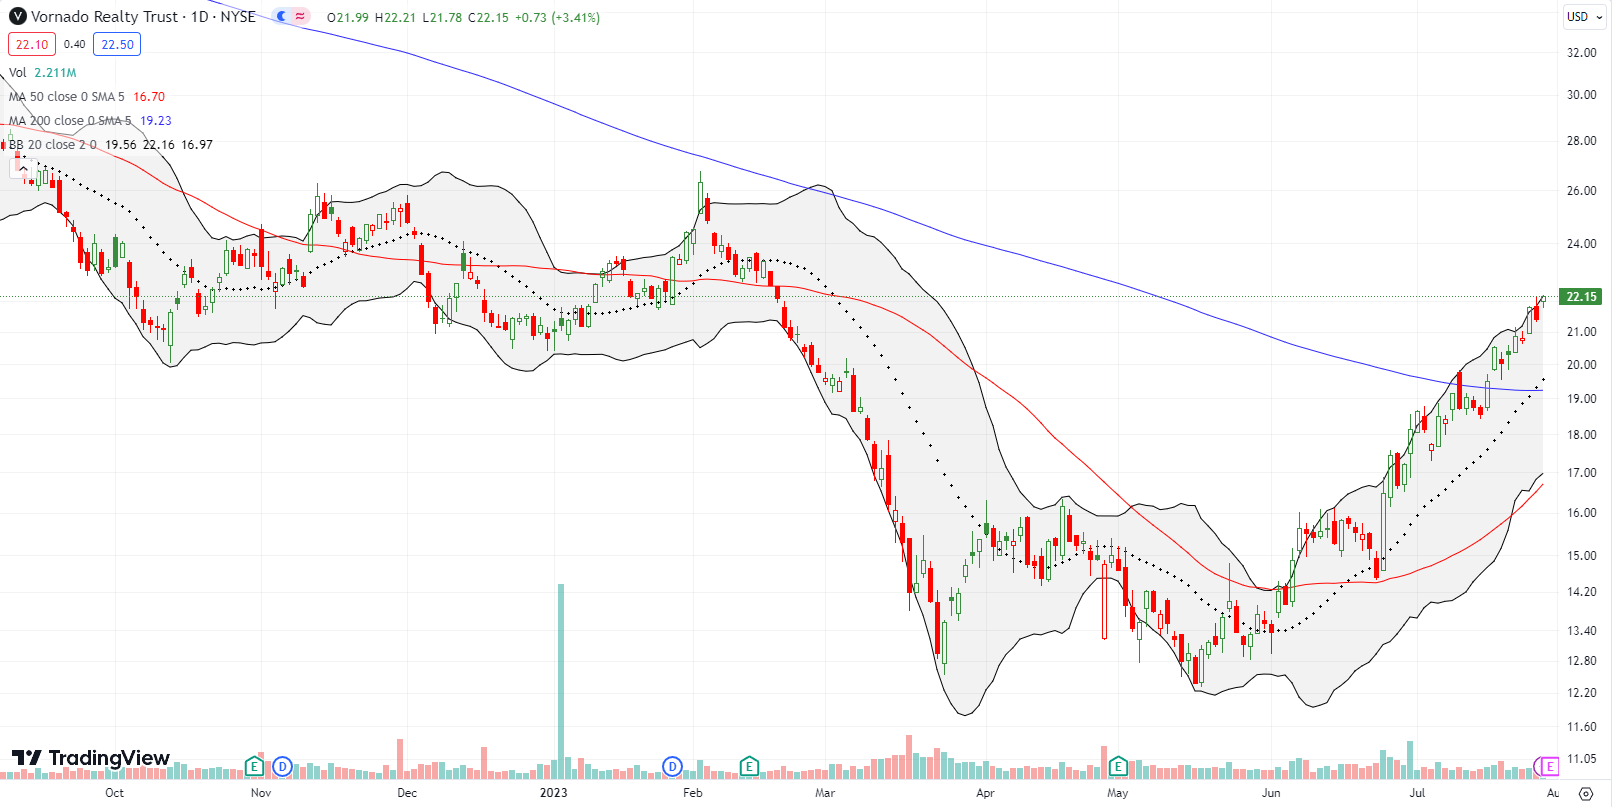
Timed ironically for a bottom I wrote a piece 4 months ago titled “What Happened When I Asked ChatGPT About Commercial Real Estate.” ChatGPT helped me identify commercial real estate plays that would likely struggle in a recession. I picked two for shorting (with put options): Vornado Realty Trust (VNO) and Boston Properties, Inc (BXP). I faded their subsequent rallies. When the positions turned profitable, I sat on them. These positions looked like perfect hedges against a potential economic calamity. Given the bottoming now underway for both VNO and BXP, I am left wondering whether instead of using these kinds of stocks as hedges it makes more sense to bet FOR a better economic future with them!
Both VNO and BXP are in bullish positions with 200DMA breakouts (above the blue lines). VNO is up a tantalizing 78.9% from its bottom in May. BXP bottomed in March and is up 39.2% since then. (Thank goodness for put options instead of shares short). Both stocks are roughly even for the year, so they are still severely under-performing the general stock market.
Bloomberg did an interview with Starwood Capital CEO Barry Sternlicht about commercial real estate. The clip below includes his smug commentary on how a recession would push workers to return to the office. The implication is that the American refusal to return to the office is partly a result of a labor market that is “too good.” This narrative is yet one more reason why Wall Street still wants a recession.
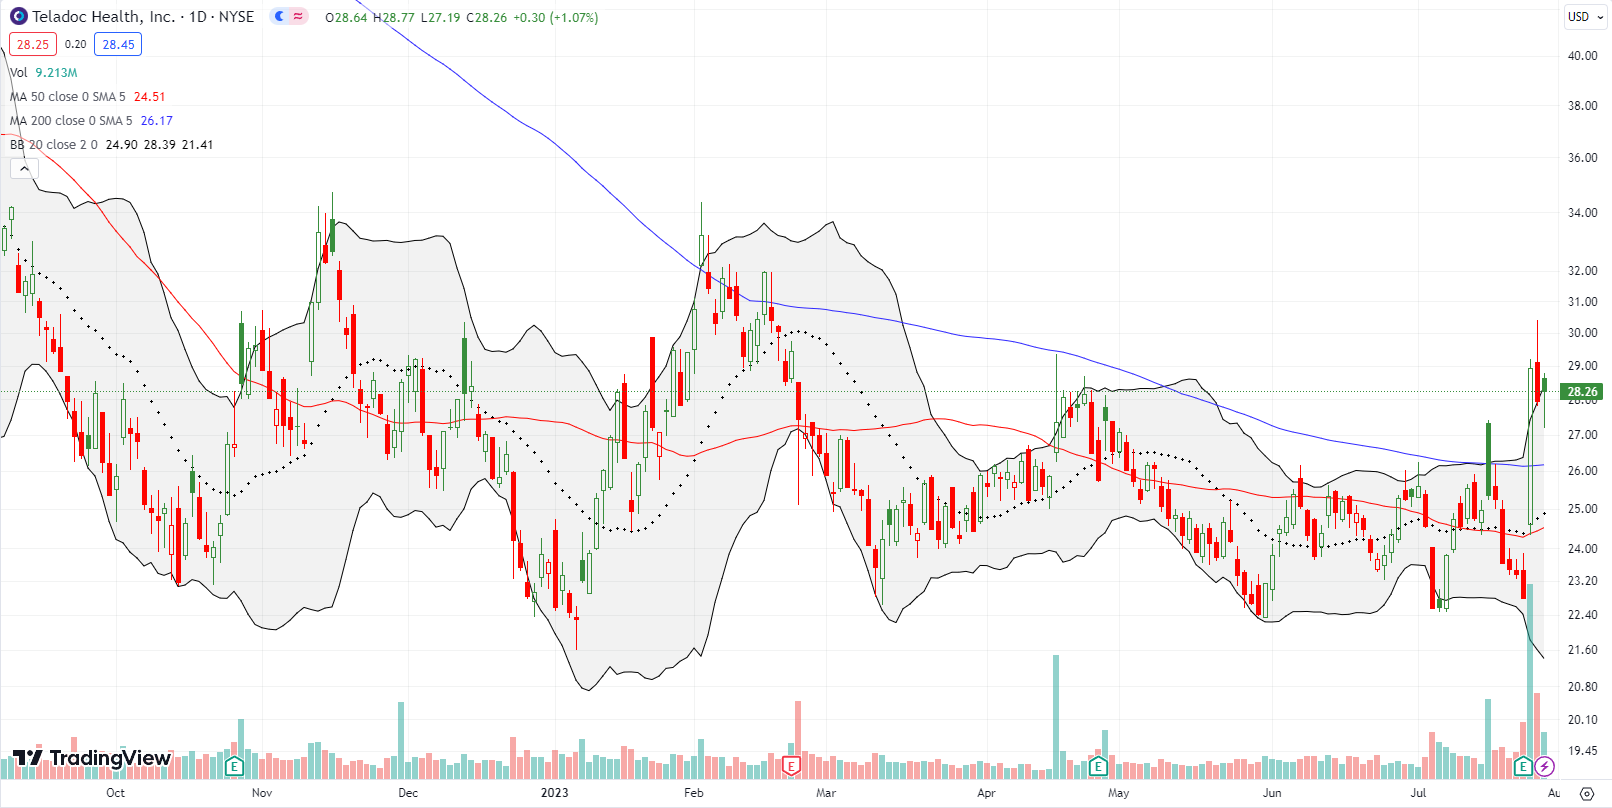
A little over a year ago, the bear market was starting its bottoming process with green shoots. I looked across the fields and could not help seeing beaten up telehealth provider Teledoc Health, Inc (TDOC) as an enticing bottom-fishing play. The stock continued downward and gave me additional opportunities to buy cheaper stock. TDOC finally bottomed at the beginning of this year, but it has been stuck in an overall year-long trading range and consolidation period.
Last week’s 27.0% post-earnings surge provided fresh hope that TDOC can eventually gather enough interest and momentum to break out. Last week’s 200DMA breakout still awaits confirmation. The confirmation will be important because TDOC has only closed above its 200DMA three times in the last 29 months; the previous two closes did not generate confirmations. For context, recall that TDOC is a sad shell of its former $300+ self.
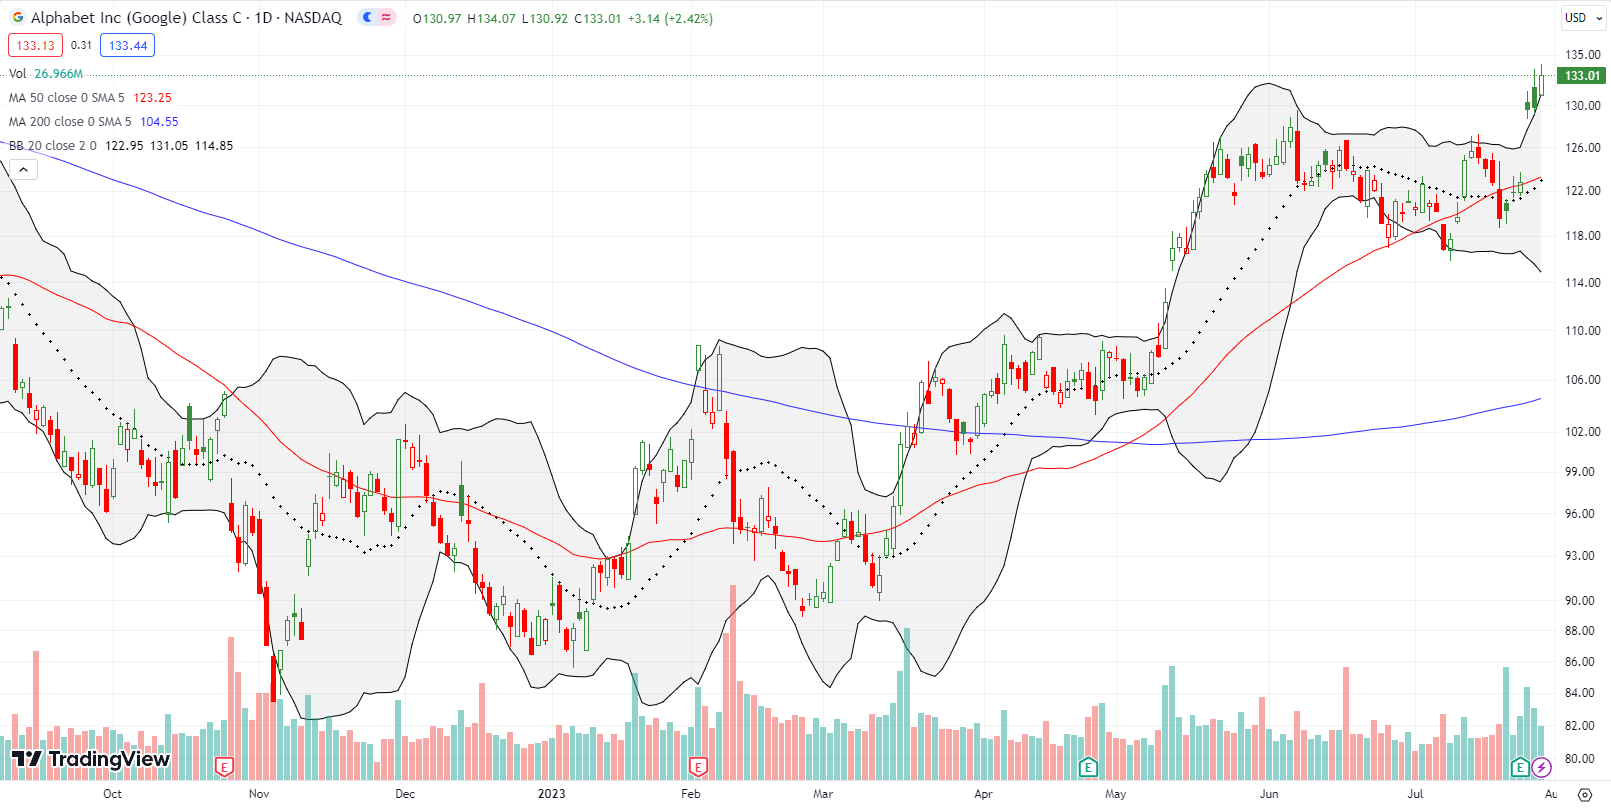
I continue to follow the race for generative AI in the stock market. I have focused on Alphabet (GOOG) as a “cheaper” play still weighed down by early PR missteps. As my strategy includes aggressive dip buying, I took a shot at playing for a positive post-earnings response. GOOG delivered with a 5.6% gain. I took profits in my call spread given it reached near maximum profits; I had little to gain and everything to risk by waiting around until this week’s coming expiration.
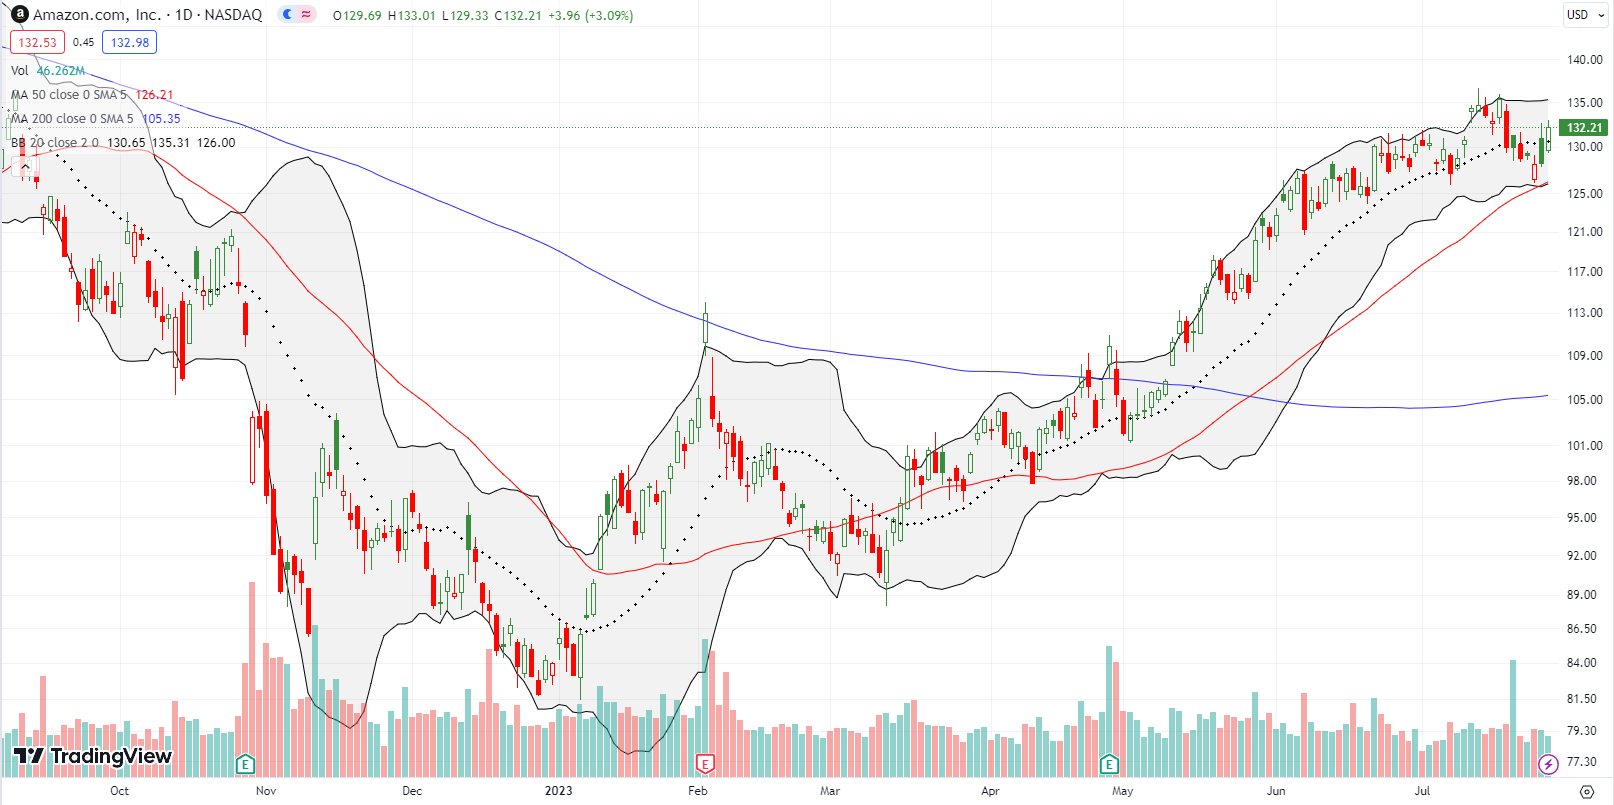
My Prime Day trade in Amazon.com (AMZN) worked out. However, AMZN did not rally into the marquee shopping event as I expected. The stock even punctured through 20DMA support along the way. I profited after the market actually bought the news of Prime Day’s performance. AMZN popped 2.7% on the day to a new multi-month high. After a marginal new high 4 trading days later, fresh selling pressure took AMZN under its uptrend.
The stock is flattening out going into next week’s earnings. Given the successful test of 50DMA support, I am expecting AMZN to make it through earnings OK…but I am not betting on this one. I am VERY tempted as the folks at CNBC’s Options Action are onto the same scent I sense.
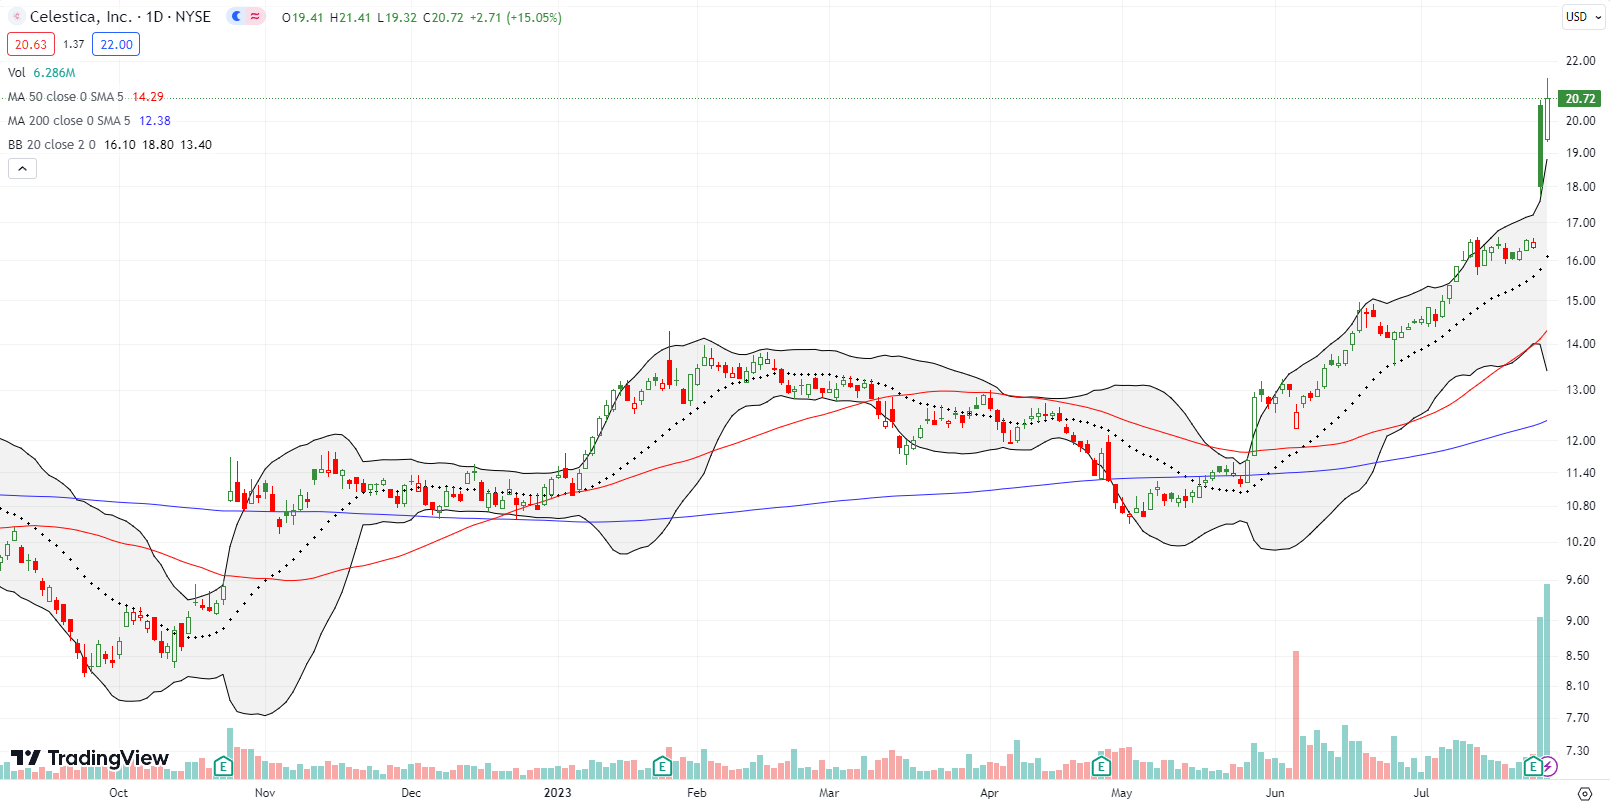
Contract manufacturer Celestica, Inc (CLS) is an oldie but goodie that I found doing my stock chart scans in SwingTradeBot. I decided to stick by the stock going into earnings given momentum and the 20DMA uptrend remained intact. CLS opened post-earnings with a 26% gain, but the day’s selling pressure weighed the stock down to a 9.4% gain. The fade made sense since the stock was so far extended above its upper Bollinger Band (BB). Once the stock gapped higher the next day, I decided to take profits as part of my de-risking. The wild trading action is what can come with a high-flyer that has become extremely stretched to the upside. CLS stays on my radar for buying dips.
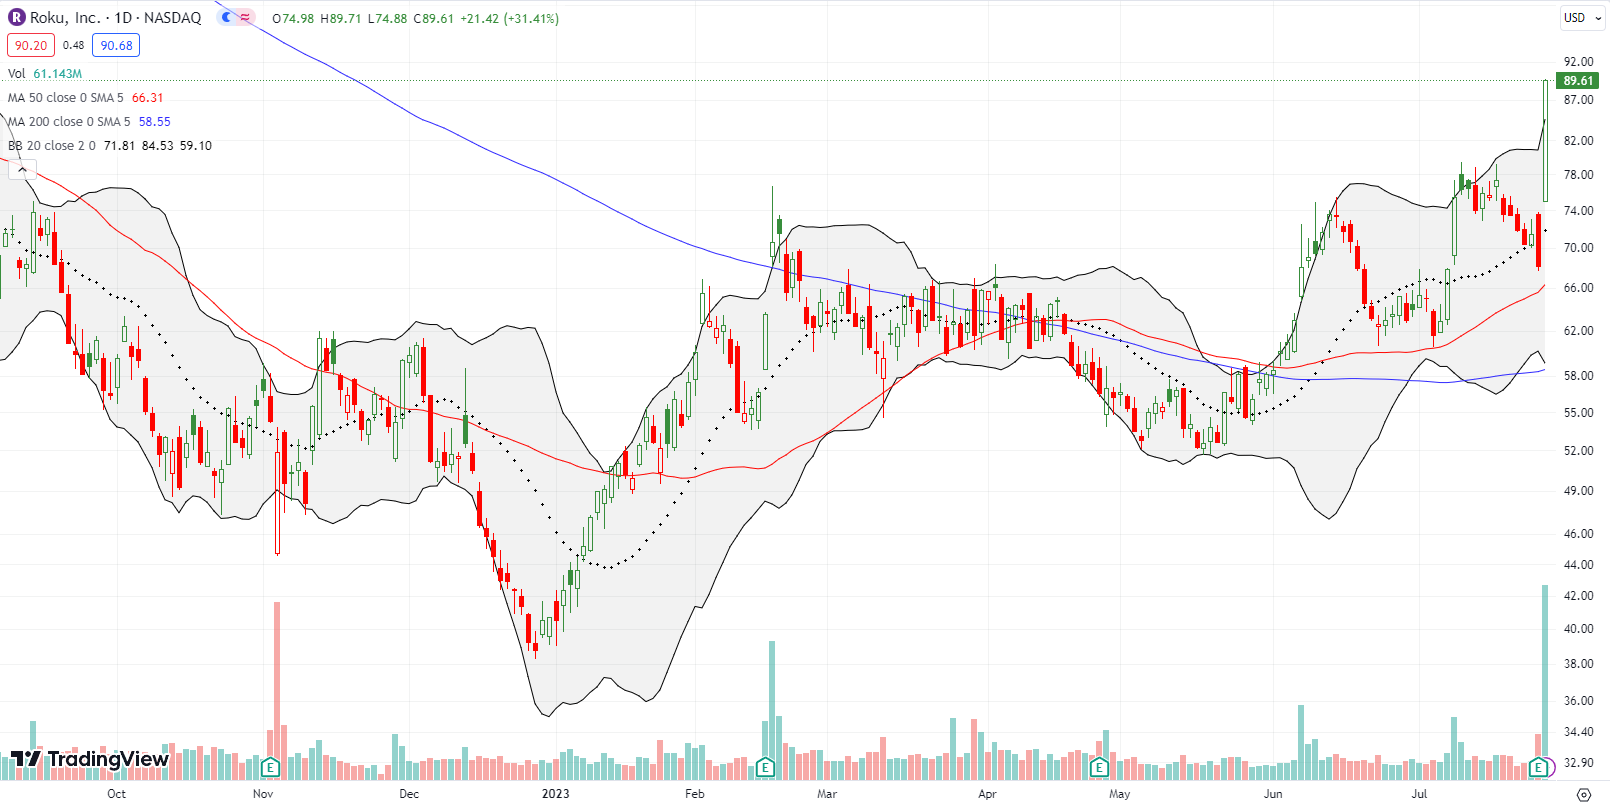
I recently examined the performance of ARK Innovation ETF (ARKK) versus the Renaissance IPO ETF (IPO). In writing that piece, I realized I needed a refresh on my ARK trading strategy. So I bought a covered call position. Roku Inc (ROKU) features prominently as a top holding in ARKK, and ROKU’s good fortune took me out of my position with a profit.
The streaming device and service provider was a drag on performance going into earnings including a 4.6% loss ahead of earnings. The tide turned quickly on sellers as ROKU soared 31.4% post-earnings. The move helped punch ARKK 5.5% higher and above the $48 strike of my short call. Note well that, like ARKK itself, ROKU is another former high-flyer that is a shell of its former self. ROKU twice traded close to $500 in 2021.
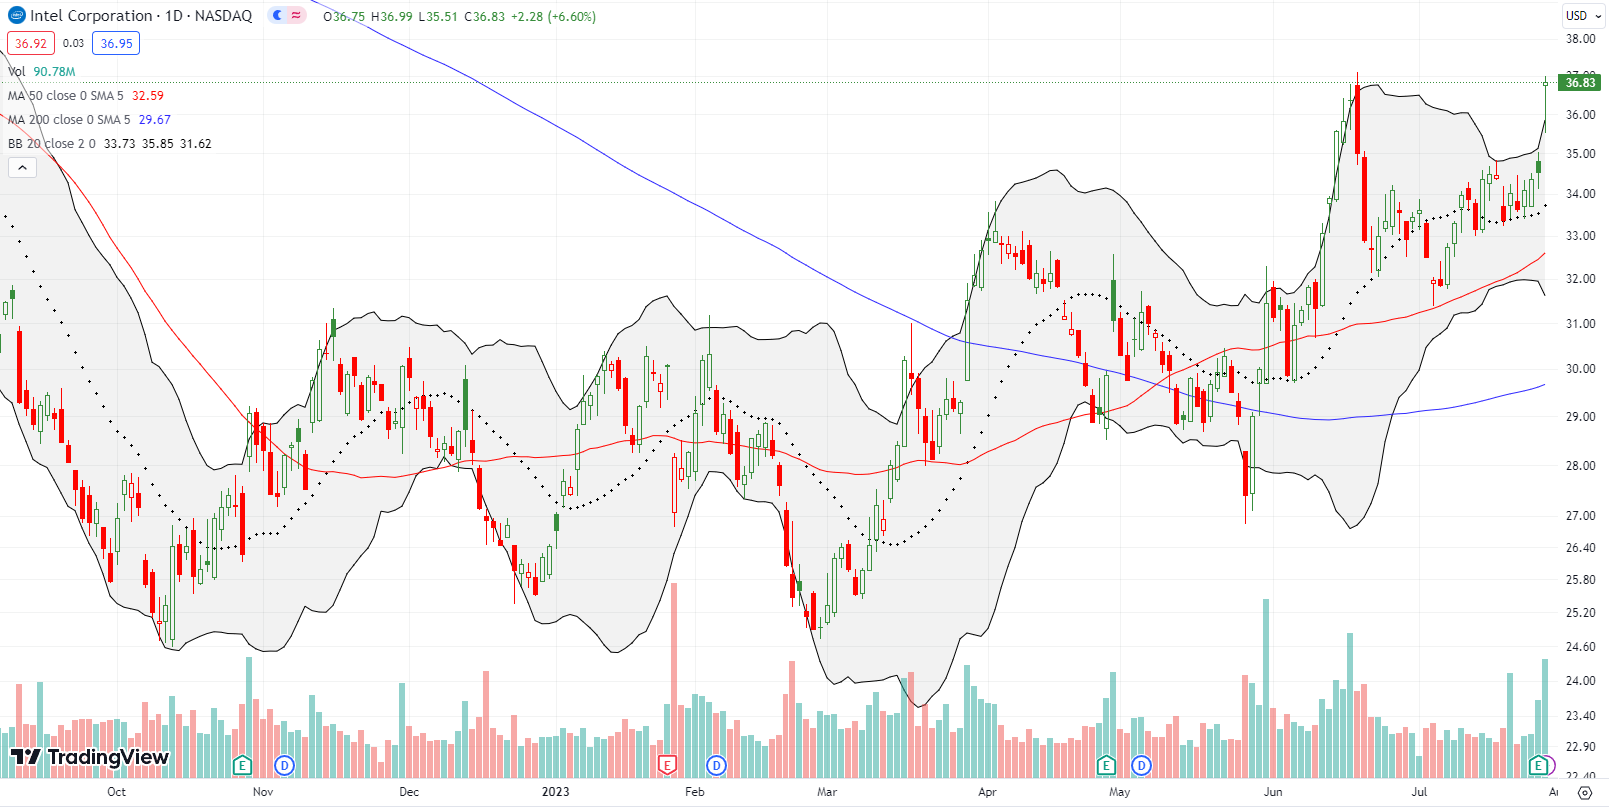
Readers know I prefer to trade Intel Corporation (INTC) between earnings. However, in retrospect, last week’s earnings was a trade I should have tried. INTC belongs to a small group of important tech stocks that are weighed down by heaps of skepticism and prior poor results. So the potential for upside surprise always exists in this new bull market. INTC survived a 50DMA test ahead of earnings and held 20DMA support. So I am not surprised by Friday’s 6.6% post-earnings surge. The stock is of course now over-extended well above its upper Bollinger Band (BB). It is buy the dip time again on INTC.
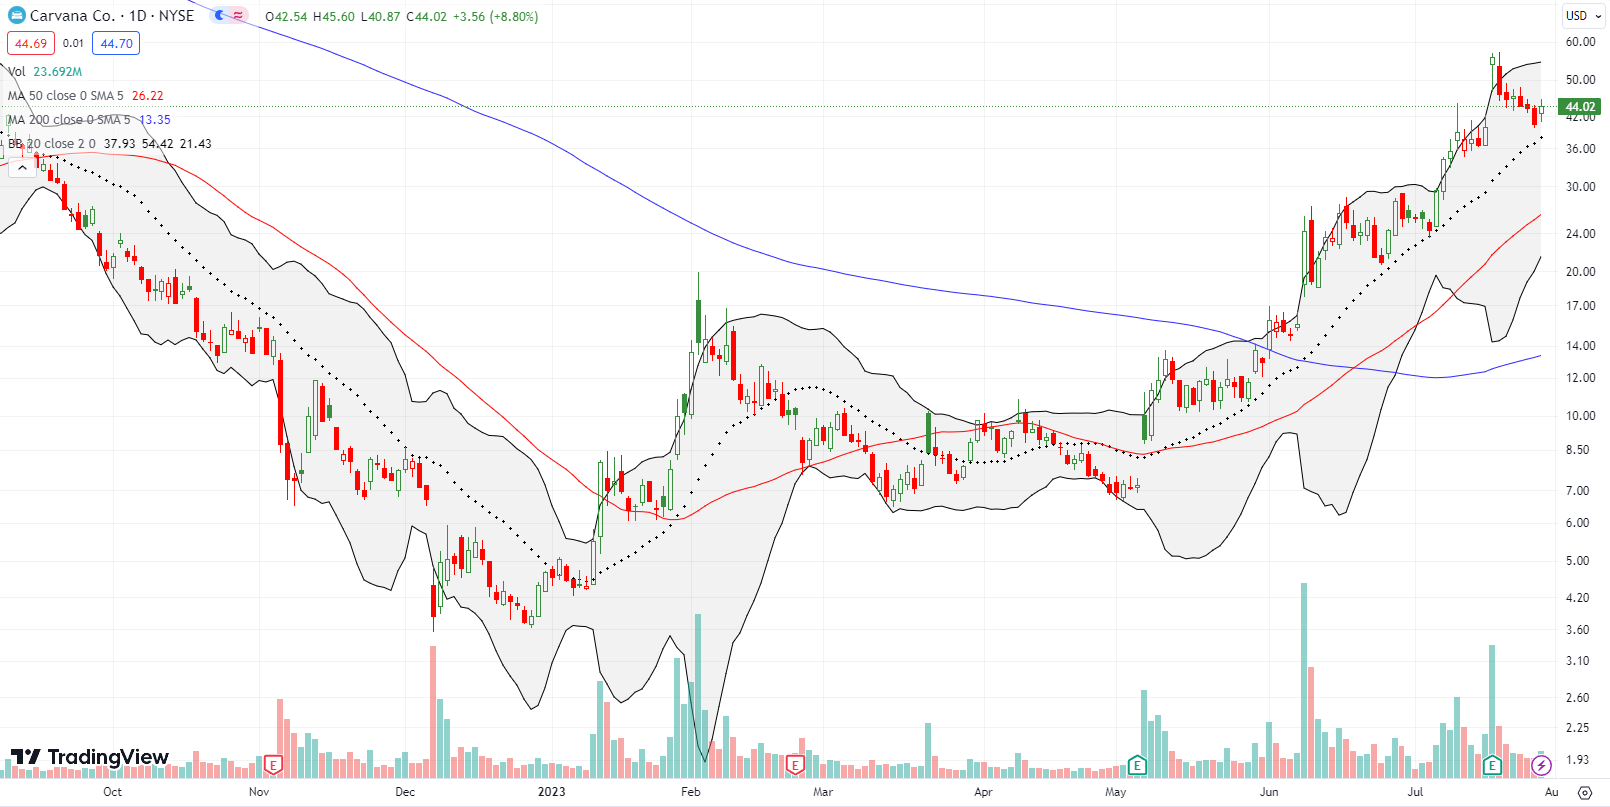
I lamented missing out on the breakout in Carvana (CVNA) in early June when all the technical signals were lined up for a bullish run. I next never imagined that CVNA could double again from there. The move climaxed with a 40.2% post-earnings push that looked like an all-out buyer’s panic. That panic clearly sucked in all the remaining motivated buyers. From there, CVNA drifted lower and perfectly filled the gap. Friday’s gap higher away from uptrending 20DMA support looks like the start of a new push higher. CVNA is a buy on a higher close.
In the meantime, I took profits on the Cargurus Inc (CARG) position that I opened as a “consolation” sympathy trade with CVNA. The stock followed its 20DMA uptrend in a very choppy fashion. So its break below support ahead of earnings told me to take profits as part of my many de-risking moves.
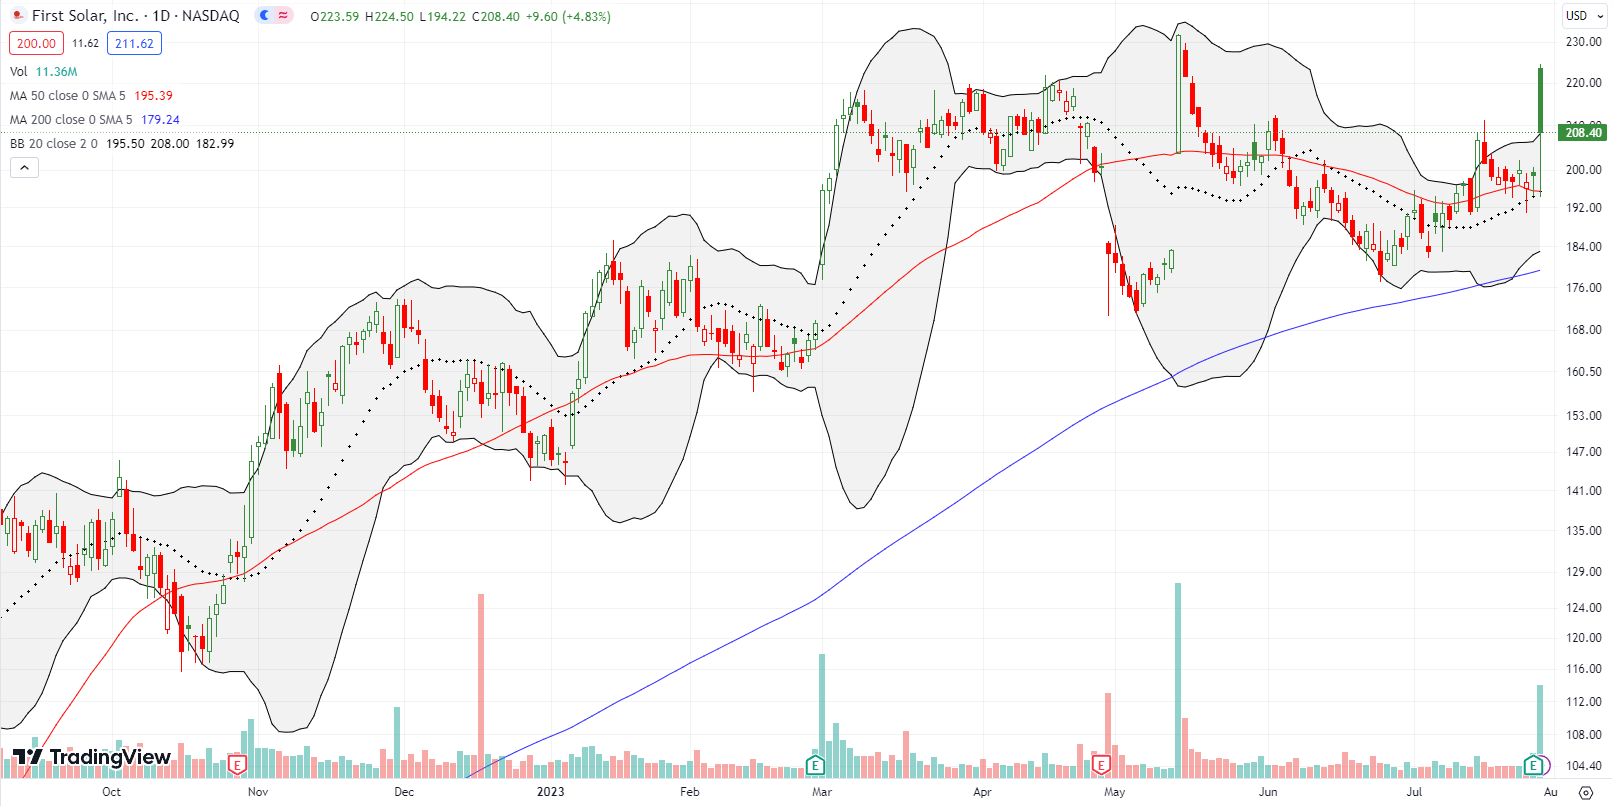
In mid-May, I lamented missing the entire rally in First Solar (FSLR). So when the stock pulled back to its 50DMA from the excitement of an acquisition, I jumped into some shares. I did not even consider the prospect for a complete reversal of that over-reaction. The complete reversal and then some happened in late June. FSLR avoided a test of 200DMA support before a slow rebound unfolded. That rebound included an 8% up day that in turn get reversed on an intraday basis. So I was relieved to see buyers fight back after a 12.5% post-earnings open got faded all the way into negative territory. All this chop tells me eager sellers continue to hold FSLR shares; I will need to patiently wait out their exhaustion.
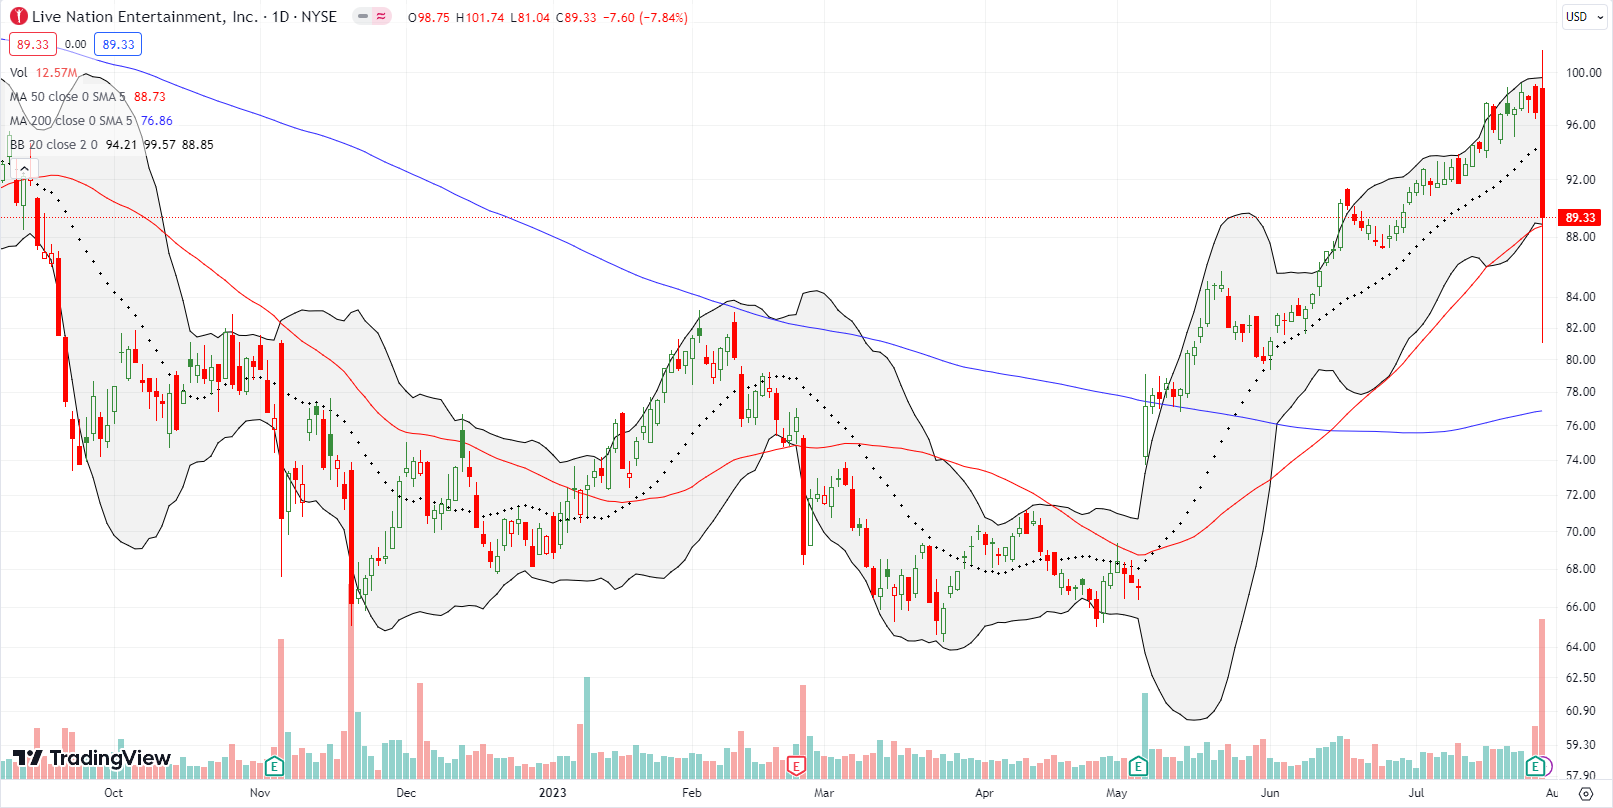
Live Nation Entertainment Inc (LYV) is a stark example of the vulnerability of stocks that have rallied long and strong. LYV has been in a bullish position ever since a 15% post-earnings breakout in May led to a confirmed 200DMA breakout. On Friday, the stock looked set to continue its rally after a small post-earnings gain. LYV even snuck by the $100 level. A report from Politico about potential Department of Justice action against Ticketmaster sent LYV plunging immediately and with reckless abandon.
LYV lost about 16% in less than 45 minutes. Buyers took over as LYV approached the last test of 20DMA support. LYV was also over-extended well below the lower BB. Buyers managed to close out LYV just above 50DMA support. Going into the close I moved to buy a hedged position of calendar call and put spreads but only the bearish side closed. So I suspect LYV will continue a bounce on Monday. However, LYV looks like a damaged stock. LYV will likely need clarity on the anti-trust rumors before resuming its push higher. Confirmation of the rumor may send LYV back toward Friday’s lows.
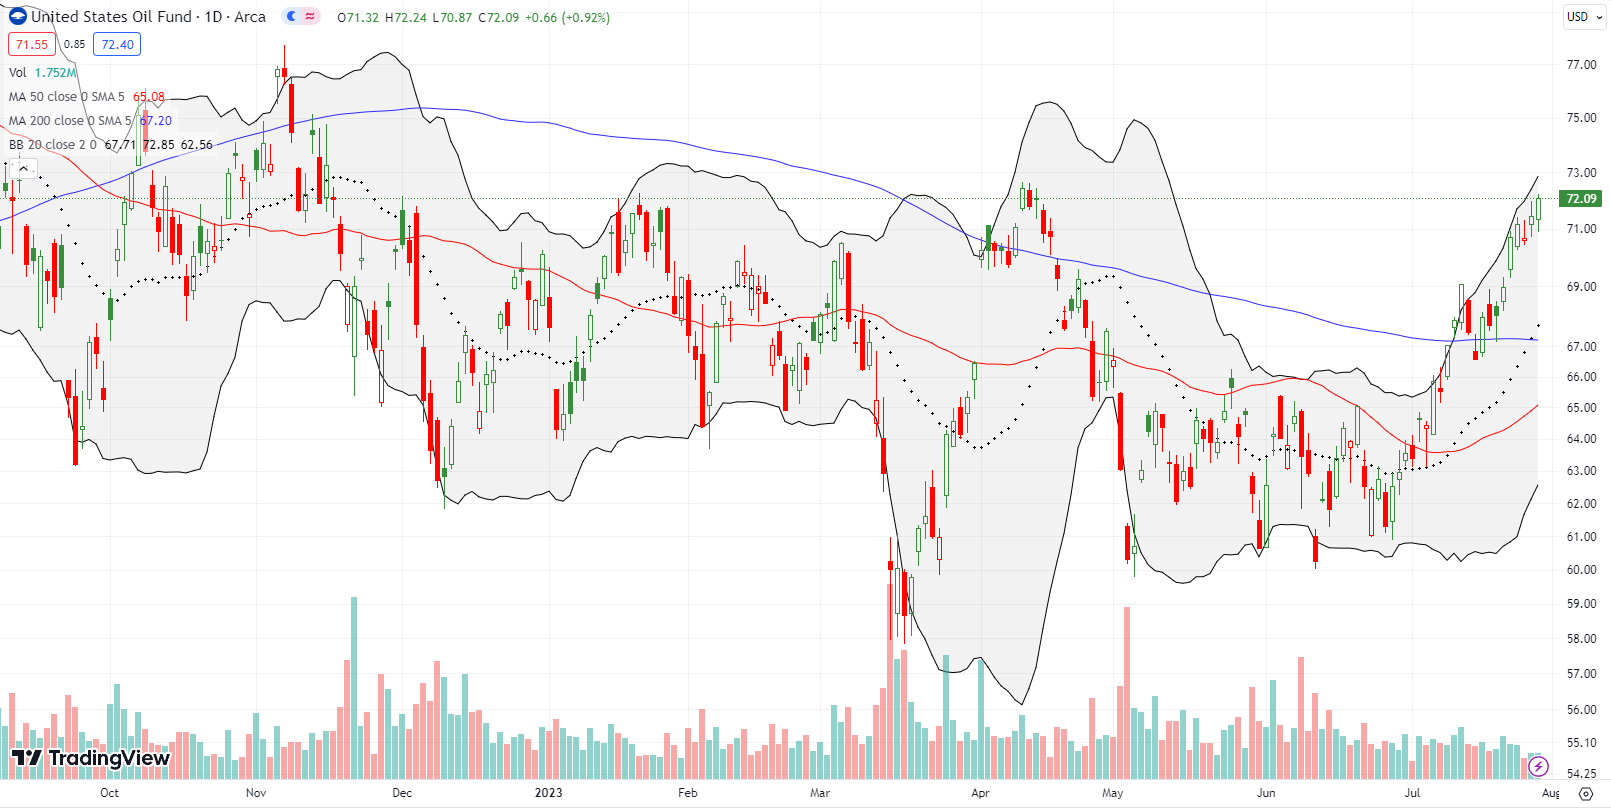
Very quietly, oil has rallied back into a bullish position. The accompanying rise in gas prices threatens the rosy inflation outlook and resilient consumer spending numbers. On Friday, the United States Oil ETF (USO) tested its highs for the year. A breakout from there will imply that gas prices will go yet higher with the breathless news headlines to follow. The resulting hit to consumer sentiment and wallets could tweak the tenor of the stock market.
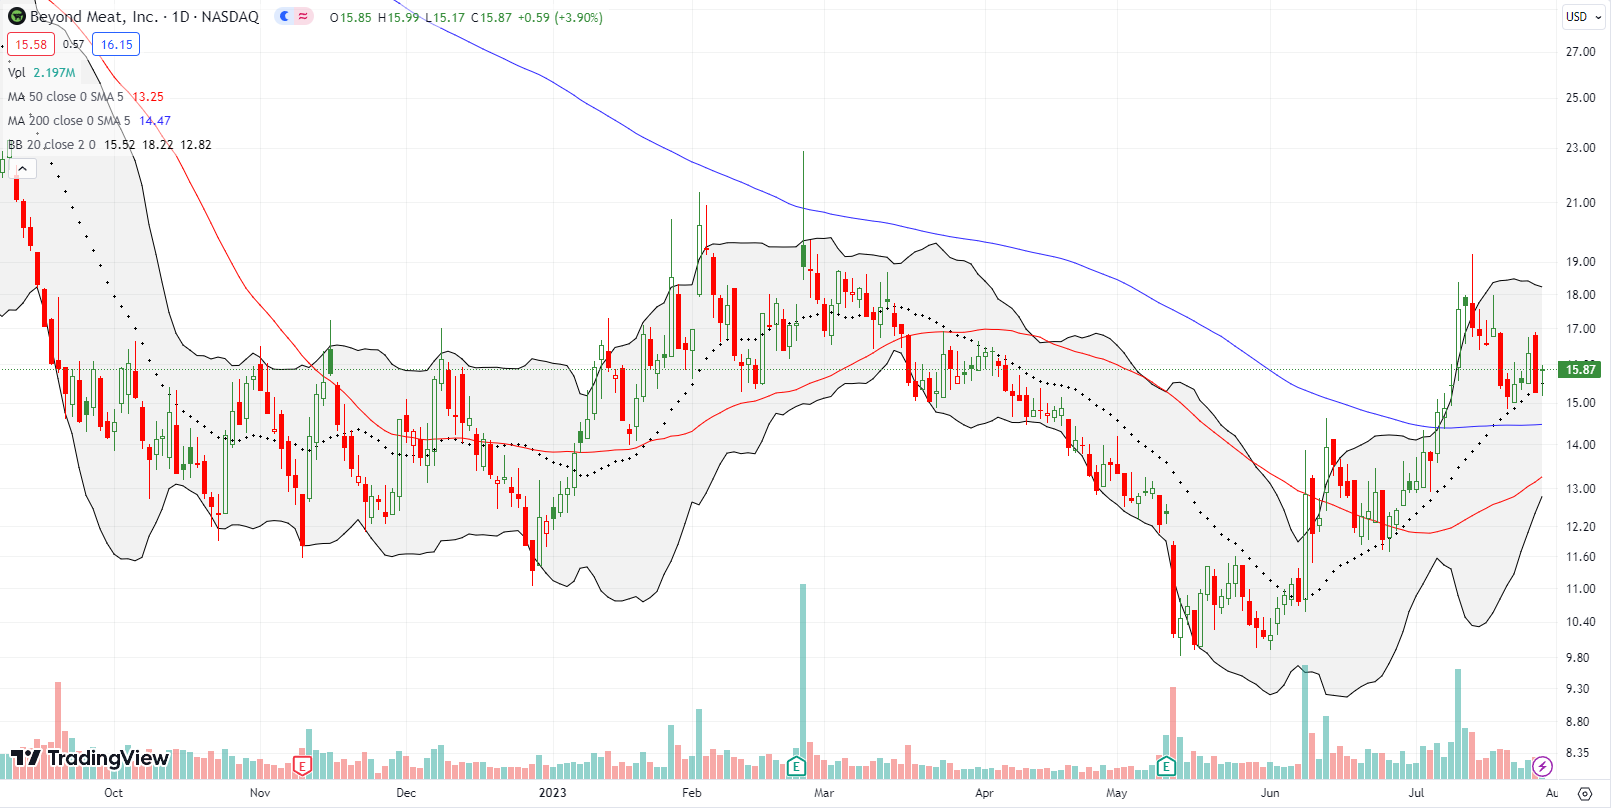
I have been bearish on the fundamentals for Beyond Meat Inc (BYND) for a long time. Now, finally, the technicals are turning in favor of BYND. On Friday, I did a 180 degree turn and bought a call spread as a play on resilient support at the uptrend 20DMA. BYND has (bullishly) held a 200DMA breakout for much of July. Before this month, BYND last traded above its 200DMA two years ago.
Be careful out there!
Footnotes
Subscribe for free to get email notifications of future posts!
“Above the 50” (AT50) uses the percentage of stocks trading above their respective 50-day moving averages (DMAs) to measure breadth in the stock market. Breadth defines the distribution of participation in a rally or sell-off. As a result, AT50 identifies extremes in market sentiment that are likely to reverse. Above the 50 is my alternative name for “MMFI” which is a symbol TradingView.com and other chart vendors use for this breadth indicator. Learn more about AT50 on my Market Breadth Resource Page. AT200, or MMTH, measures the percentage of stocks trading above their respective 200DMAs.
Active AT50 (MMFI) periods: Day #84 over 20%, Day #58 over 30%, Day #55 over 40%, Day #41 over 50%, Day #16 over 60%, Day #1 over 70% (1st overbought day ended 1 day under 70%)
Source for charts unless otherwise noted: TradingView.com
Full disclosure: long BYND call spread, long IWM call spread, long USO call and short shares, long LYV calendar put spread, long FSLR, long TDOC, long VNO put spread, long BXP put spread,
FOLLOW Dr. Duru’s commentary on financial markets via StockTwits, Twitter, and even Instagram!
*Charting notes: Stock prices are not adjusted for dividends. Candlestick charts use hollow bodies: open candles indicate a close higher than the open, filled candles indicate an open higher than the close.


