

Stock Market Commentary
The Federal Reserve’s latest pronouncement on monetary policy was supposed to provide the drama of the week. However, the stock market yawned and resumed the buying of the summer of love at the open of trading the next day. Enter the Bank of Japan (BoJ) to provide the real drama.
The fireworks began with fresh speculation that the BoJ would adjust its yield curve control policy. Japanese bond yields promptly soared and triggered a sympathetic sell-off in U.S. Treasurys. The jumps in yields took the stock market down (bond prices and stocks typically move inversely especially with big moves). The reversals created ominous topping patterns that flipped the tenor of a stock market the slipped out of overbought trading conditions.
The reactions were swift. The Bank of Japan confirmed the rumors by loosening its yield curve control policy to prepare itself to react to inflationary pressures. That wording sounds like a prelude to higher rates and long overdue monetary tightening. Still, the initial reactions looked extreme and are subject to short-term reversals as the market absorbs the news. I am back to watching the currency markets to assess the prospects for the stock market. If the Japanese yen (FXY) continues to strengthen, carry trades will unwind and add to the downward pressure in stocks.
The Stock Market Indices
The S&P 500 (SPY) printed one of the most dreaded of the topping patterns: the bearish engulfing price action. The index gapped up to a breakout and a near 16-month high that exceeded the intraday high of the previous day. The dust settled on a 0.6% loss and a close below the preceding day’s intraday low. The combined price moves created the bearish engulfing pattern. The occurrence at the end of an uptrend adds the topping effect.
Sellers have put the bulls on notice. I am deferring to the ominous signal here and pivoting on my short-term trading strategies.
")
The NASDAQ (COMPQ) almost created its own bearish engulfing pattern. While the tech-laden index came up short, it still closed the day with a topping pattern. The NASDAQ gapped up and then failed just under the resistance of the near 16-month high set a week ago. The subsequent close lower all but confirms resistance along with its bearish implications. Bulls have one more chance to turn the tide by defending uptrending support at the 20-day moving average (DMA) (the dashed line below).
")
A week ago, the iShares Russell 2000 ETF (IWM) put pressure on the bears with a convincing breakout above the bear market line. IWM chopped from there and even tested the bear market line as support. So, the day’s breach of the bear market line looks like an important breakdown. A lower close confirms a bearish end to what was a promising challenge of the year’s high set in February.
")
The Short-Term Trading Call with Topping Patterns
- AT50 (MMFI) = 68.5% of stocks are trading above their respective 50-day moving averages (ended 11 days overbought)
- AT200 (MMTH) = 57.5% of stocks are trading above their respective 200-day moving averages
- Short-term Trading Call: neutral
AT50 (MMFI), the percentage of stocks trading above their respective 50DMAs, sliced its way down to 68.5%. That close below the overbought threshold ended an 11-day overbought period. The S&P 500 gained 1.5% during the overbought period. This performance once again demonstrates why the overbought period is not itself bearish. However, the END of an overbought period is the beginning of potential bearishness. Sellers just need to follow through with a lower close for AT50 .
I previously planned to stay stubbornly bullish until the sellers broke the back of the S&P 500’s 20DMA uptrend. Yet, the topping patterns – formed by the combination of the bearish engulfing patterns on the S&P 500 and IWM and the NASDAQ’s failure at the resistance of a previous high – force me to adopt an abundance of caution. Thus, I pivoted my trading strategy starting with a downgrade of my short-term trading call to neutral. I will pause my aggressive pursuit of bullish chart setups and will lock in (net) profits. In other words, I am shrinking my overall risk profile.
I will not adopt a more favorable outlook until either 1) the S&P 500 invalidates its bearish engulfing topping pattern, or 2) the S&P 500 pulls off a successful test of uptrending 50DMA support (where AT50 will presumably drop into the 30-40% range).
Per my fade strategy on the iShares 20 Plus Year Treasury Bond ETF (TLT), I bought puts on TLT as it rallied into and around 50DMA resistance. The 2.0% plunge validated the strategy for a second time even though I did not anticipate the Bank of Japan as a driver of higher yields and lower TLT. With TLT trading at the lows of the year, I will take profits on the position if TLT fails to follow through on the selling with a breakdown.
")
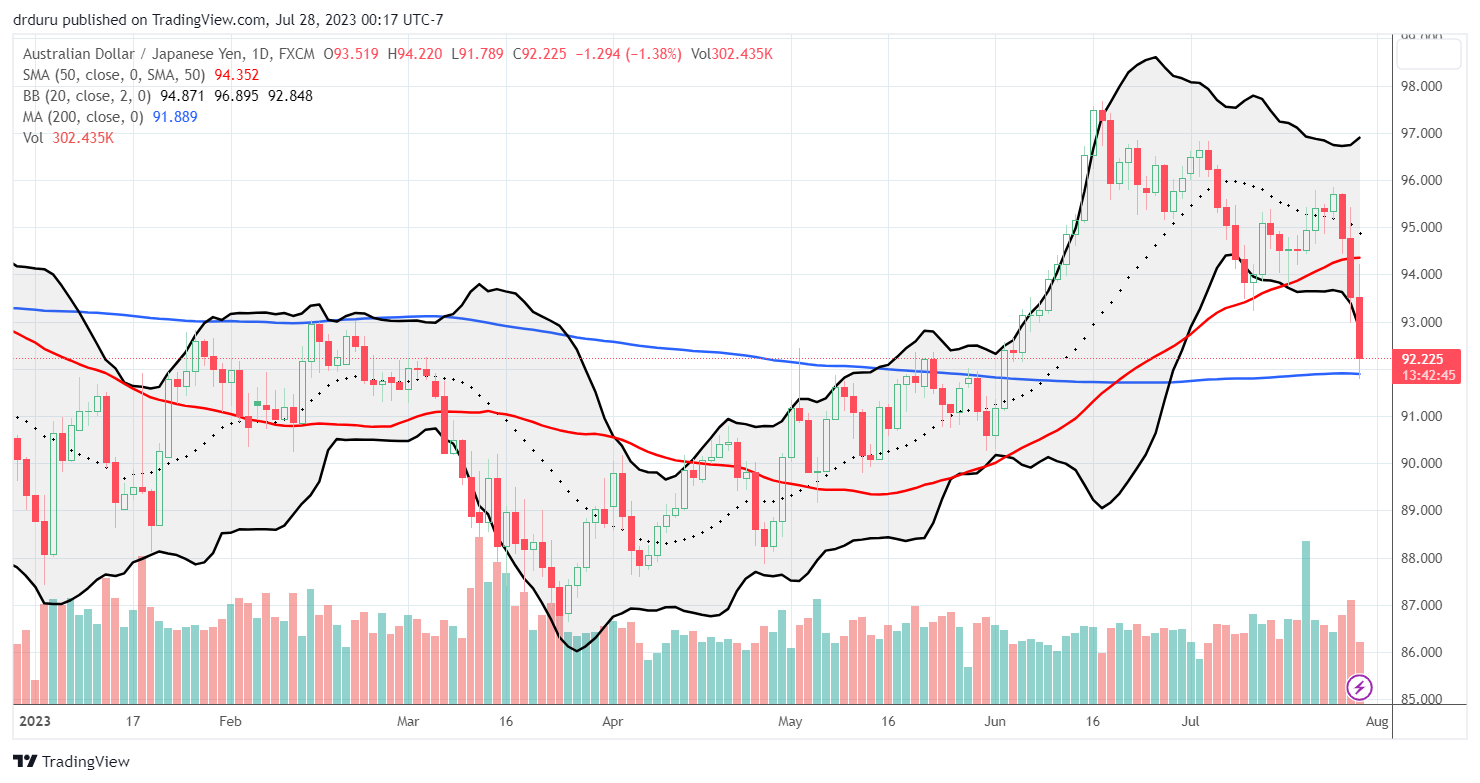
With the drama surrounding the Bank of Japan’s monetary policy, I am back to watching the Australian dollar versus the Japanese yen (AUD/JPY) as a key forex indicator of market sentiment. AUD/JPY plunged going into the Bank of Japan meeting and really got slammed as rumors transitioned into actual policy. At the time of writing, AUD/JPY perfectly bounced off 200DMA support (the blue line below). A continued bounce into the stock market open would validate my suspicion that the initial negative responses will get short-term reversals.
I am currently clinging to a small AUD/JPY position that I hope survives the selling as I want to collect carry trade premiums for a while longer.
")
")
Be careful out there!
Footnotes
Subscribe for free to get email notifications of future posts!
“Above the 50” (AT50) uses the percentage of stocks trading above their respective 50-day moving averages (DMAs) to measure breadth in the stock market. Breadth defines the distribution of participation in a rally or sell-off. As a result, AT50 identifies extremes in market sentiment that are likely to reverse. Above the 50 is my alternative name for “MMFI” which is a symbol TradingView.com and other chart vendors use for this breadth indicator. Learn more about AT50 on my Market Breadth Resource Page. AT200, or MMTH, measures the percentage of stocks trading above their respective 200DMAs.
Active AT50 (MMFI) periods: Day #83 over 20%, Day #57 over 30%, Day #54 over 40%, Day #40 over 50%, Day #15 over 60%, Day #1 under 70% (underperiod ending 11 days overbought)
Source for charts unless otherwise noted: TradingView.com
Full disclosure: long IWM call spread, long TLT put spread, long AUD/JPY
FOLLOW Dr. Duru’s commentary on financial markets via StockTwits, Twitter, and even Instagram!
*Charting notes: Stock prices are not adjusted for dividends. Candlestick charts use hollow bodies: open candles indicate a close higher than the open, filled candles indicate an open higher than the close.