Stock Market Commentary:
Market breadth almost reached overbought trading territory last week. The Federal Reserve is issuing yet another missive on monetary policy this coming Wednesday. The market’s script is arranged for the potential drama of a collision between the euphoria of overbought trading and a Federal Reserve that is eager to moderate the market once again. The Fed could catalyze a major cooling or it could provide (tacit) permission for the rally to continue apace. While the Fed should hold rates steady as the market expects, the Fed’s words, or lack of words, about its future plans should shape trading for the rest of the summer (through the August Jackson Hole confab of central bankers). With the VIX at pre-pandemic levels and the major indices each trading at important technical levels, I am bracing myself for a firm test of my bullishness.
The Stock Market Indices
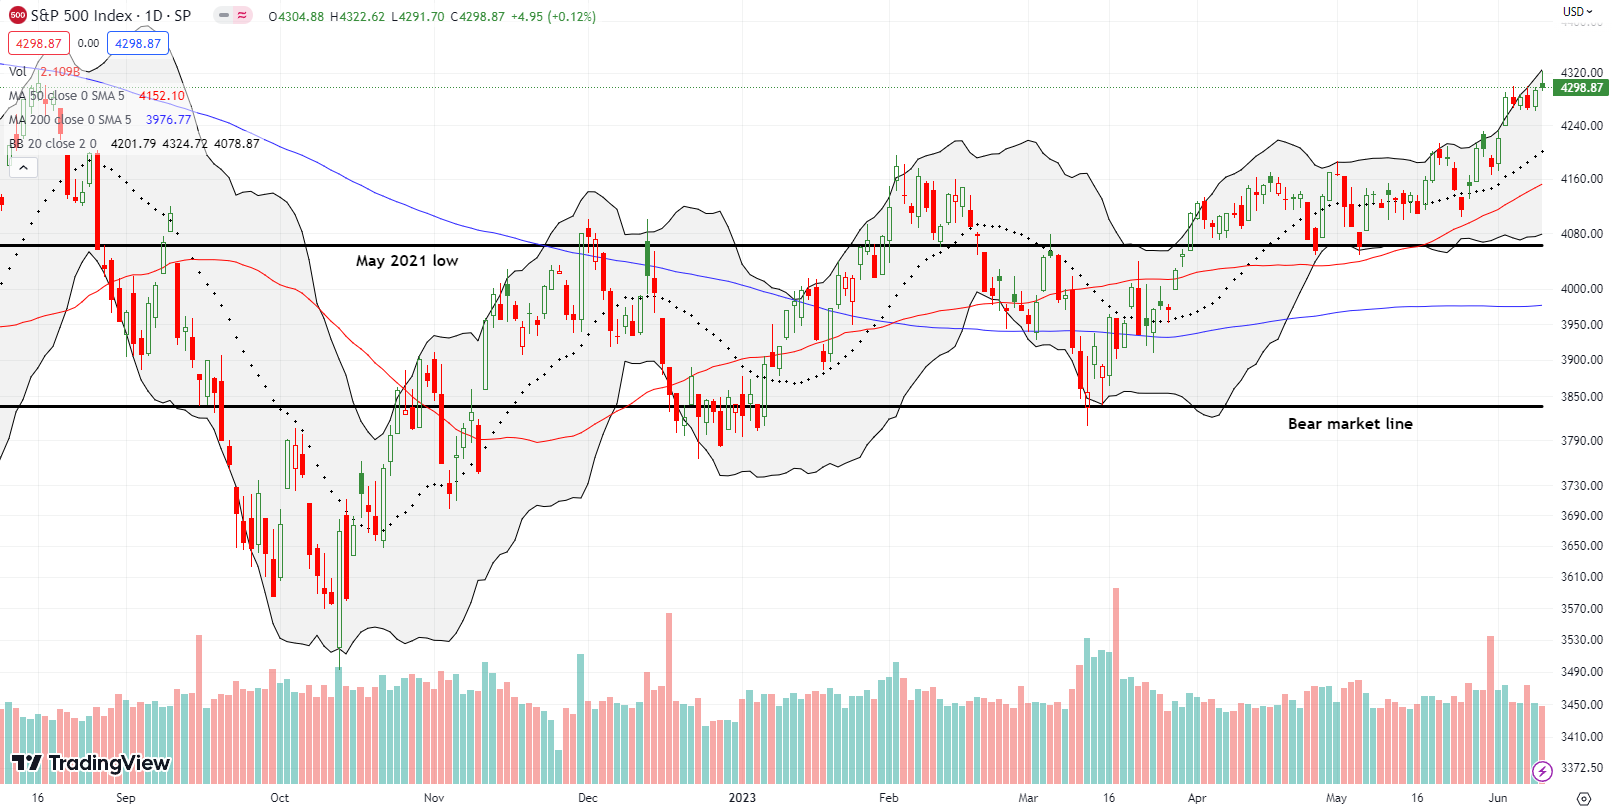
The S&P 500 (SPY) ended the week with a breakout, but the August, 2022 high is still hanging on as tantalizing resistance. Note that the index is now trading well above its 20-day moving average (DMA) (the dashed line below). So the S&P 500 is susceptible to a swift return to trend at any time. The collision course with the Fed could very well catalyze such a pullback. The overall bullish bias will remain as long as the 20DMA heads upward, and the S&P 500 trades above its 50DMA (the red line).
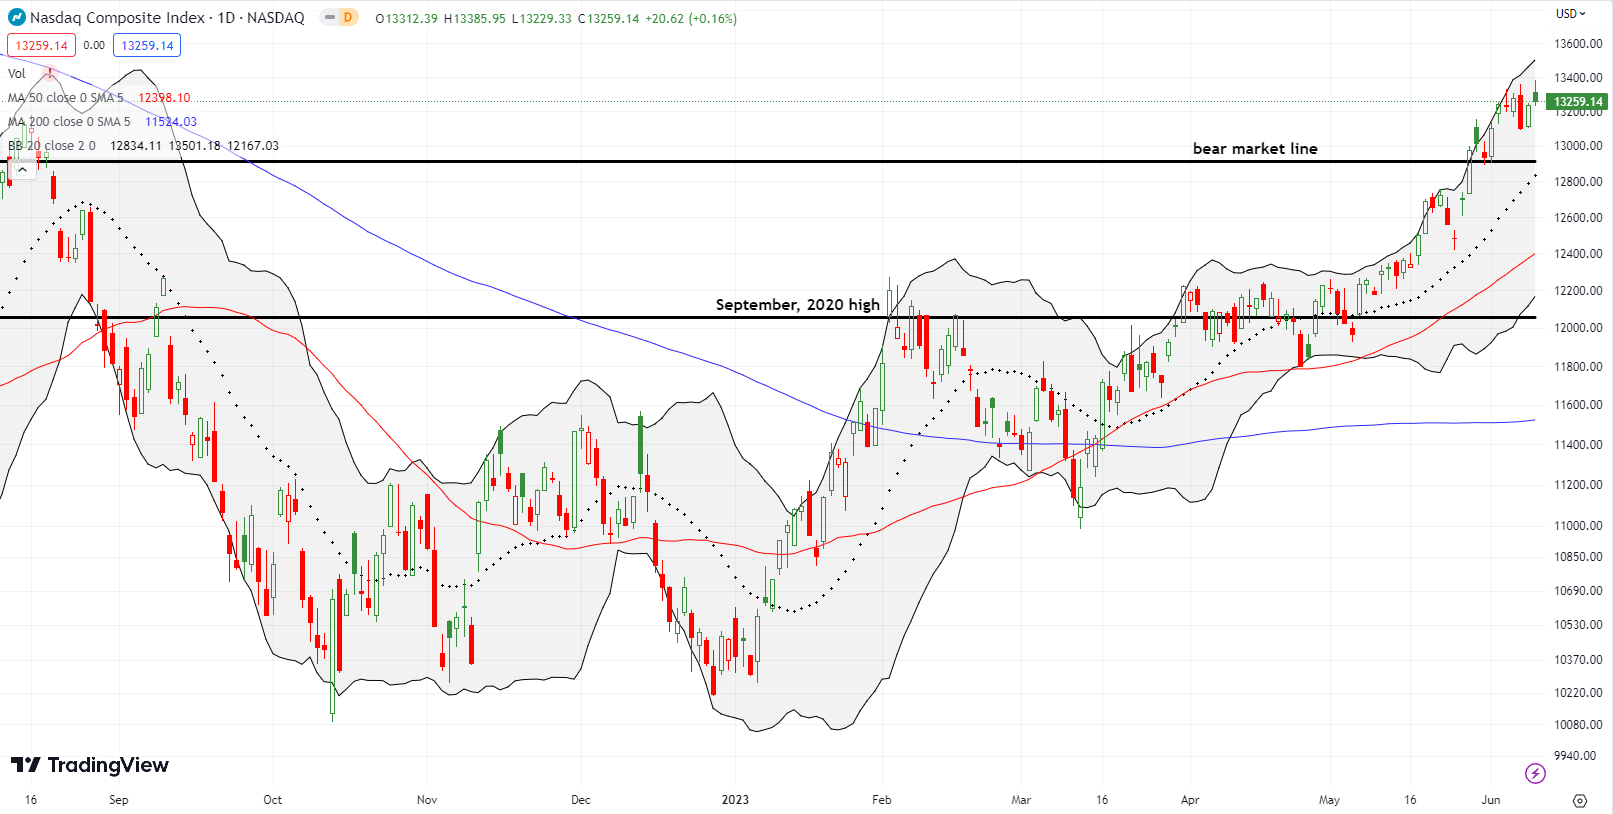
The NASDAQ (COMPQ) did not quite manage to generate a fresh breakout. Still, the tech laden index has cleared its August, 2022 high and sits at a 14-month high. Most importantly, the NASDAQ is now comfortably above its bear market line. While headlines announce the new bull market for the S&P 500 given the 20% gain from the bear market lows, I am more interested in the end of bear markets as the economy supposedly slows down.
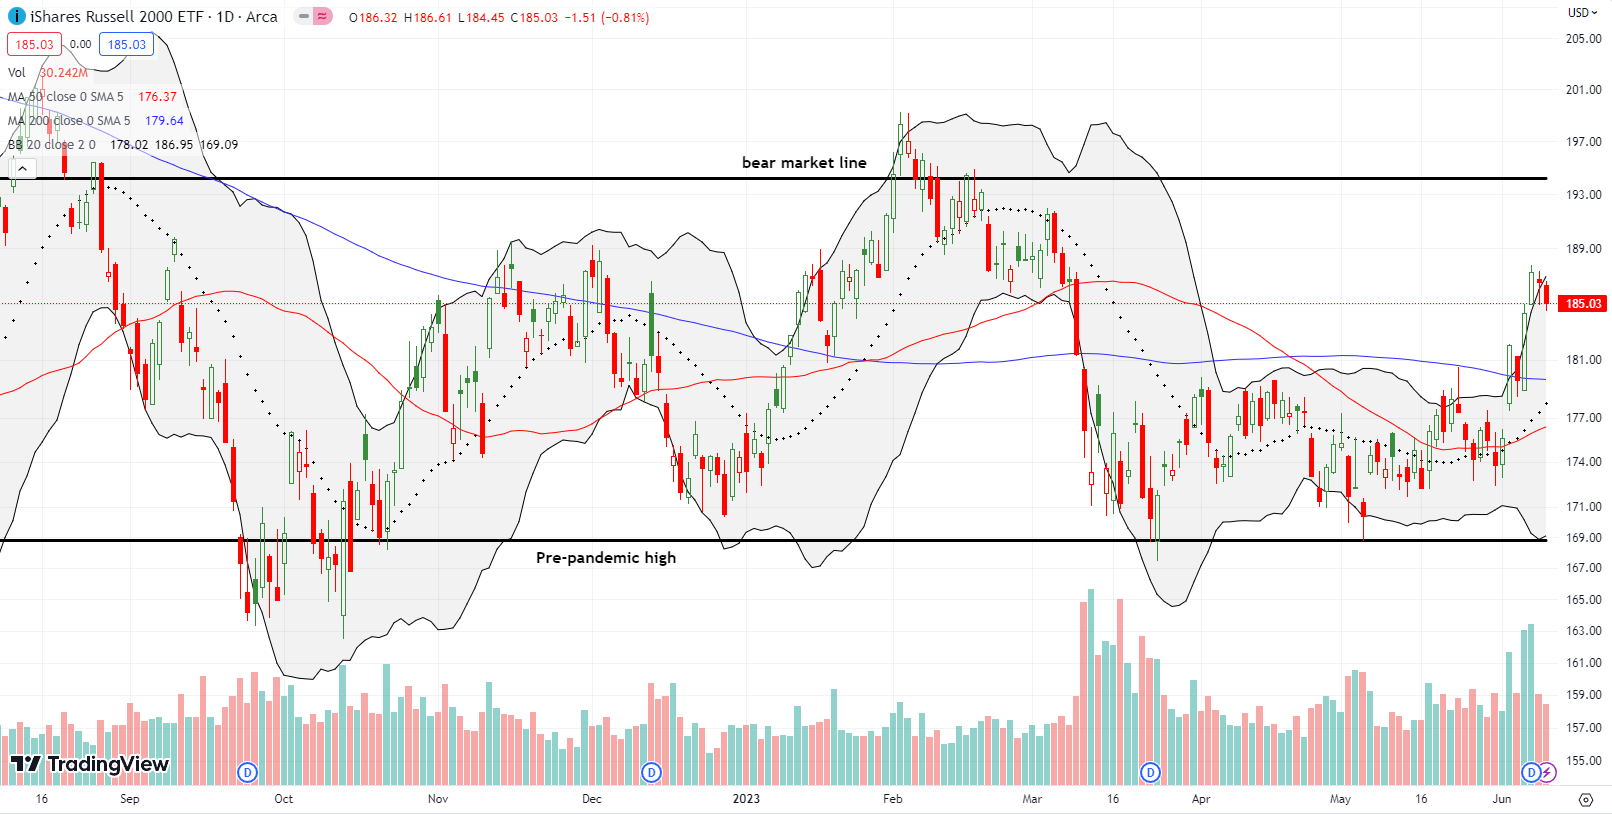
The iShares Russell 2000 ETF (IWM) started last week with a fade back to 200DMA support (the bluish line). Buyers returned in force the next two days to leave no doubt about a confirmed 200DMA breakout. Sellers used the last two days of the week to reverse Wednesday’s gain. At least IWM is no longer over-stretched above its upper Bollinger Band (BB). That Wednesday was a sharp and vicious rotation day. While IWM gained 1.6%, the NASDAQ lost 1.3% led by large losses in big cap tech names.
Note how IWM finally traded back to where it rested right before the collapse of Silicon Valley Bank in March.
Stock Market Volatility
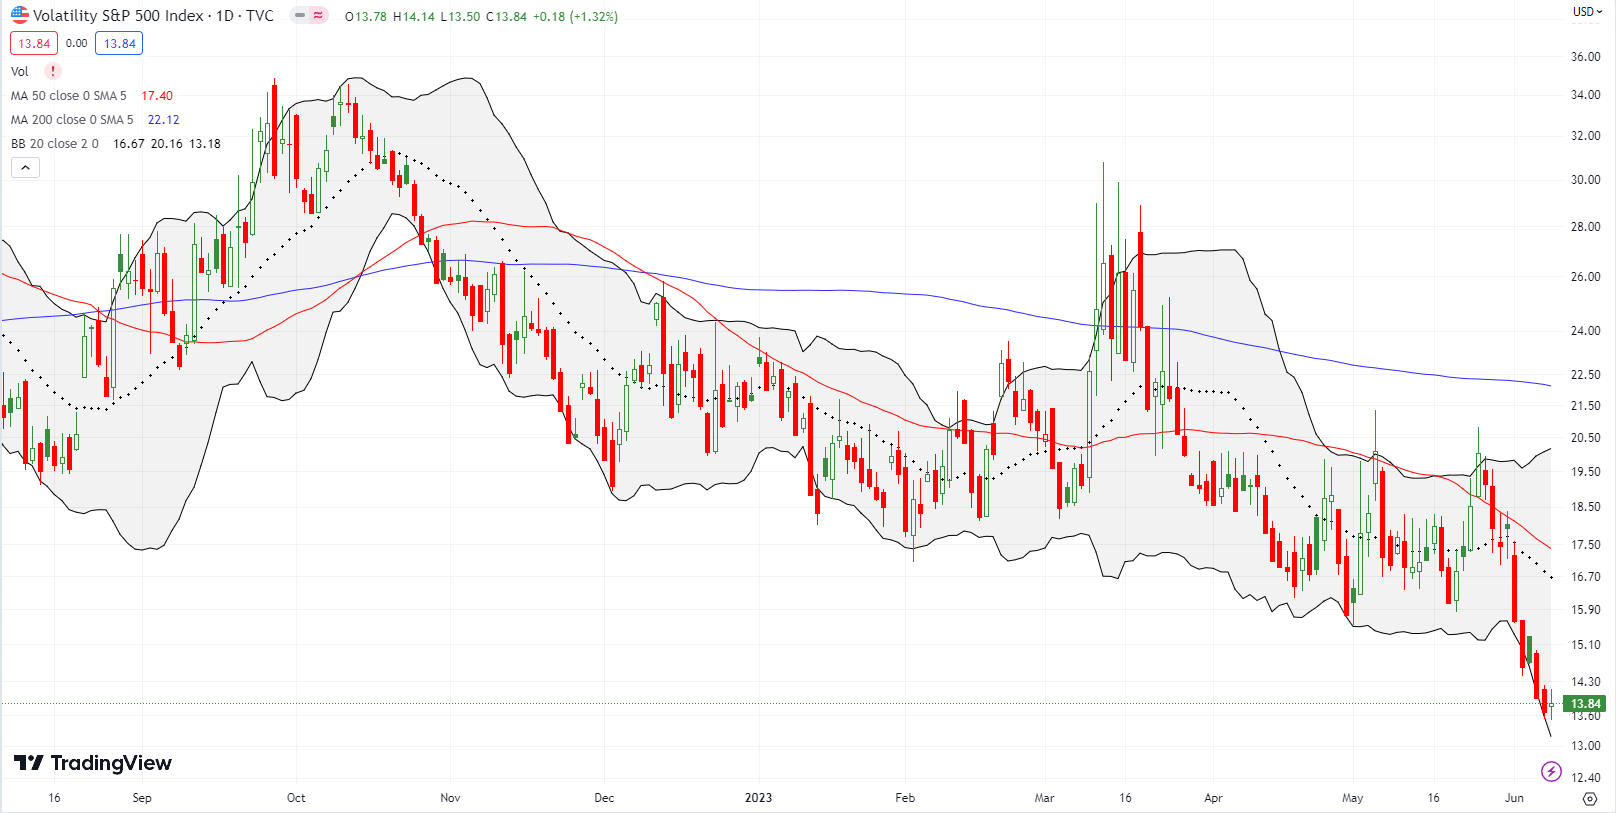
The volatility index (VIX) is accommodating the burden of the newfound bullish sentiment in the stock market. The VIX built on the losses from the previous week, marking the much-anticipated full reversal of the pandemic-era VIX gains. This reversal signifies a significant milestone and introduces a new period of complacency. The low VIX is truly remarkable, especially considering the anticipated economic slowdown later this year. However, this calmness may be justified, as analysts have raised earnings expectations for Q4. It’s difficult to imagine them taking such action if they subscribed to the recession narrative. From FactSet:
“While analysts expect earnings for the S&P 500 to decline in Q2 2023, they also project earnings growth to return in the second half of 2023. For Q3 2023, the estimated earnings growth rate is 0.8%. For Q4 2023, the estimated earnings growth rate is 8.2%. If 8.2% is the actual growth rate for the quarter, it will mark the highest year-over-year earnings growth rate reported by the index since Q1 2022 (9.4%).”
The Short-Term Trading Call With A Collision Course
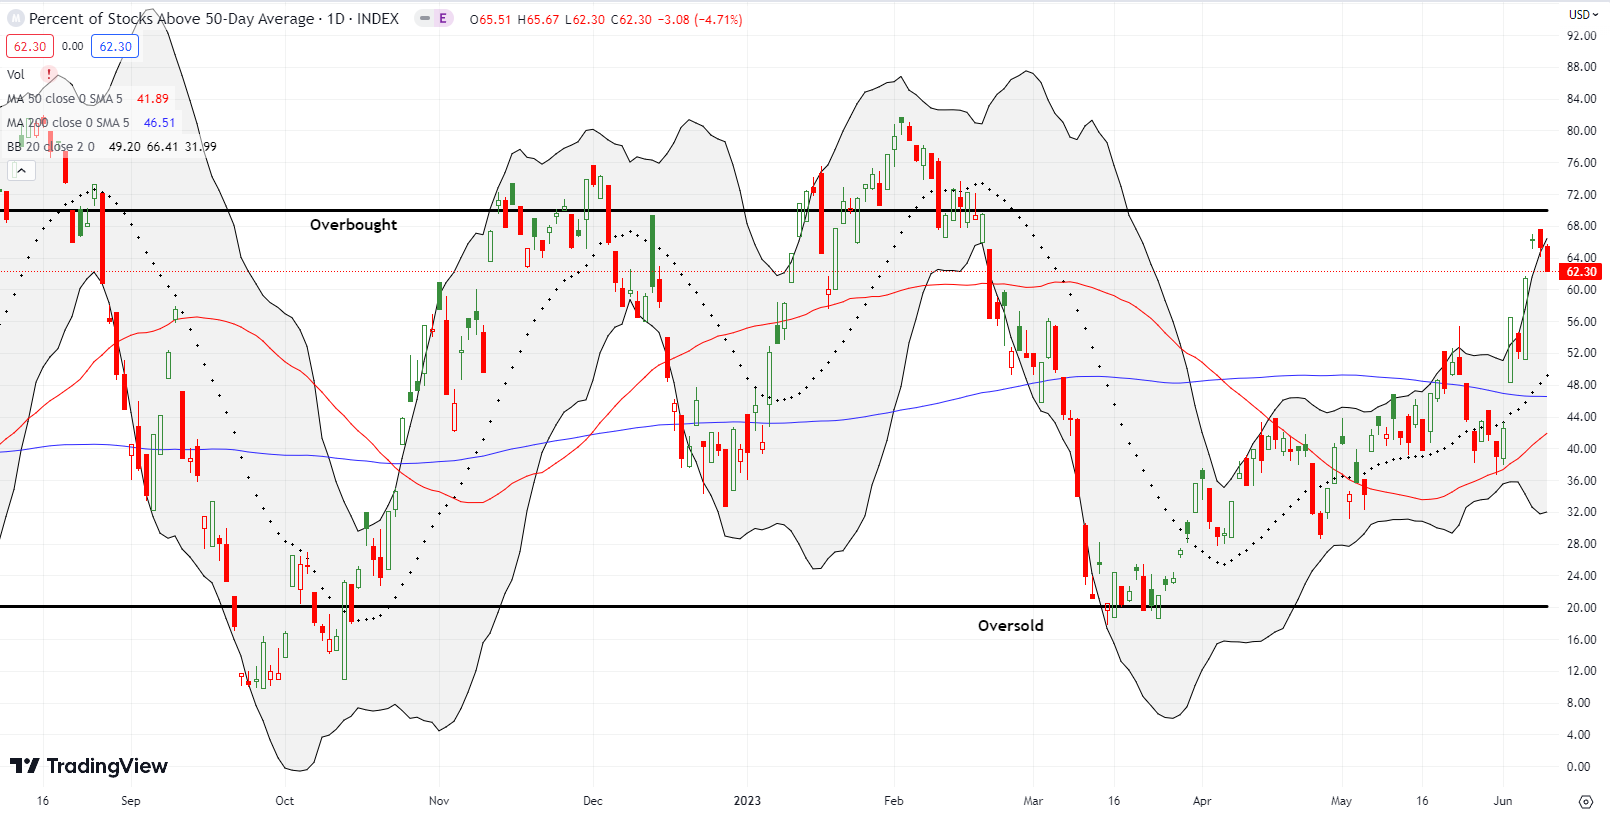
- AT50 (MMFI) = 62.3% of stocks are trading above their respective 50-day moving averages
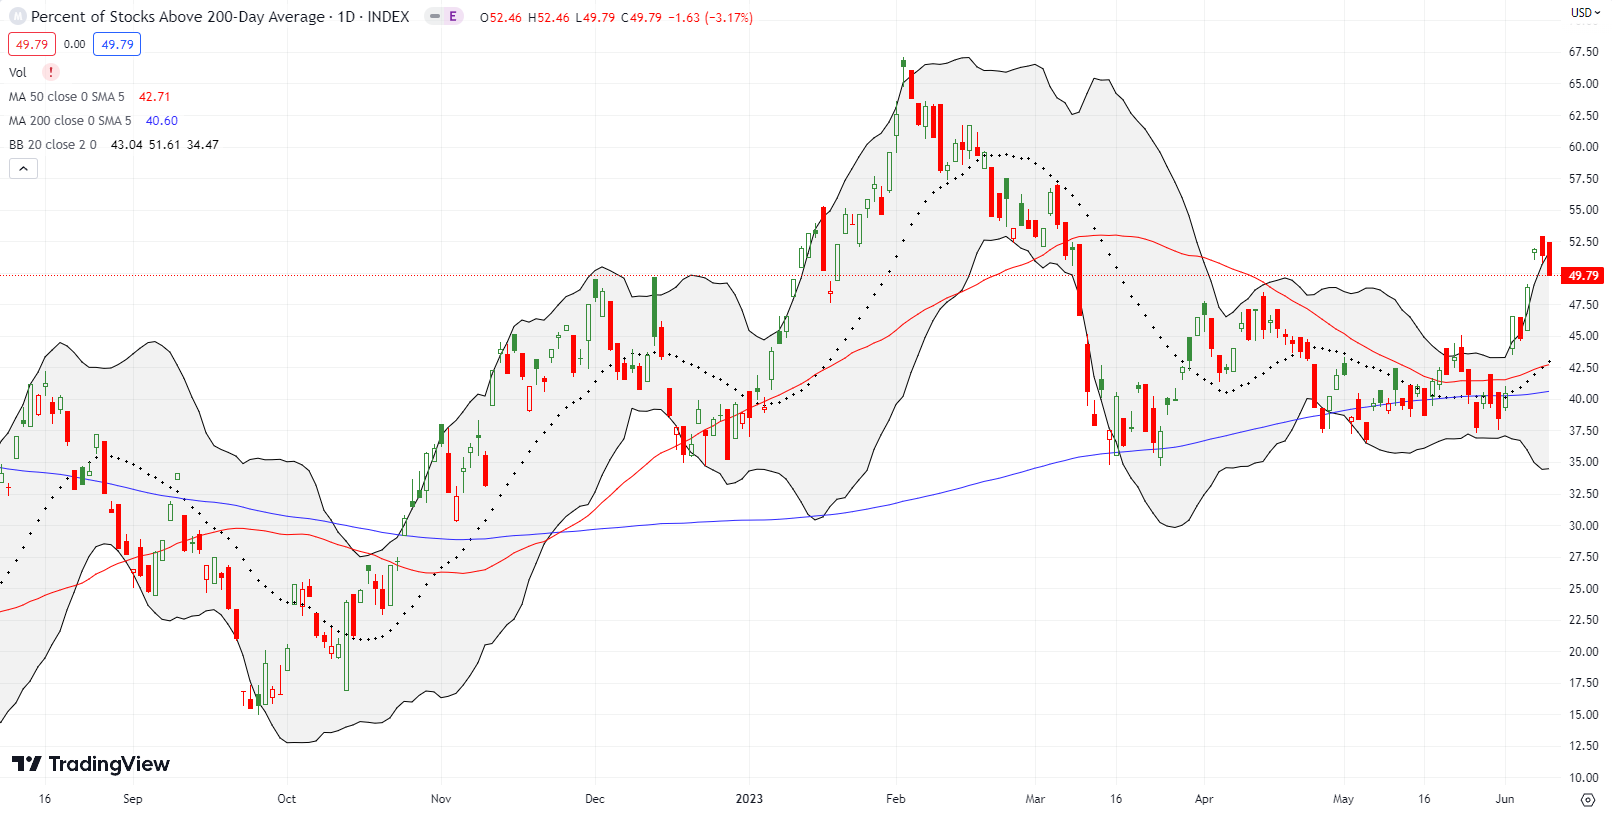
- AT200 (MMTH) = 49.8% of stocks are trading above their respective 200-day moving averages
- Short-term Trading Call: cautiously bullish
AT50 (MMFI), the percentage of stocks trading above their respective 50DMAs, traded as high as 67.0% before closing the week at 62.3%. The near collision with the overbought threshold at 70% both relieved and worried me. If my favorite technical indicator had gotten any closer to the overbought threshold, the pullback would, by rule, force me to flip bearish. Yet, I am not ready to go bearish without seeing more evidence. And thus my worry.
I have to wonder whether AT50 already got “close enough” to the overbought threshold to trigger the bearish call. As a result, the coming collision course with the Federal Reserve meeting takes on extra significance. With the VIX trading so low, traders need to brace for sharp and sudden pullbacks even if the overall bullish bias remains intact.
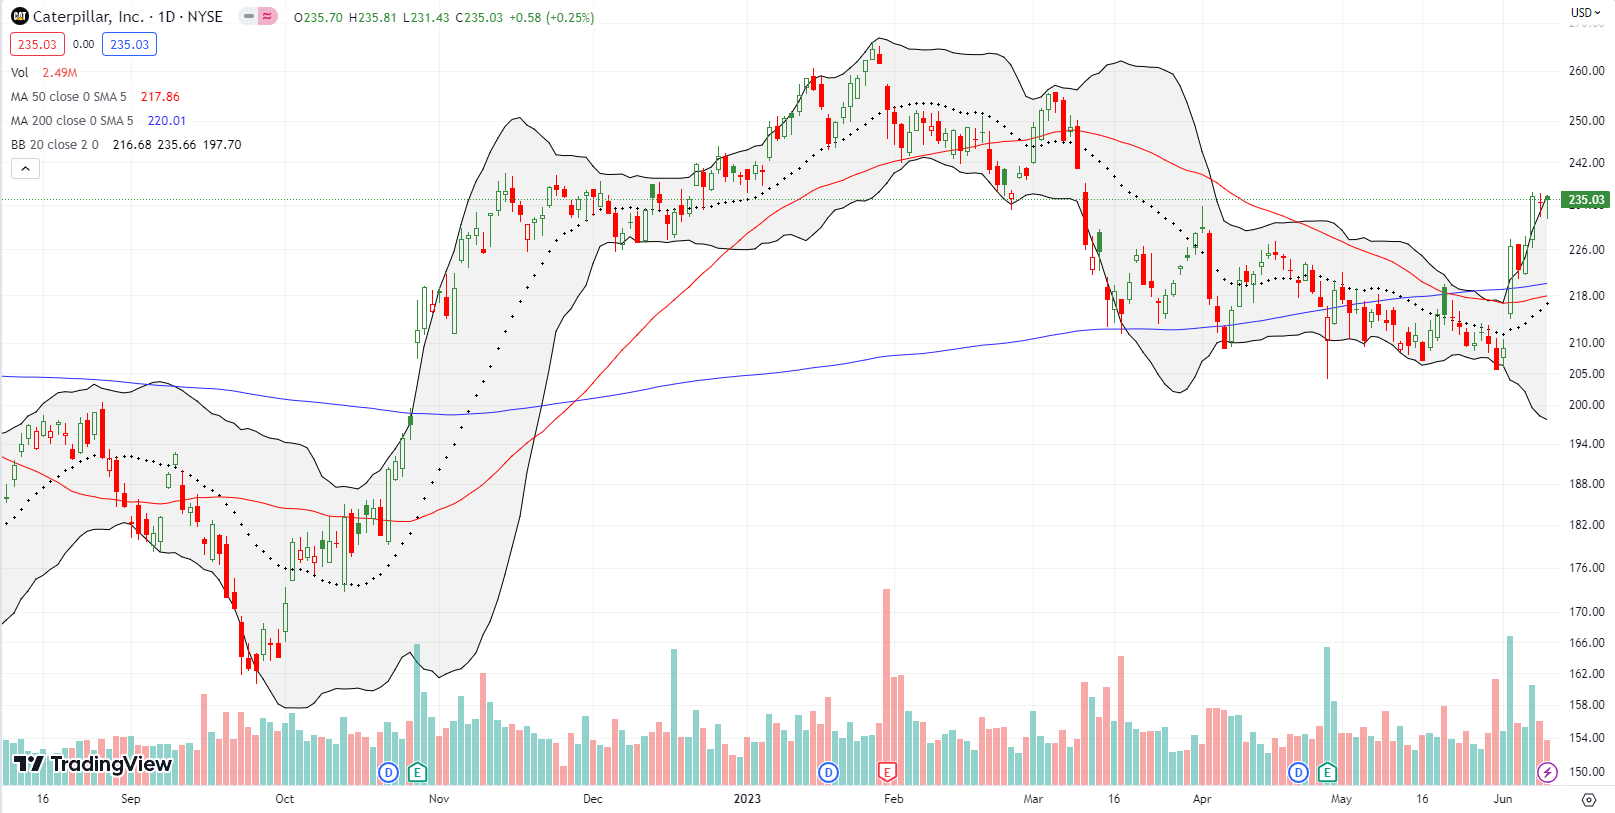
Caterpillar, Inc (CAT) is a fresh symbol for the bullish turn in the stock market. CAT benefited from the rotation on Wednesday with a 3.9% surge and a 3-month high. The confirmed breakout above all three moving averages is about as bullish as a rebound can get!
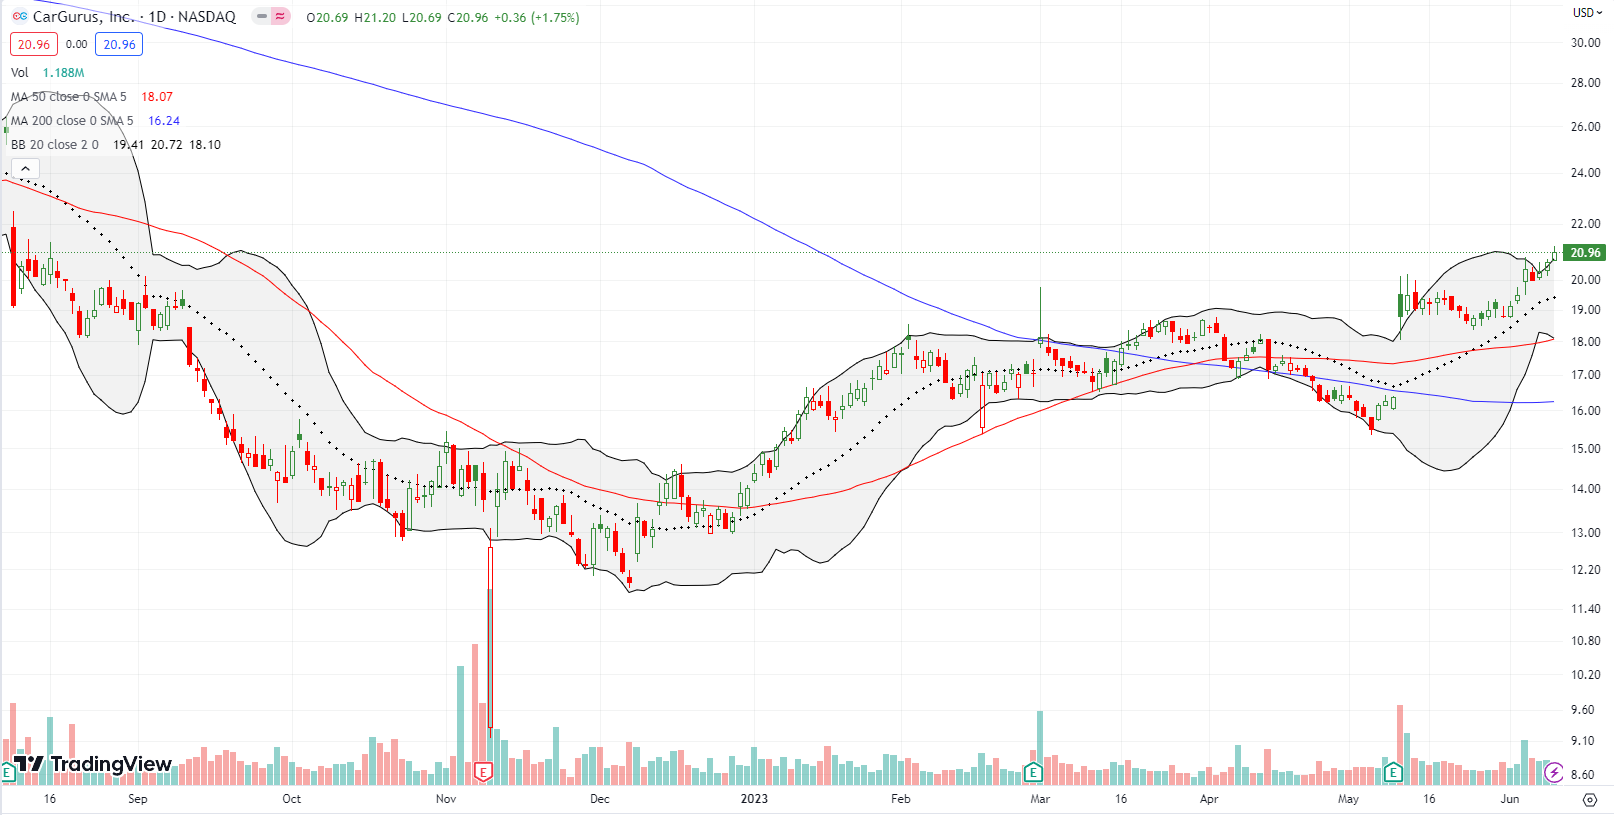
In my last Market Breadth post I noted how even Carvana (CVNA) looked like it was making a bearish to bullish reversal. Well CVNA surged on Thursday with a 56.0% gain…without me. That miss really stung! It sent me on a review of the charts of other used car dealers. That search led me to the bullish chart of CarGurus, Inc (CARG).
May’s 14.9% post-earnings gap higher set the bullish tone with a breakout to an 8-month high. The stock drifted from there and found fresh life as it approached 20DMA support. Last week’s breakout to a 10-month high reaffirmed the bullish turn in CARG, especially given the upside resolution to the BB-squeeze. The stock is now working on reversing a 25.5% post-earnings loss from last August. I wasted no more time in buying shares.
CARG has 10.4% of its float sold short.
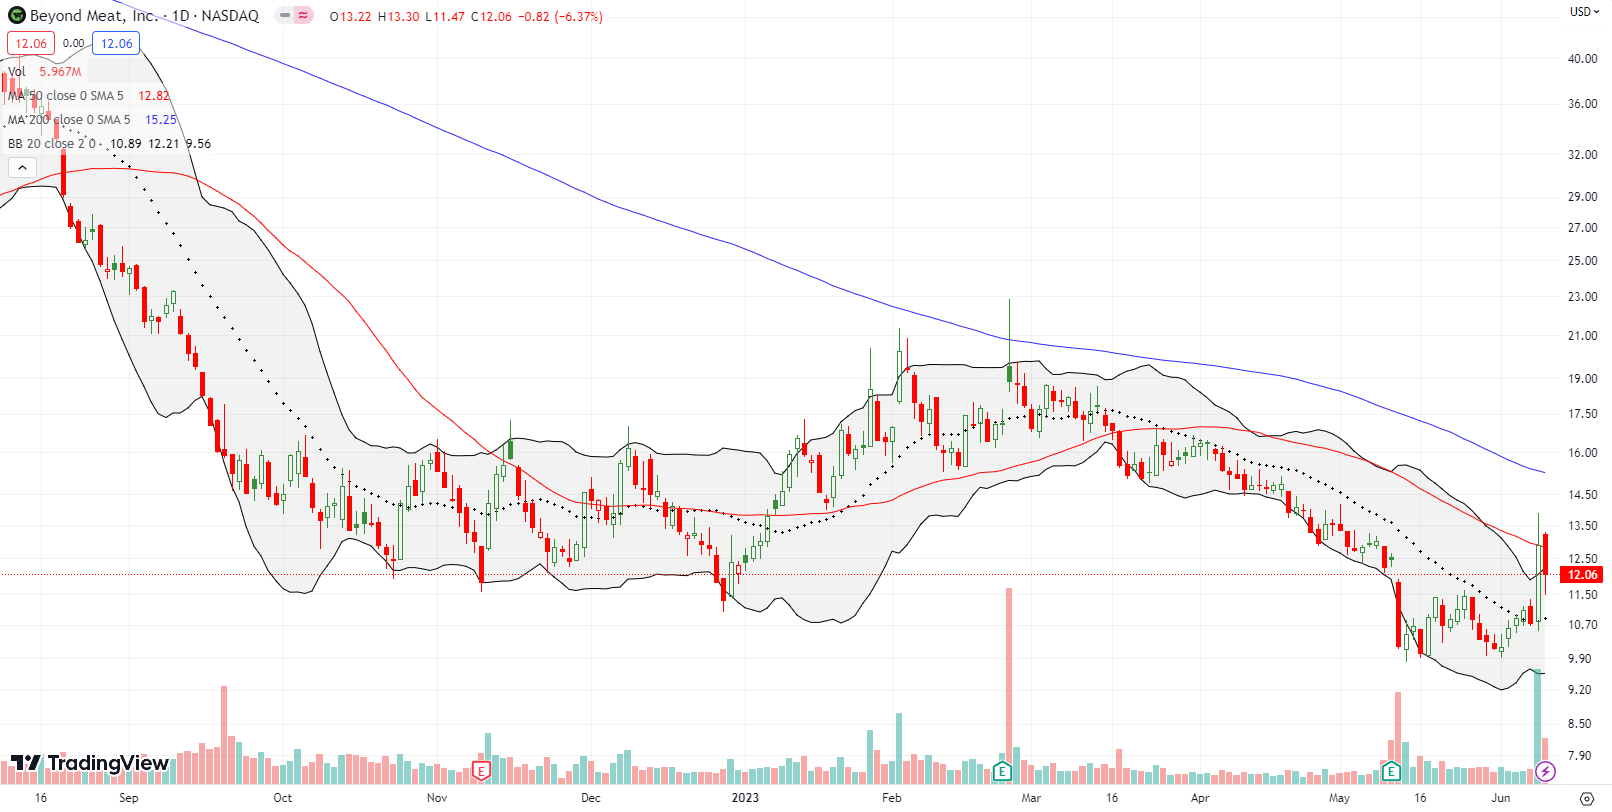
Something must have entered the water for highly shorted stocks on Thursday. Beyond Meat, Inc (BYND) jumped out of nowhere for a 19.7% gain. Unlike CVNA, the chart did not signal any bullish hints. Like CVNA, BYND pulled back sharply the next day. The end result is a 50DMA that remains in place as resistance…for now.
BYND was once a trading darling during the heady days of the hyper-stimulated pandemic stock market. Now, the stock is struggling to pull away from all-time lows.
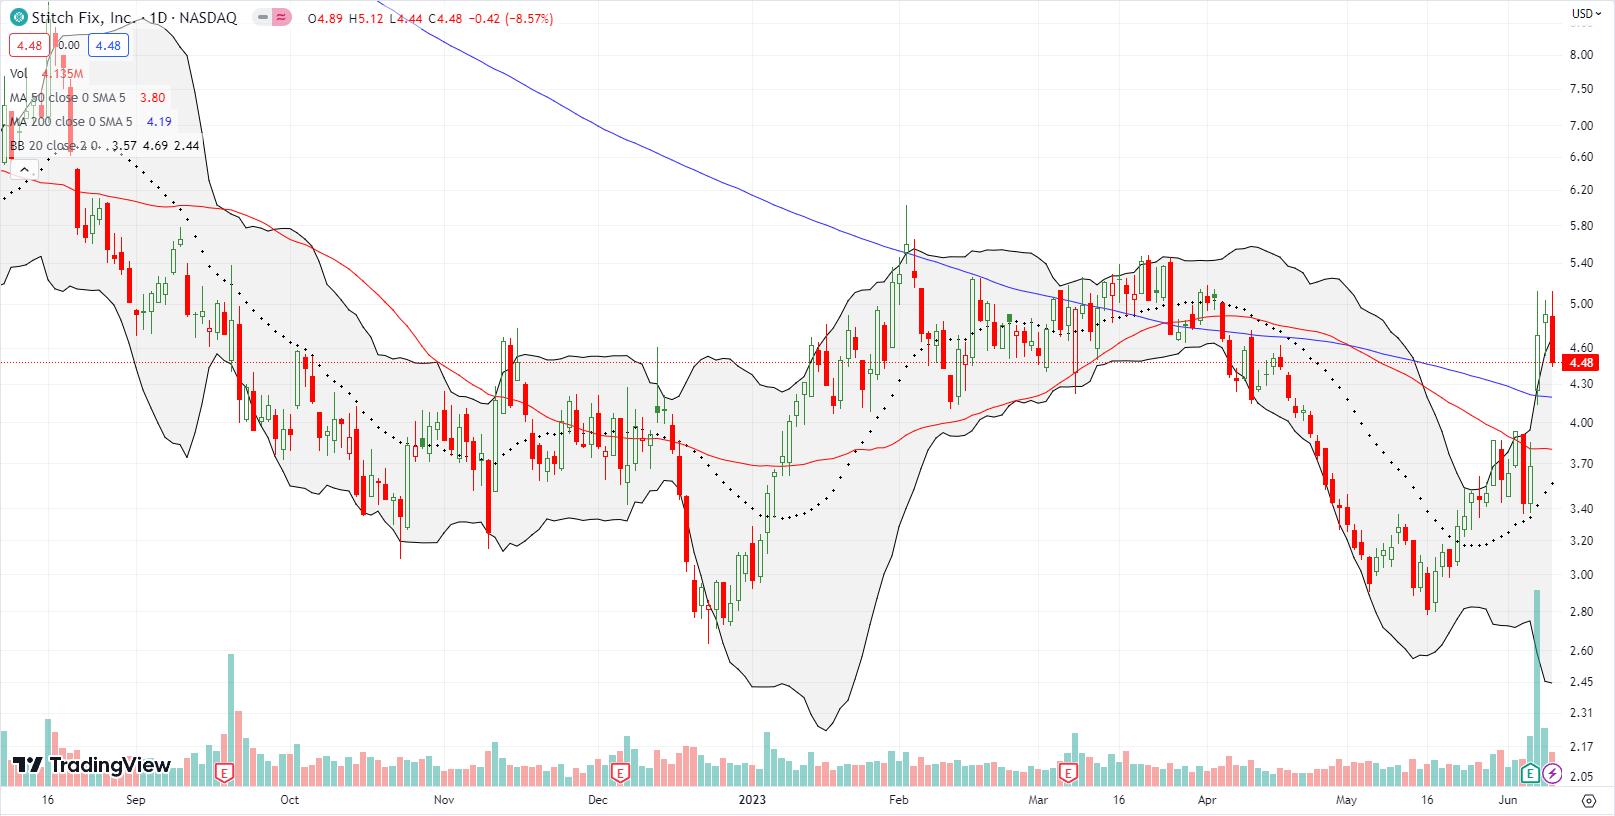
Stitch Fix, Inc (SFIX) disappointed me in April, and I bailed on my speculative position. Thanks to a pre-earnings rally and a post-earnings 28.0% gain, SFIX is right back in the mix. While it broke out above both 50DMA and 200DMA resistance, I am staying my hand. Friday’s 8.6% pullback aligned with the selling in other highly shorted trader playthings (SFIX has 18.3% of its float sold short), so I want buyers to prove their staying power with a clean breakout above the January to March consolidation period.
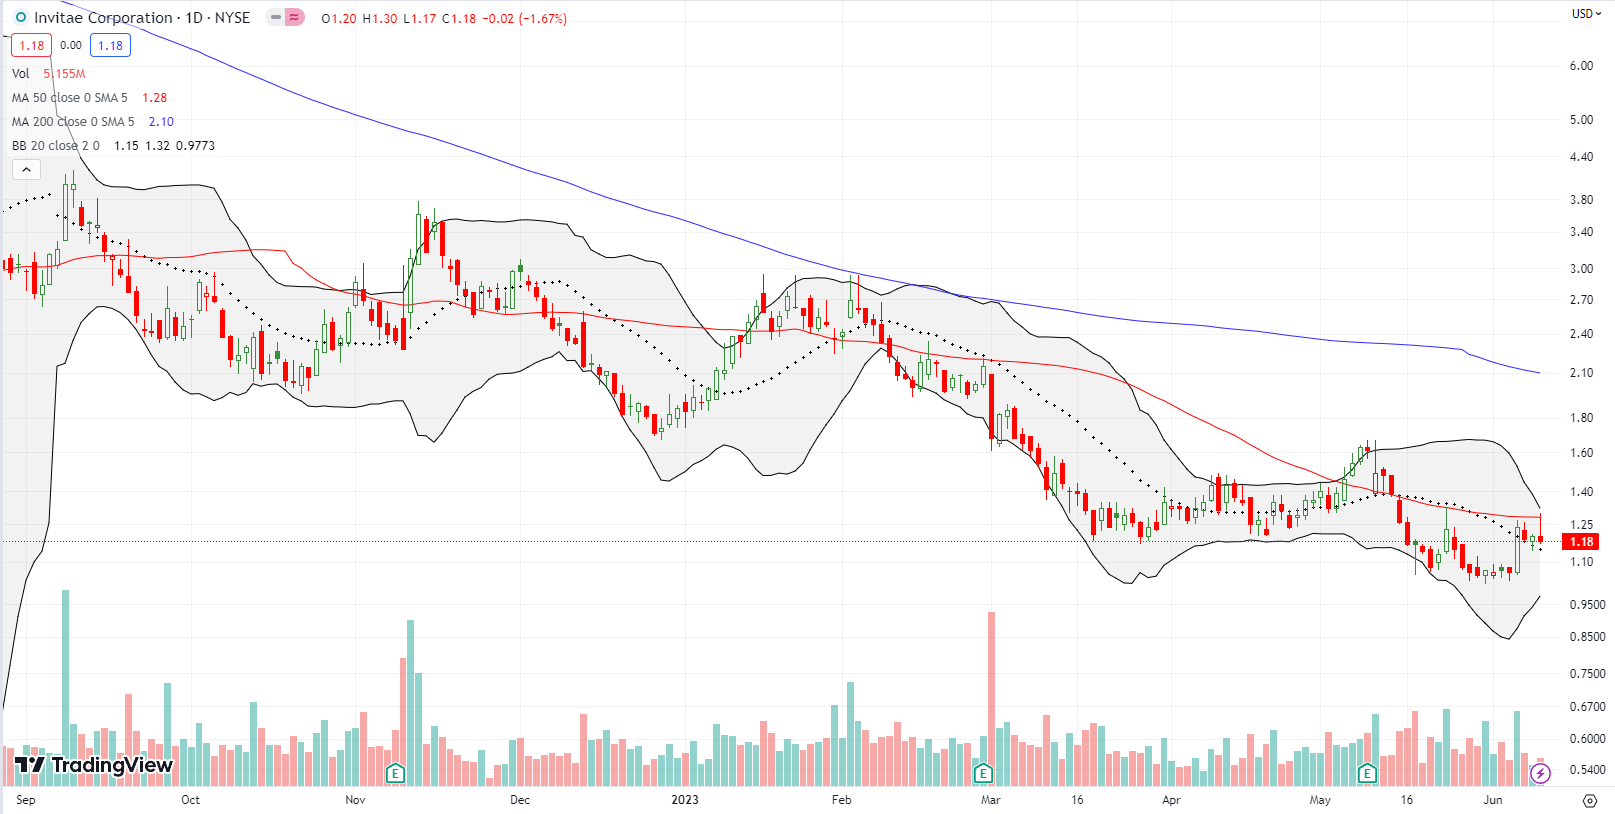
Speaking of disappointments, Invitae (NVTA) may be my biggest disappointment in a very long time. I laid out most of my bullish case over two years ago in “A New Investing Opportunity in Genetic Testing Company Invitae.” Up until then, I had done well trading around a core NVTA position including the occasional sale of covered calls. As it turned out, I wrote that post at the beginning of a relentless and extended sell-off. Last August, an incredible 277% one-day run-up gave me fresh hope. Unfortunately, the selling resumed from there. I gulped hard and took my loss on NVTA last month as part of a portfolio clean-up and tune-up.
NVTA generated some false excitement last week as buyers rushed to defend the $1 level. Below here and NVTA starts to run the risk of delisting. Moreover, companies that sink into these depths have a very poor survival record. So I was quite amused to read ARK Invest’s commentary on NVTA in its weekly email on stocks in its various portfolios that make one-day moves of 15% or more, up or down.
“Two of ARK’s multi-omics holdings traded up significantly this week on no news. Personalis traded up ~17% on Monday and reverted on Wednesday, while Invitae traded up ~16% on Tuesday and held most of its gains during the week. Personalis provides immune-oncology (IO) diagnostic assays for biopharmaceutical developers. Invitae is a medical genetics testing company known for its scalable variant interpretation engine,1 suite of digital and clinical services, and innovation in liquid biopsy.”
ARK holds NVTA in ARK Genomic Revolution Multi-Sector ETF (ARKG) where it is now third lowest in share among the numerous bloodied holdings. I guess ARK is going boom or bust on NVTA as it seems destined to do with so much of its imploded “innovation” stocks. This commentary from March 3rd is telling:
“Shares of Invitae traded down ~22% on Wednesday after the company announced not only fourth-quarter and full-year earnings results but also a convertible debt offering. In response to substantial restructuring and product portfolio optimization during the last eighteen months, Invitae continued to improve operating margins, grow revenue, and lower cash burn—trends we expect to extend through 2023. In our view, the stock traded down in response to the convertible note exchange, led by Deerfield Management, even though it will retire ~96% of Invitae’s debt obligations due in 2024. While the transaction removes a near-term liquidity risk, if converted to equity, the new notes would dilute existing shareholders substantially. Invitae is a molecular diagnostics and clinical data company focused on hereditary genetics, reproductive health, rare disease, and oncology.”
The massive dilution did not appear to make ARK even blink. I am going to keep checking in on NVTA through ARK’s performance summaries; I am pretty sure NVTA has many more 15% moves in its future.
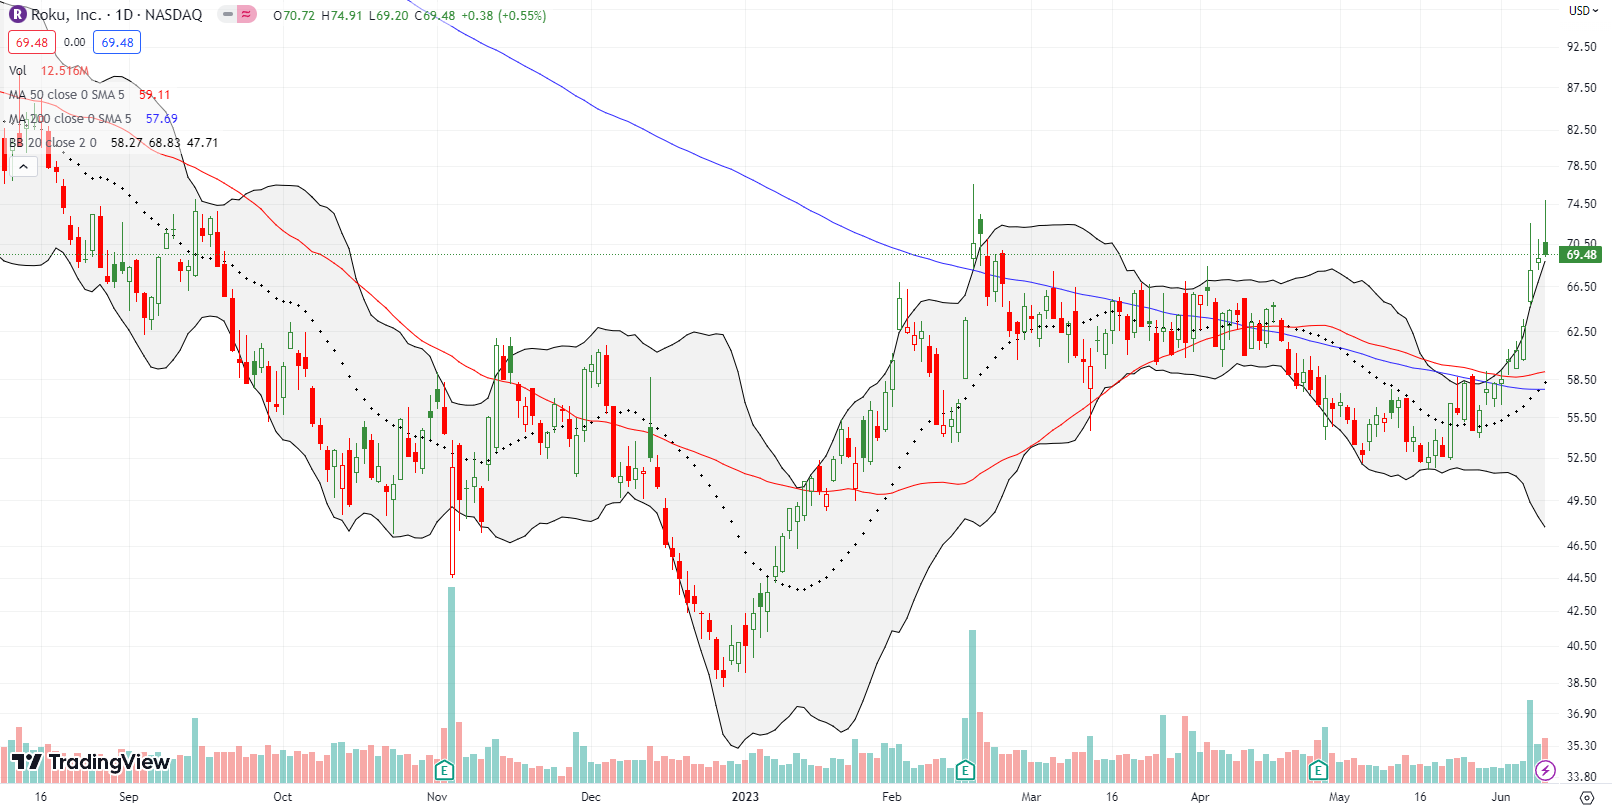
Starting Wednesday, I started to see some key fades, and I could not help implementing some targeted bearish positions. I targeted Roku, Inc (ROKU) on Friday with a put spread after a third straight day stretching above its upper-BB. For the second of the three days, ROKU faded sharply off intraday highs. Now the stock looks very toppy as it struggles with resistance from its February high. Since I am bullish on the market and ROKU is not a hedge, I plan on quickly flipping this position…presumably ahead of the collision course with the Fed.
Be careful out there!
Footnotes
Subscribe for free to get email notifications of future posts!
“Above the 50” (AT50) uses the percentage of stocks trading above their respective 50-day moving averages (DMAs) to measure breadth in the stock market. Breadth defines the distribution of participation in a rally or sell-off. As a result, AT50 identifies extremes in market sentiment that are likely to reverse. Above the 50 is my alternative name for “MMFI” which is a symbol TradingView.com and other chart vendors use for this breadth indicator. Learn more about AT50 on my Market Breadth Resource Page. AT200, or MMTH, measures the percentage of stocks trading above their respective 200DMAs.
Active AT50 (MMFI) periods: Day #49 over 20%, Day #23 over 30%, Day #20 over 40%, Day #6 over 50%, Day #3 over 60%, Day #74 under 70%
Source for charts unless otherwise noted: TradingView.com
Full disclosure: long QQQ call spreads, long CARG, long ROKU put spread
FOLLOW Dr. Duru’s commentary on financial markets via StockTwits, Twitter, and even Instagram!
*Charting notes: Stock prices are not adjusted for dividends. Candlestick charts use hollow bodies: open candles indicate a close higher than the open, filled candles indicate an open higher than the close.


I can barely believe I’m writing this, given what an inflation skeptic I had been. But pandemic-caused base effects are finally aging out. The USA is now in a transitionary phase in which a combination of three ongoing domestic fiscal stimuli – (1) infrastructure bill (2) IRA (3) CHIPS act – are increasing demand for labor (and some commodities), while workforce aging and consequent lower productivity, and lower immigration due to simultaneous recovery in other countries, are reducing supply. On-shoring due to the CHIPs Act in the USA – and similar actions elsewhere – is a significant force that few mention. Finally, global recovery, the war, and oil supply cuts are supporting energy prices.
Addendum: I forgot to mention that I bought QQQ call spreads after it started to rebound from Wednesday’s sharp rotation out of big cap tech.
Yes. I told ya I wasn’t going to accept “base effects” as an excuse for inflation skepticism year-after-year. 😉
The Fed must have serious headaches thinking about all the stimulus out of their control that’s going to keep inflation higher than recent norms. I suspect at some point the Fed will use a Jackson Hole moment to announce a 3-4% target largely because of the factors you mention. They will then admit that the 2% target was arbitrary all along. What is MORE important is stable prices at some equilibrium that can be well-anticipated.