

Stock Market Commentary
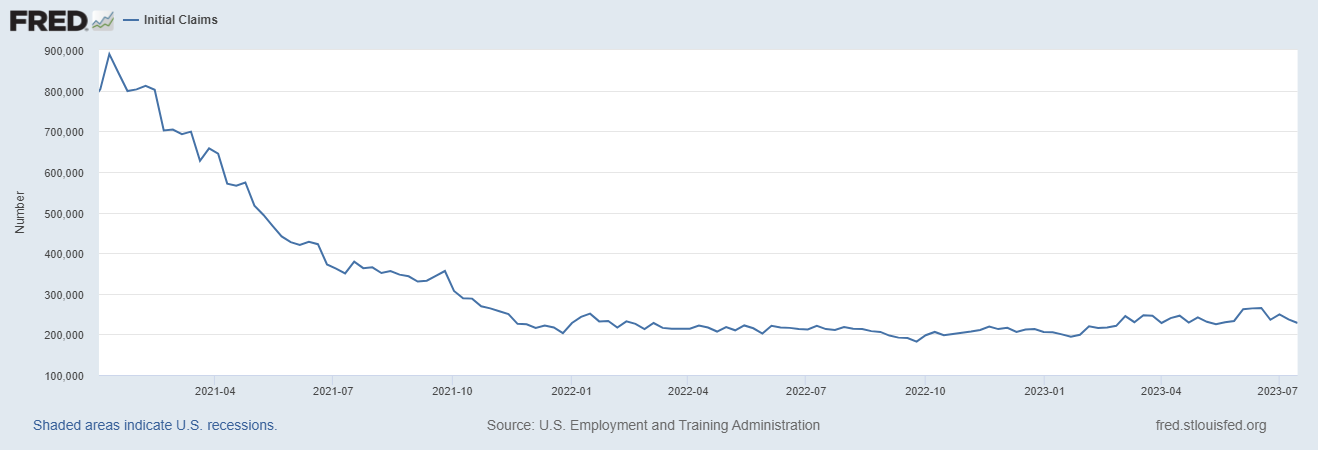
On Thursday, good economic news scared Wall Street yet again. Initial jobless claims came in well below “expectations” and set off a cascade of reactions. Interest rates shot up and the stock market dropped down. The stubborn strength of the labor market allows the Federal Reserve to stay hawkish and keep its interest rate higher for longer. Market breadth still managed to maintain overbought trading conditions and now escorts the summer of loving stocks as it stares down the Fed and its next statement on monetary policy on Wednesday.
The good economic news is even worse for people drawing lines from June’s increase in initial claims all the way to the long awaited recession and rate cuts from the Fed. The chart below now suggests initial claims could easily settle back down and stabilize well short of recessionary levels for more weeks and months to come.
The economic leading indicators – that so many economists and pundits rely on to make predictions and dismiss “lagging indicators” like employment – have failed for so long during this economic cycle that some soul-searching is unfolding. After another recessionary read from the leading indicators last week, Marketplace broadcast a piece titled “What’s the best way to predict where the economy is headed?” It examined the relevance of the leading indicators in this moment. One key quote came from the chair of the University of Houston economics department: “It’s just the 10 things that looked like they were pretty good at predicting the economy in the past, right?” So is it possible the leading indicators can be lagging indicators in disguise? Insert my macroeconomic head spinning round and around here.
Now back to the technicals of the financial markets…
The Stock Market Indices
The S&P 500 (SPY) peeled off its upper Bollinger Band (BB) thanks to Thursday’s disappointment in good economic news. The index fell 0.7% on Thursday and barely held its ground on Friday. The technicals look “uncomfortable”; the S&P 500 is one small catalyst away from a quick reversal of the July 12th breakout and an important test of the uptrending 20-day moving average (DMA) (the dotted line below). The Federal Reserve’s coming statement on monetary policy on Wednesday could provide that catalyst.
")
The NASDAQ (COMPQ) already looks set to reverse its recent breakout and test its uptrending 20DMA. The tech laden index lost a solid 2.1% on Thursday and sellers weighed heavy on the index on Friday. Bears jumped right on Friday morning’s gap open.
")
The iShares Russell 2000 ETF (IWM) put pressure on the bears with a confirmed breakout above the bear market line. Thursday’s good economic news was like the calvary coming to the rescue as IWM flipped and essentially confirmed a failure at the resistance set up by February’s high of the year. Now the ETF of small caps is caught in a squeeze between bearish and bullish technicals. Yet again, the Fed looms around the corner ready to serve up the potential catalyst to settle a bear/bull fight.
")
The Short-Term Trading Call the Market Stares Down
- AT50 (MMFI) = 74.0% of stocks are trading above their respective 50-day moving averages (day #8 overbought)
- AT200 (MMTH) = 59.2% of stocks are trading above their respective 200-day moving averages
- Short-term Trading Call: cautiously bullish
AT50 (MMFI), the percentage of stocks trading above their respective 50DMAs, behaved more resiliently than I expected given the selling of the last two days of the week. My favorite technical indicator fell to 74.0% but closed flat for the week. That resilience was the main good news of the week as it keeps me comfortably at cautiously bullish despite the shadowy danger posed by the Federal Reserve in the coming week. Still, as always, I am prepared to pivot if the market ends overbought trading in a decisive and definitive way before or after it stares down the Fed.
The poetic chart of Apple Inc (AAPL) symbolizes some of the relentless accumulation of stocks this summer. AAPL’s uptrend is well-defined by its 20DMA reaching back to the stock’s relatively calm reaction to the collapse of some regional banks back in March. Since then, sellers have tried to punch through and end the uptrend 5 times without success. The current test, the 6th attempt by sellers to change the narrative, comes at a critical juncture with the Fed up to bat this week. I am watching AAPL closely as a key tell. In the meantime, I dusted off the Apple Trading Model (ATM) and bought call options.
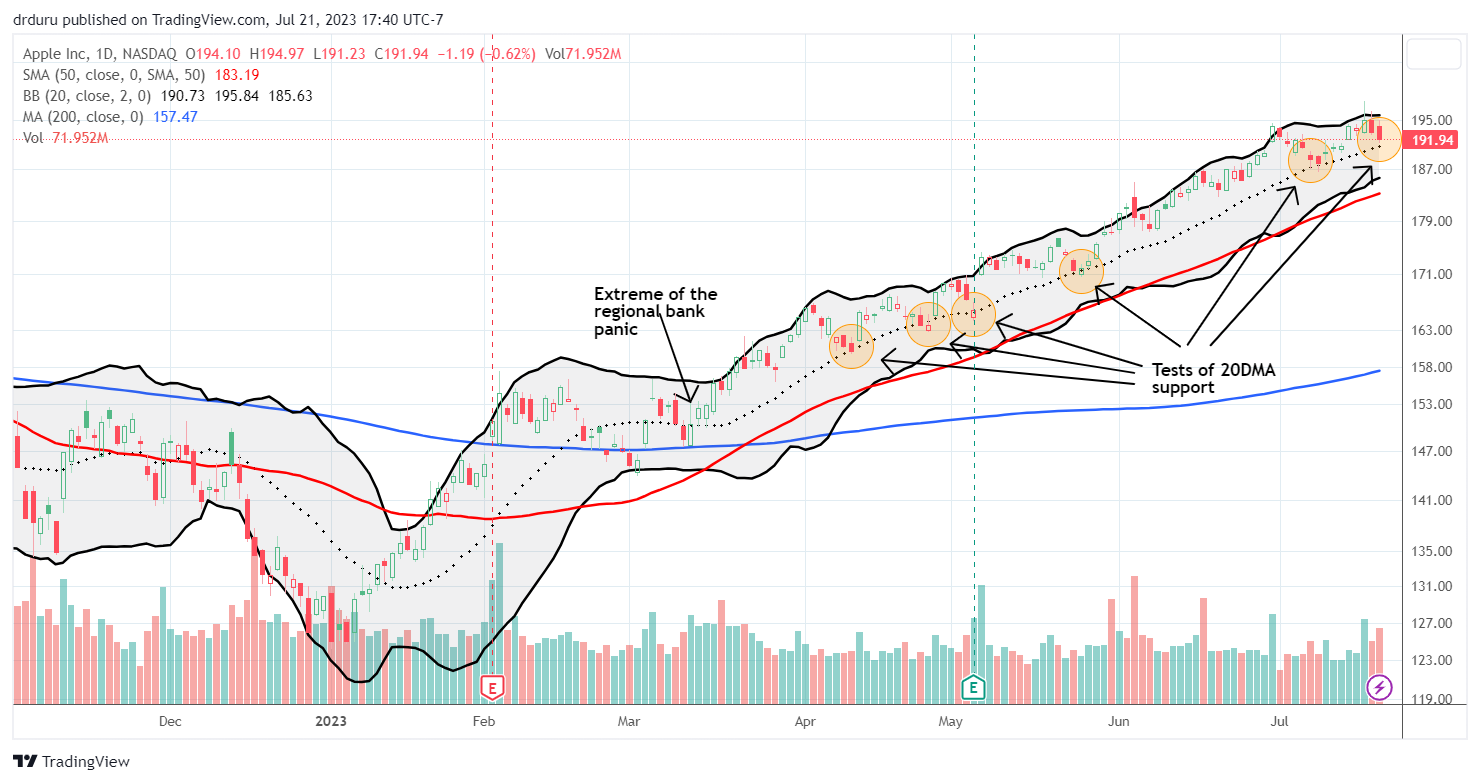
Note the AAPL chart carries a HUGE caveat. A reader on StockTwits rightfully pointed out that AAPL’s weekly chart looks bearish. The long wick created by an overall fade for the week is reminiscent of a fade the week of August 15th last year that proceeded an extended sell-off.
@DrDuru Man the weekly chart looks really bad
— (@MaxCrashtappen) July 21, 2023
Tesla Inc (TSLA) is another tell on the market. Bears and bulls avidly fight over this marquee maker of electronic vehicles (EVs), so I pay attention to the winning side. Right now, the bears are winning after TSLA fell 9.7% post-earnings. Since TSLA barely trades on fundamentals, it is anyone’s guess as to why traders and investors soured for this round. The more important dynamic is the ability of sellers to follow-through on Friday with a confirmed 20DMA breakdown. TSLA looks set for at least a test of last month’s low if not a full test of 50DMA support (the red line below). In the meantime, I cannot imagine an overbought stock market diverging too far away from TSLA sentiment.
")
Netflix, Inc has enjoyed a huge reawakening since getting clobbered in January and April of 2022 with major post-earnings collapses. While NFLX remains miles away from its stratospheric all-time high, the stock is up 157% from its May, 2022 low. That momentum may have come to an abrupt end last week as NFLX gapped down post-earnings for an 8.7% loss. The gap down “trapped” overeager buyers who piled into the stock just ahead of earnings. The gap down started BELOW the open of a 5.5% one day surge.
Sellers sealed the deal on Friday with follow-up selling and a 2.3% loss. NFLX now stares down a test of support converged between the the 50DMA and the June low.
")
Three months ago a post earnings warning plunge for CDW Corporation (CDW) appeared to confirm that a material slowdown in IT spending was underway. That day marked the intraday low for CDW. Last week, CDW essentially finished filling that gap. So now the question for people who follow fundamentals: was April an over-reaction or is this stair-step of a recovery a slow, simmering over-reaction? I do not have the answer, but I can say that these kinds of swings say a lot about how little the market can know or understand about a business. The technicals tell me that if CDW continues even higher from here, the scare is over. In the meantime, all three major moving averages are in uptrends and support the stock.
Tracking these kinds of sentiment swings from negative to positive/constructive can be more important than chasing the high-flyers and more interesting than worrying about bubbles and manias in various pockets of the market.
")
Caterpillar, Inc (CAT) was poised to break out to new all-time highs but failed over the past two days. This failure at key resistance is a big strike against my bullish short-term trading call. Earnings before the market opens on August 1st may need to provide the catalyst to push CAT over the top. Otherwise, I will assume CAT’s failure is also the market’s warning ahead of the Federal Reserve’s confab in Jackson Hole, Wyoming in late August. Stay tuned – coming to a theatre near you.
")
I am more actively watching the trading action in iShares US Home Construction ETF (ITB). Wall Street’s disappointment in good economic data on Thursday sent interest rates higher and a sharp pullback in the rate-sensitive housing sector. ITB fell 2.6% but remains in a well-defined uptrend. There is a funny irony in home builders selling off because of good economic data that supports the case for consumers having the wherewithal to keep buying the limited inventory of homes out there. It would also be absolutely poetic if the chase for the outperformance in the builders punctuated the top for this cycle.
")
")
")
Be careful out there!
Footnotes
Subscribe for free to get email notifications of future posts!
“Above the 50” (AT50) uses the percentage of stocks trading above their respective 50-day moving averages (DMAs) to measure breadth in the stock market. Breadth defines the distribution of participation in a rally or sell-off. As a result, AT50 identifies extremes in market sentiment that are likely to reverse. Above the 50 is my alternative name for “MMFI” which is a symbol TradingView.com and other chart vendors use for this breadth indicator. Learn more about AT50 on my Market Breadth Resource Page. AT200, or MMTH, measures the percentage of stocks trading above their respective 200DMAs.
Active AT50 (MMFI) periods: Day #79 over 20%, Day #53 over 30%, Day #50 over 40%, Day #36 over 50%, Day #11 over 60%, Day #8 over 70% (overbought)
Source for charts unless otherwise noted: TradingView.com
Full disclosure: long TSLQ, long AAPL call ratio spread, long ITB
FOLLOW Dr. Duru’s commentary on financial markets via StockTwits, Twitter, and even Instagram!
*Charting notes: Stock prices are not adjusted for dividends. Candlestick charts use hollow bodies: open candles indicate a close higher than the open, filled candles indicate an open higher than the close.