Stock Market Commentary:
The U.S.’s looming debt ceiling crisis is a manufactured emergency. The whole political wrangling could end in an instant with a very simple decision to keep budget negotiations in the budget process. Thus, the stock market’s relative calm about the political stalemate does not surprise me. Moreover, who are the motivated sellers left in the market anyway? There may even be eager buyers ready to jump into the market after the dust settles on the debt ceiling drama. If I am right, then this sleepy market has an explanation. Still, the NASDAQ is showing signs of ending the sleepwalking in the market. As big cap tech dominates trading, the NASDAQ as a whole is quietly breaking out.
The strong reactions to the debt ceiling crisis have come from buying not selling. At the start of the year both gold and Bitcoin soared. I identified the debt ceiling crisis as a likely motivating culprit. So it is interesting to see crypto struggling and potentially topping out over the last two months just ahead of the presumed June 1st default of the U.S. Gold has also lost its momentum over the last month and potentially topped out. These signs of exhaustion further support the market’s growing comfort with the prospect of an eventual resolution. Of course, if the U.S. DOES default on its debt, then all bets are off!
The Stock Market Indices
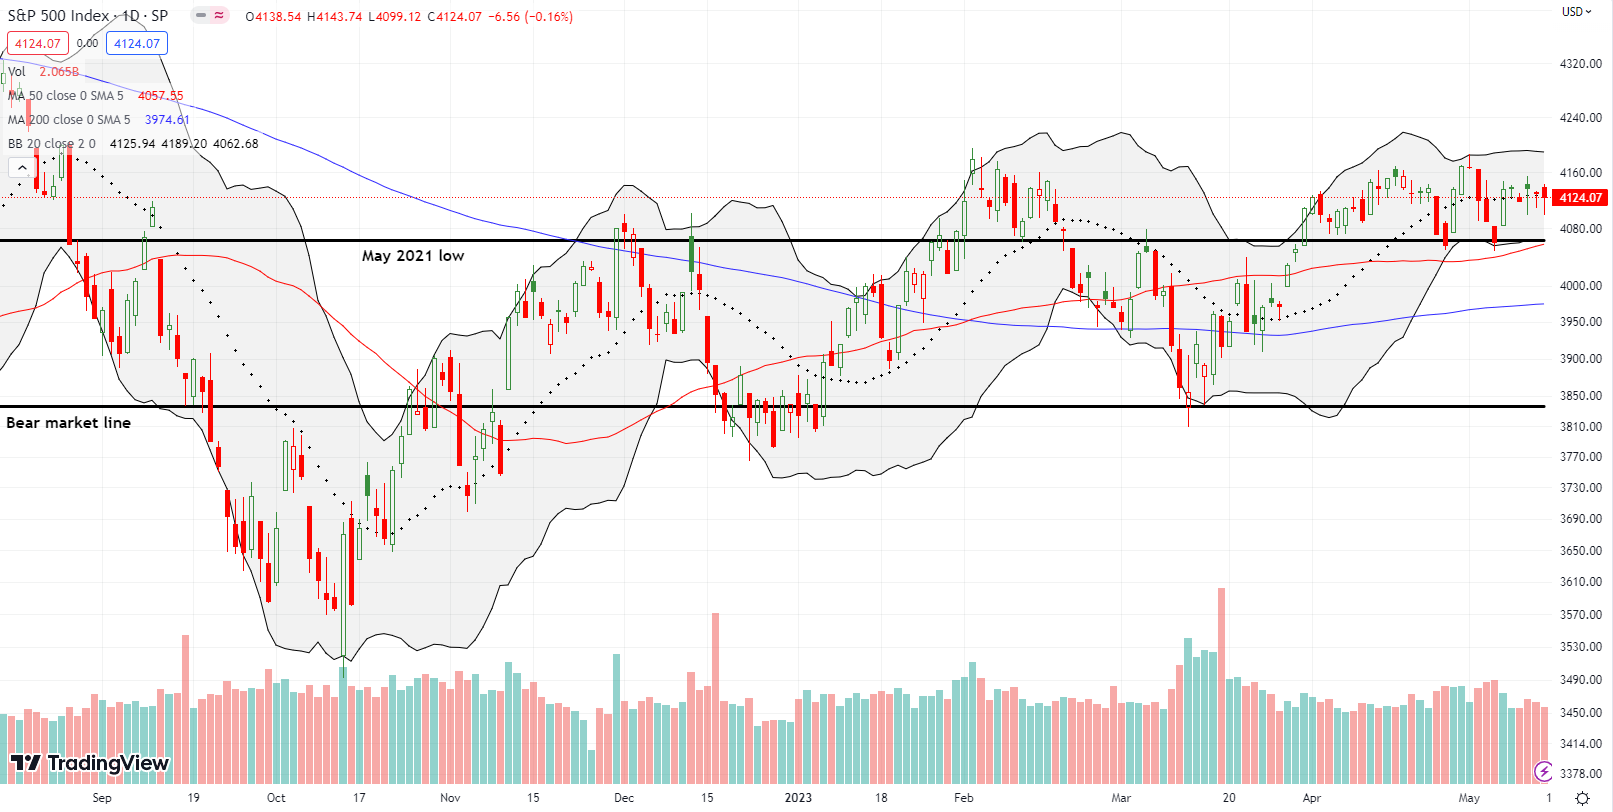
The sleepy S&P 500 (SPY) was essentially flatline for the week. The 20-day moving average (DMA) served as the perfect pivot point as buyers and sellers drowsily drifted around.
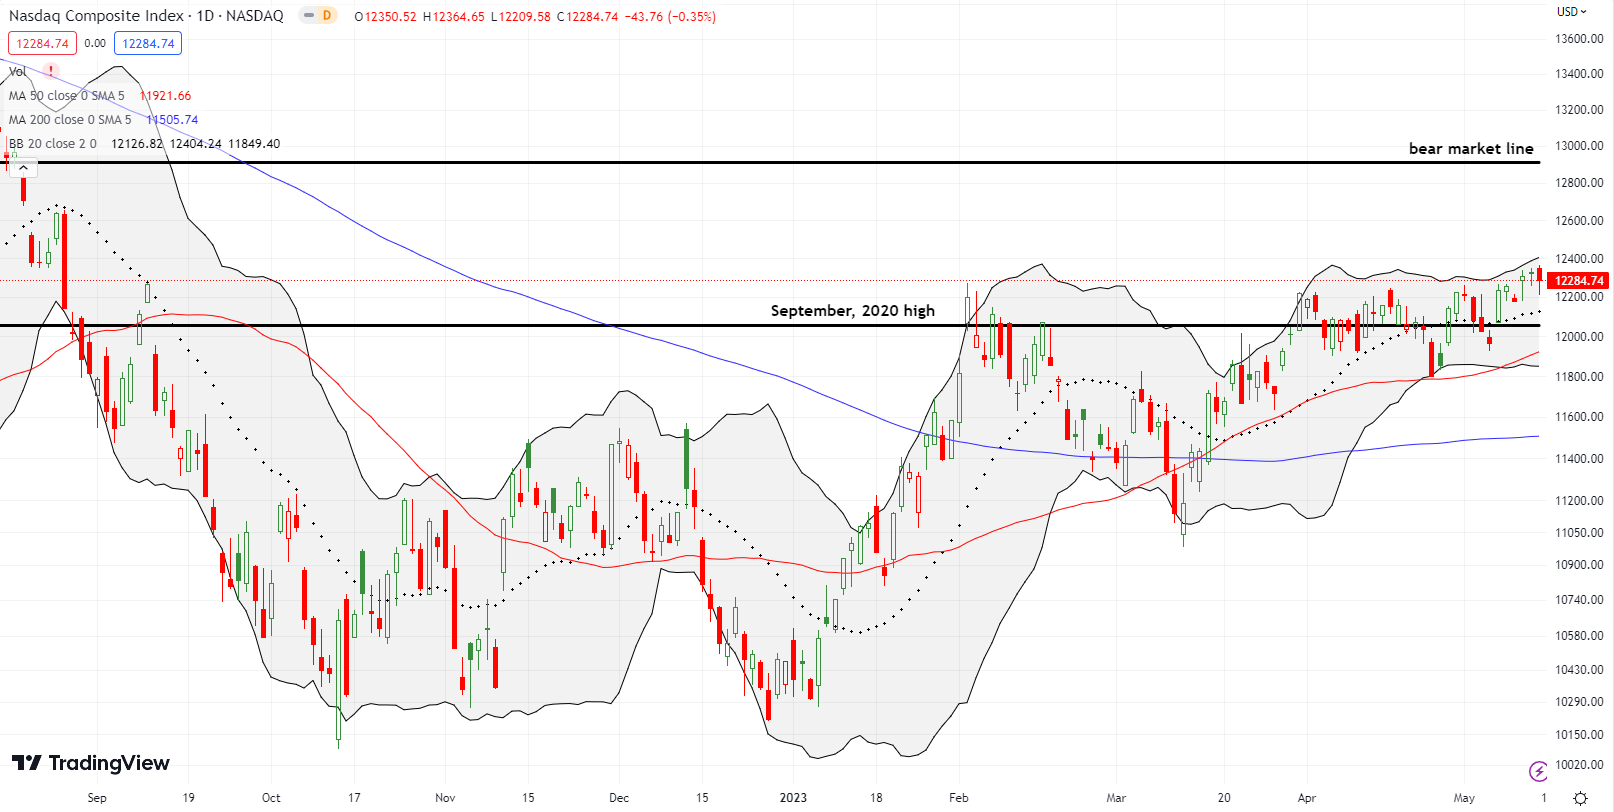
The NASDAQ (COMPQ) managed a marginal breakout thanks to Apple (AAPL) a week ago. Last week’s trading featured a quiet drift upward. While the net result was only a 0.4% gain, the move still confirmed the breakout. The recent trading even bent the 20DMA upward again. If the NASDAQ gains enough momentum, it could wake up the rest of the sleepy stock market.
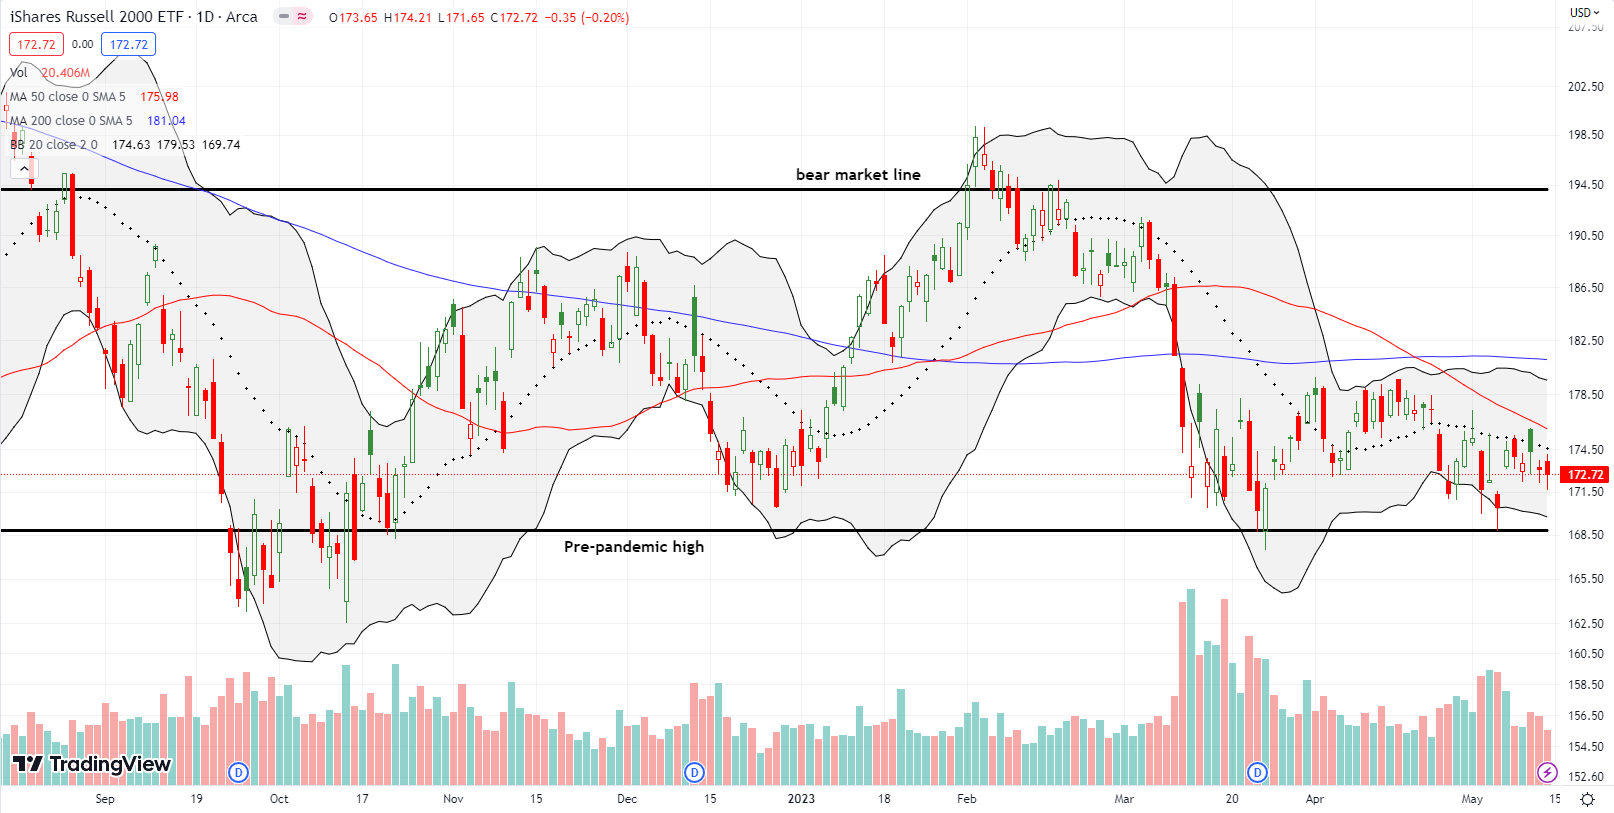
The iShares Russell 2000 ETF (IWM) continues to struggle. Its 20DMA and 50DMA (the red line) are trending downward. A quiet drift downward dragged IWM into a net 1.0% loss for the week. Sellers seem to be targeting a fresh test of the pre-pandemic high.
Stock Market Volatility
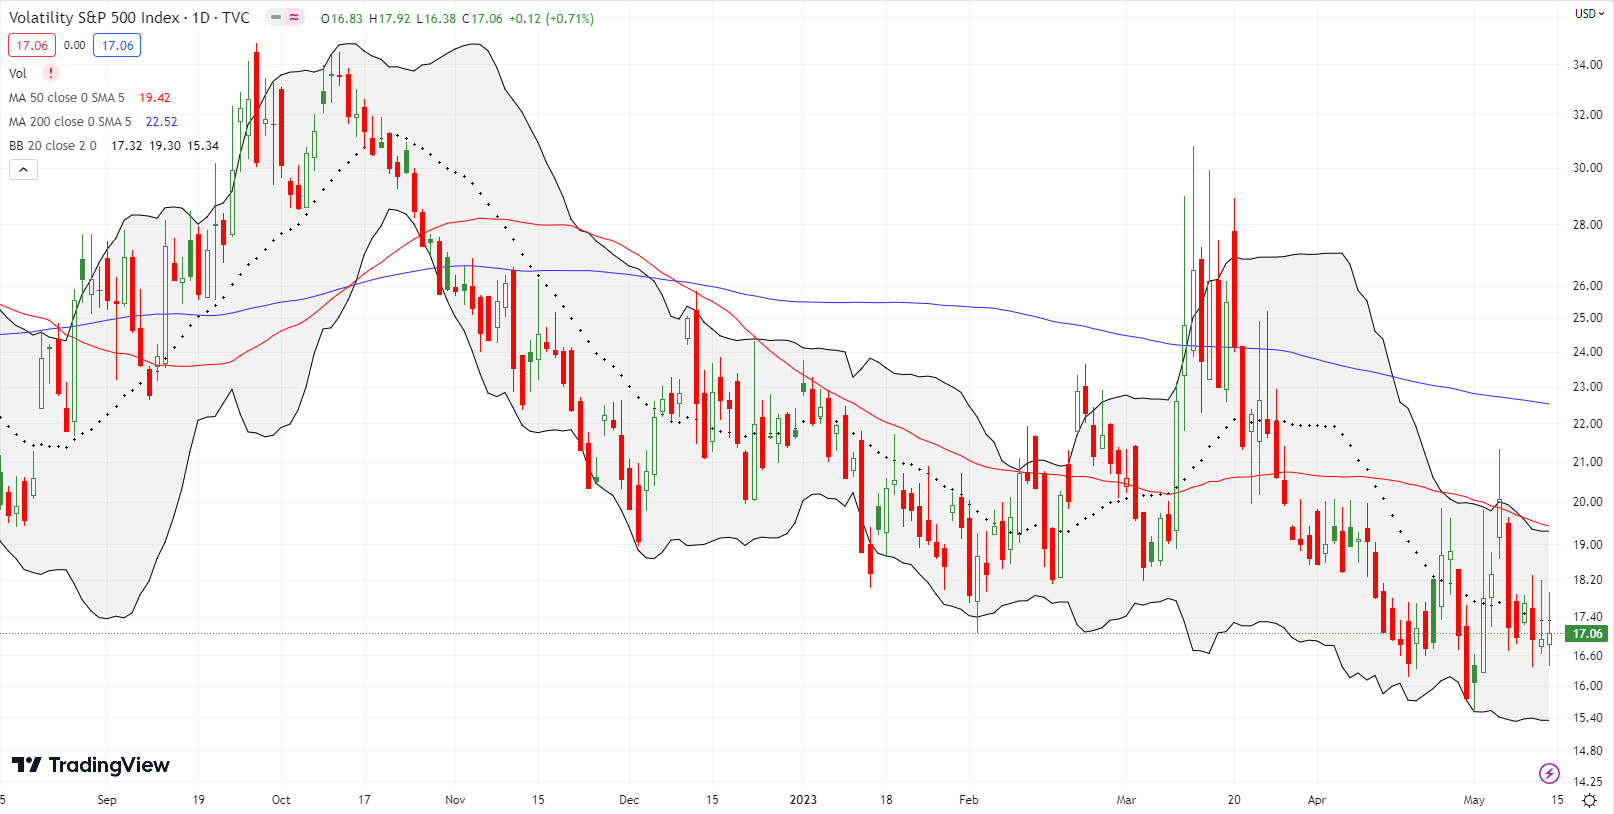
The volatility index (VIX) ended the week holding the line around the 17 level. This resilience belies the ability for the NASDAQ to breakout and the lackluster trading in the S&P 500. Perhaps the slight weakness in IWM was enough to hold the line on complacency. While the VIX seems dysfunctional day-to-day, I still expect the VIX to have a strong response to the debt ceiling resolution, whether up or down. The VIX’s dysfunctional partner, iPath Series B S&P 500 VIX Short-Term Futures ETN (VXX), drifted lower all week. I closed out some VXX put options and generated my first such profits after deciding to implement a fade strategy for VXX.
The Short-Term Trading Call With A Sleepy Market
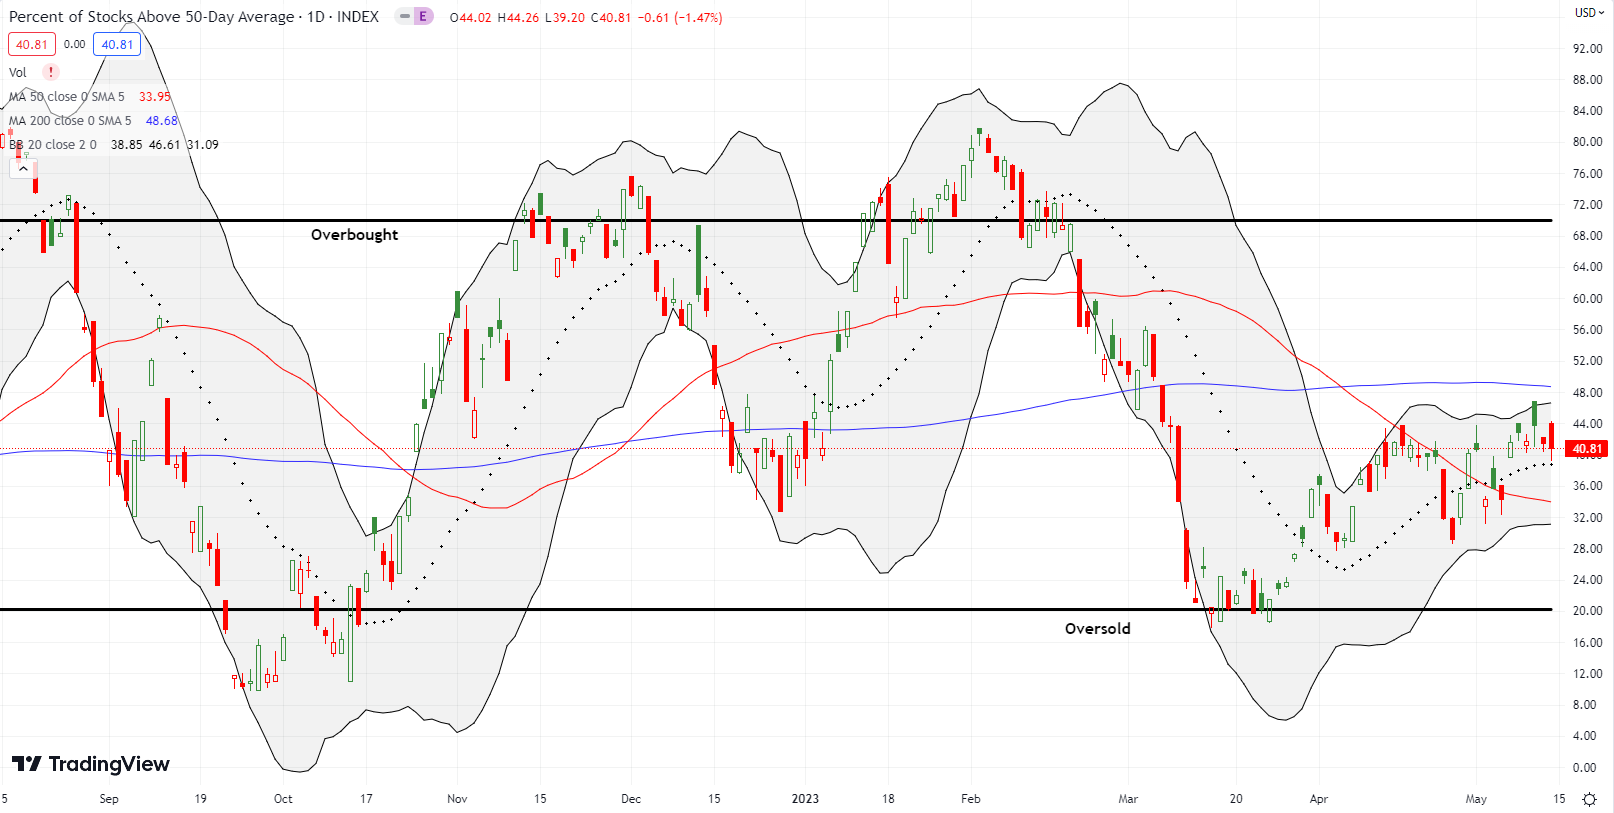
- AT50 (MMFI) = 40.8% of stocks are trading above their respective 50-day moving averages
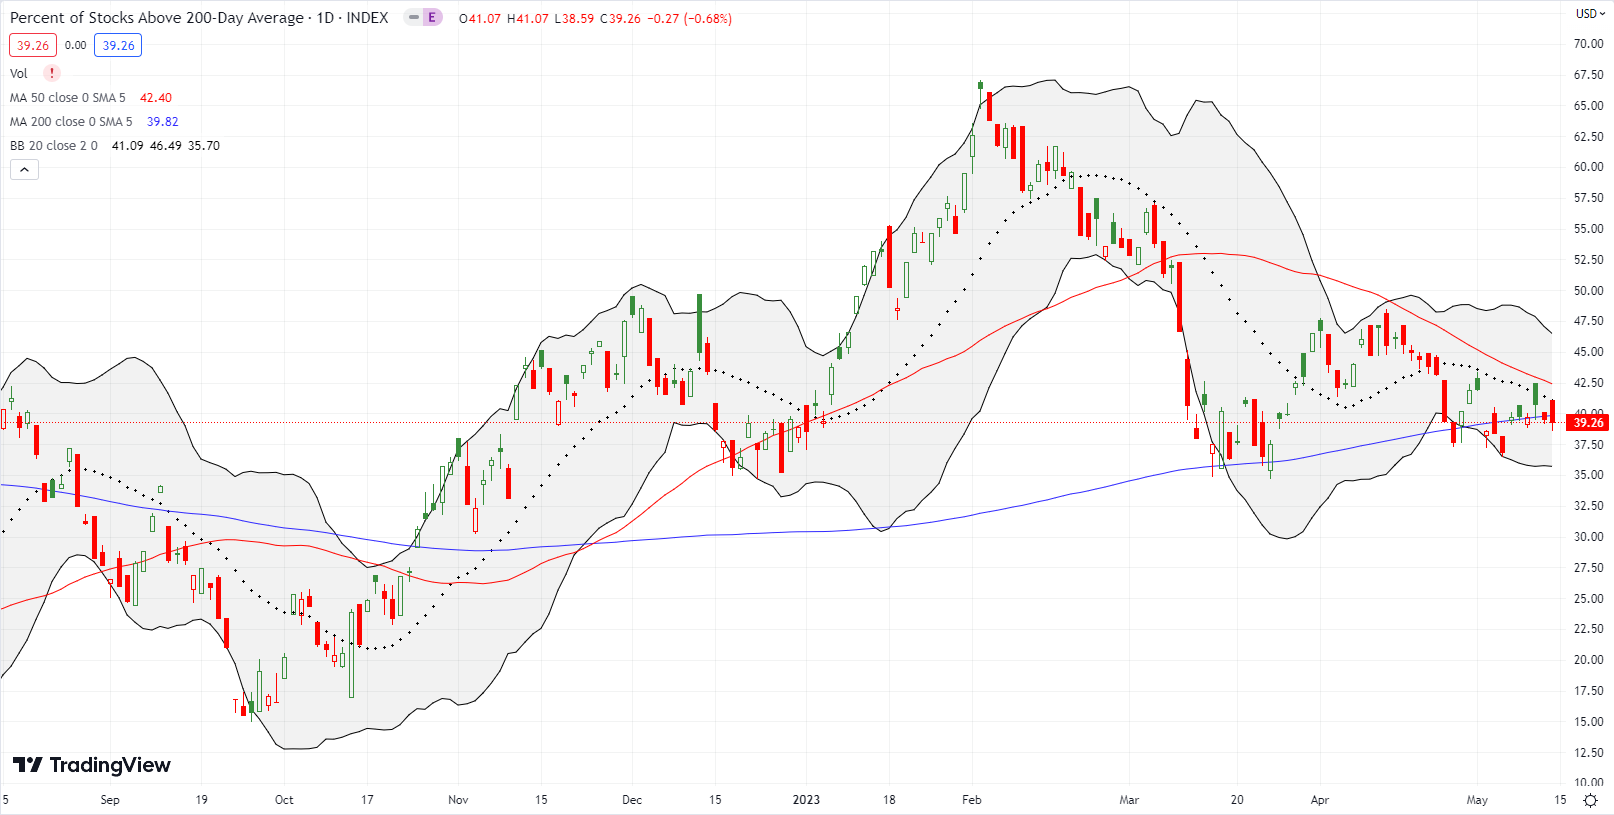
- AT200 (MMTH) = 39.3% of stocks are trading above their respective 200-day moving averages
- Short-term Trading Call: neutral
AT50 (MMFI), the percentage of stocks trading above their respective 50DMAs, closed the week at 40.8%. Market breadth enjoyed a small breakout in the middle of the week as IWM experienced a brief spurt of buying. At that point, my favorite technical indicator hit a 2-month high. Yet, breadth failed to expand from there as IWM gapped back down and ended the week on a poor note. If the NASDAQ continues to diverge from IWM, I do not expect AT50 to go higher.
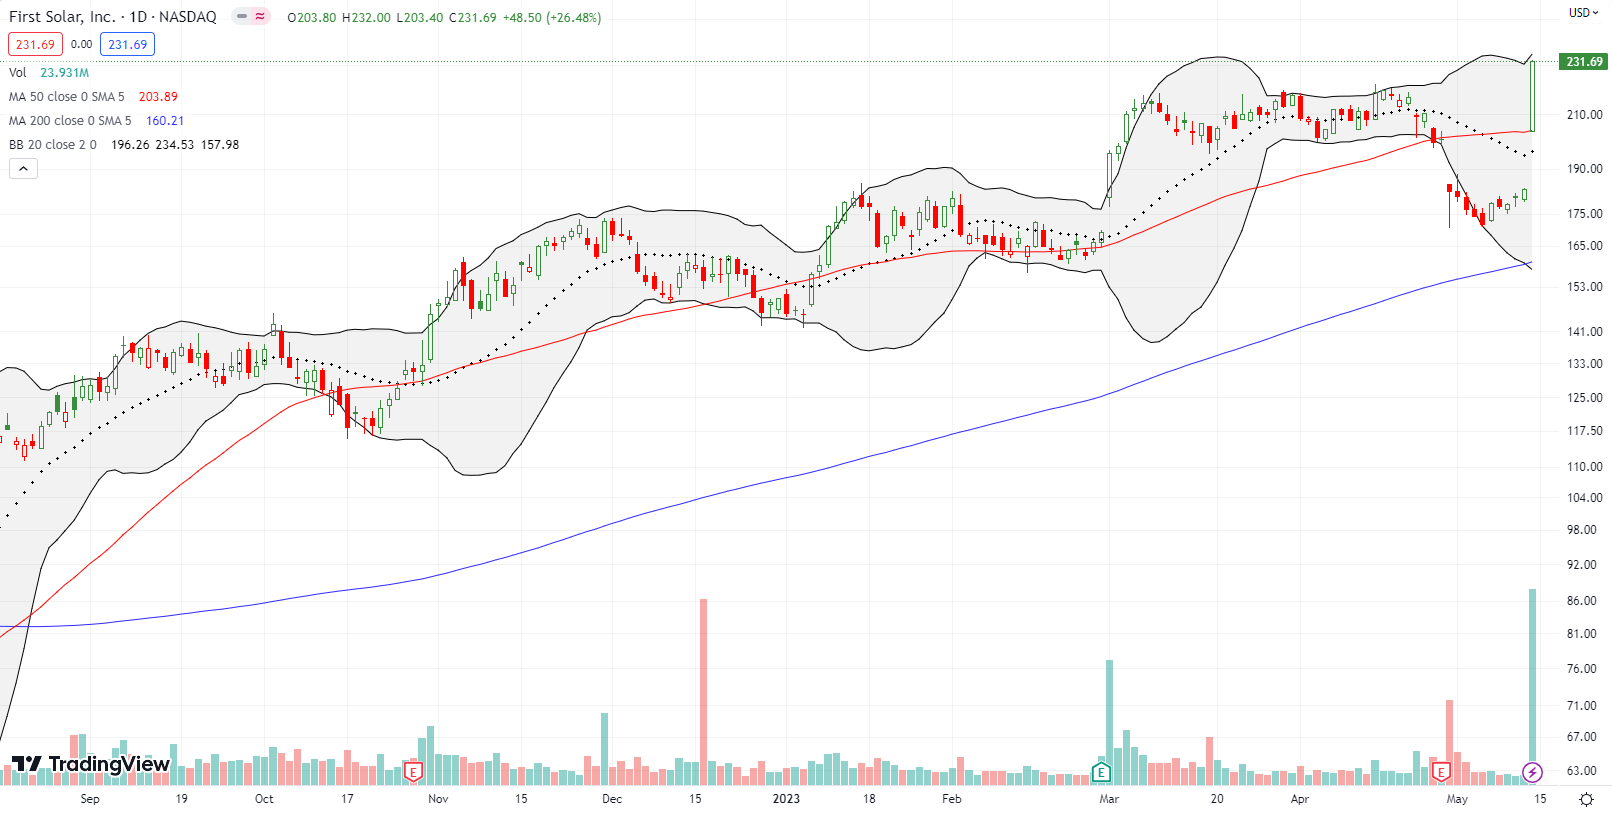
This sleepy market means that individual stock stories take on even greater prominence. First Solar, Inc (FSLR) is a great case in point. At the end of April, FSLR gapped down below its 50DMA for a 9.1% post-earnings loss. The decline looked like the end of the rally. Everything changed in a flash after FSLR announced the acquisition of thin-film maker Evolar. I do not understand why the market would react so dramatically, especially after the negative post-earnings reaction. I DO feel silly missing this entire rally as I used to follow FSLR closely years ago. It remains my favorite solar stock.
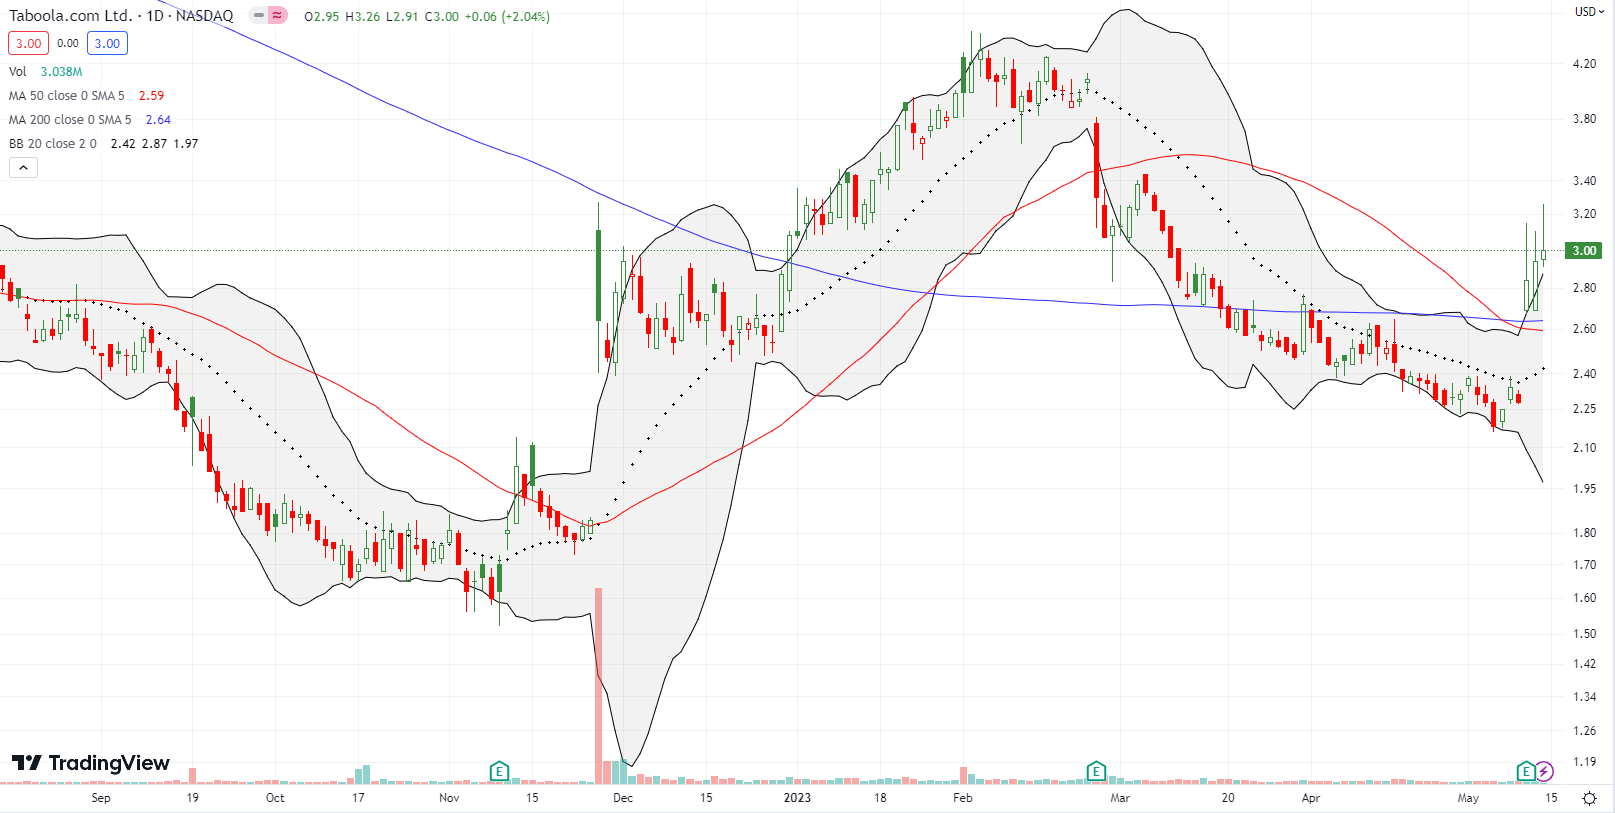
Following Taboola.com Ltd (TBLA) closely helped motivate me to jump into the stock after a major post-earnings breakout. However, I was compelled to take profits on Friday when the stock surged above its upper Bollinger Band (BB) for the third straight day. The price action is stretched. The fades from intraday highs are signs of growing buyer exhaustion. TBLA is a buy on the dips with converged support at the 50 and 200DMAs.
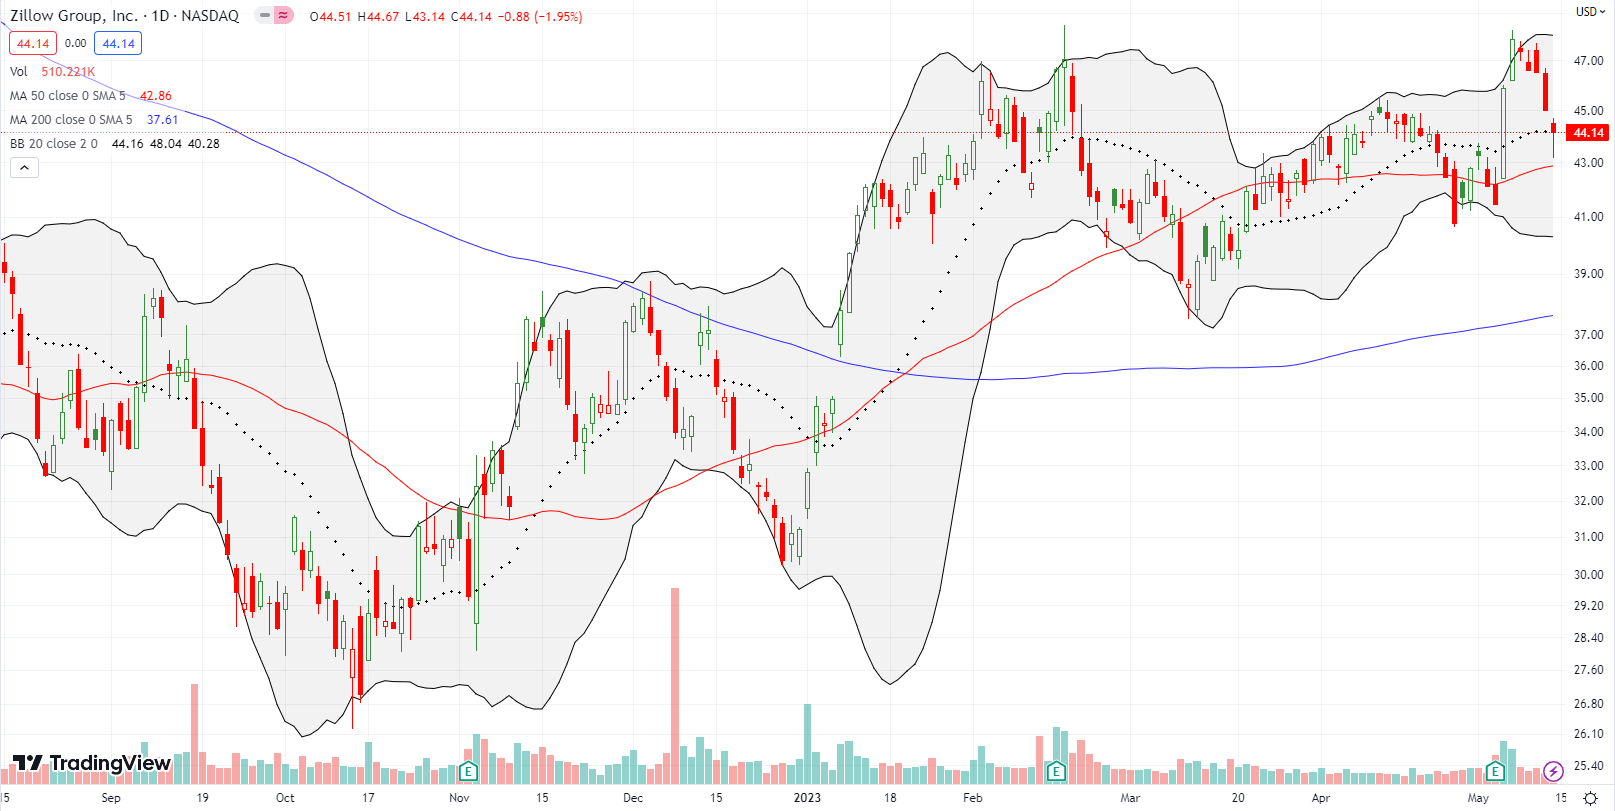
Zillow Group, Inc (ZG) is delivering some buyer’s remorse. After follow-through buying seemed to confirm a 10.6% post-earnings surge, ZG is now in reverse. ZG sold off all week until buyers stepped in just above 50DMA support. The bounce produced a hammer like bottoming pattern. While ZG is at risk for reversing the rest of its post-earnings gains, the stock is a buy here with a stop below the 50DMA.
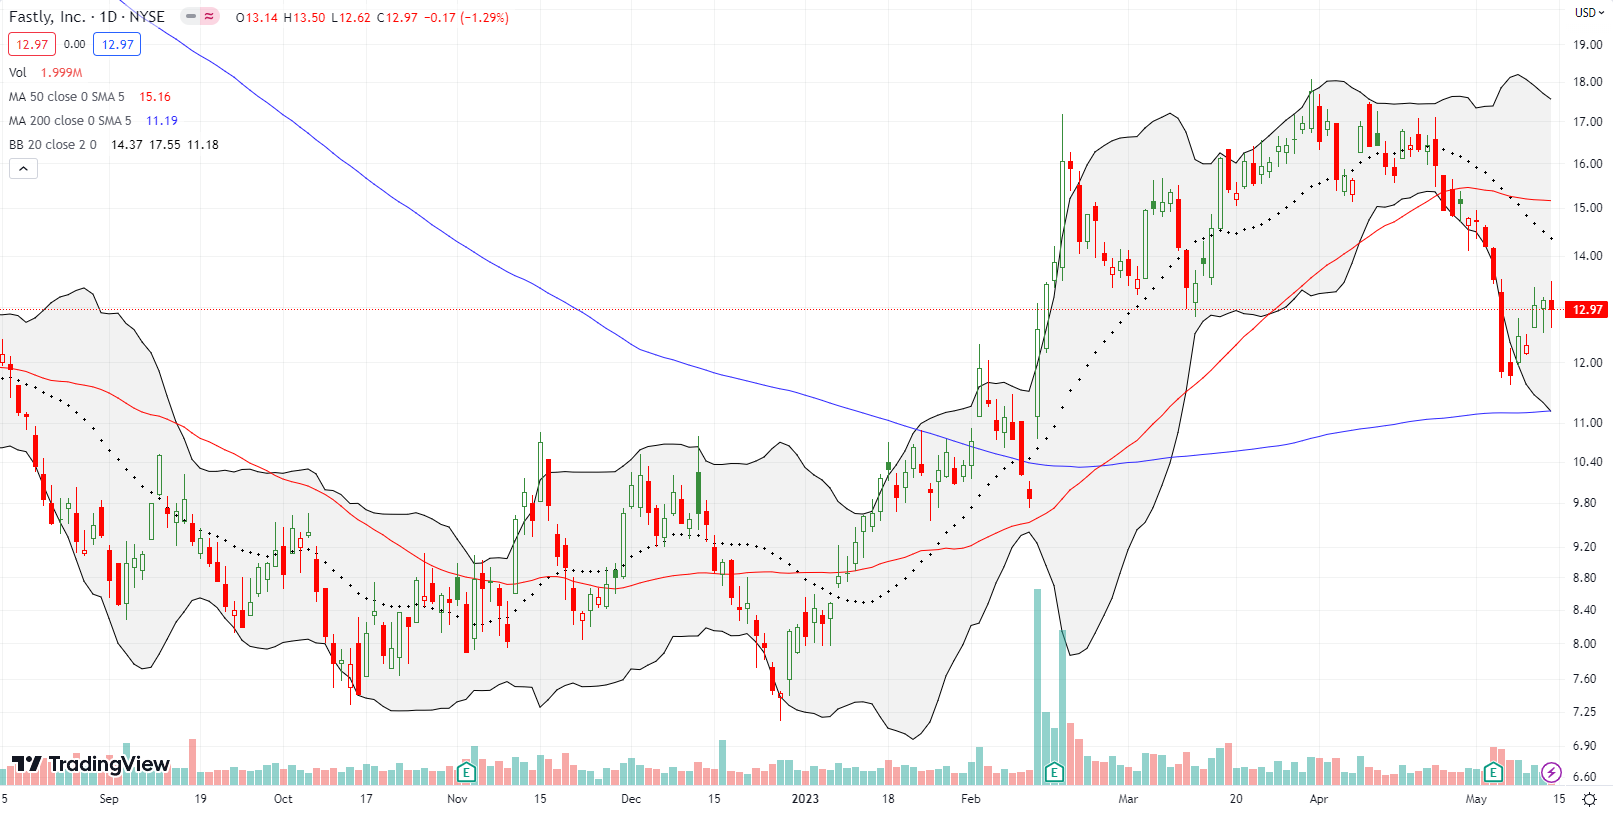
Fastly Inc (FSLY) created fresh excitement after a post-earnings surge in February. Buyers rushed into FSLY going into February earnings, and they were rewarded with a 15.8% gain. The inevitable pullback from the parabolic run-up did not prevent FSLY from eventually making fresh highs. However, sellers took over from there and controlled the action going into the latest earnings. Suddenly, investors changed their collective minds about FSLY and generated a 12.4% loss that finished reversing the February breakout. I doubt FSLY can generate enough momentum to break through overhead 50DMA resistance without first a successful test of 200DMA support. FSLY is one of many stocks I see where traders and investors cannot seem to make up their mind on whether the company is performing well or poorly from earnings to earnings.
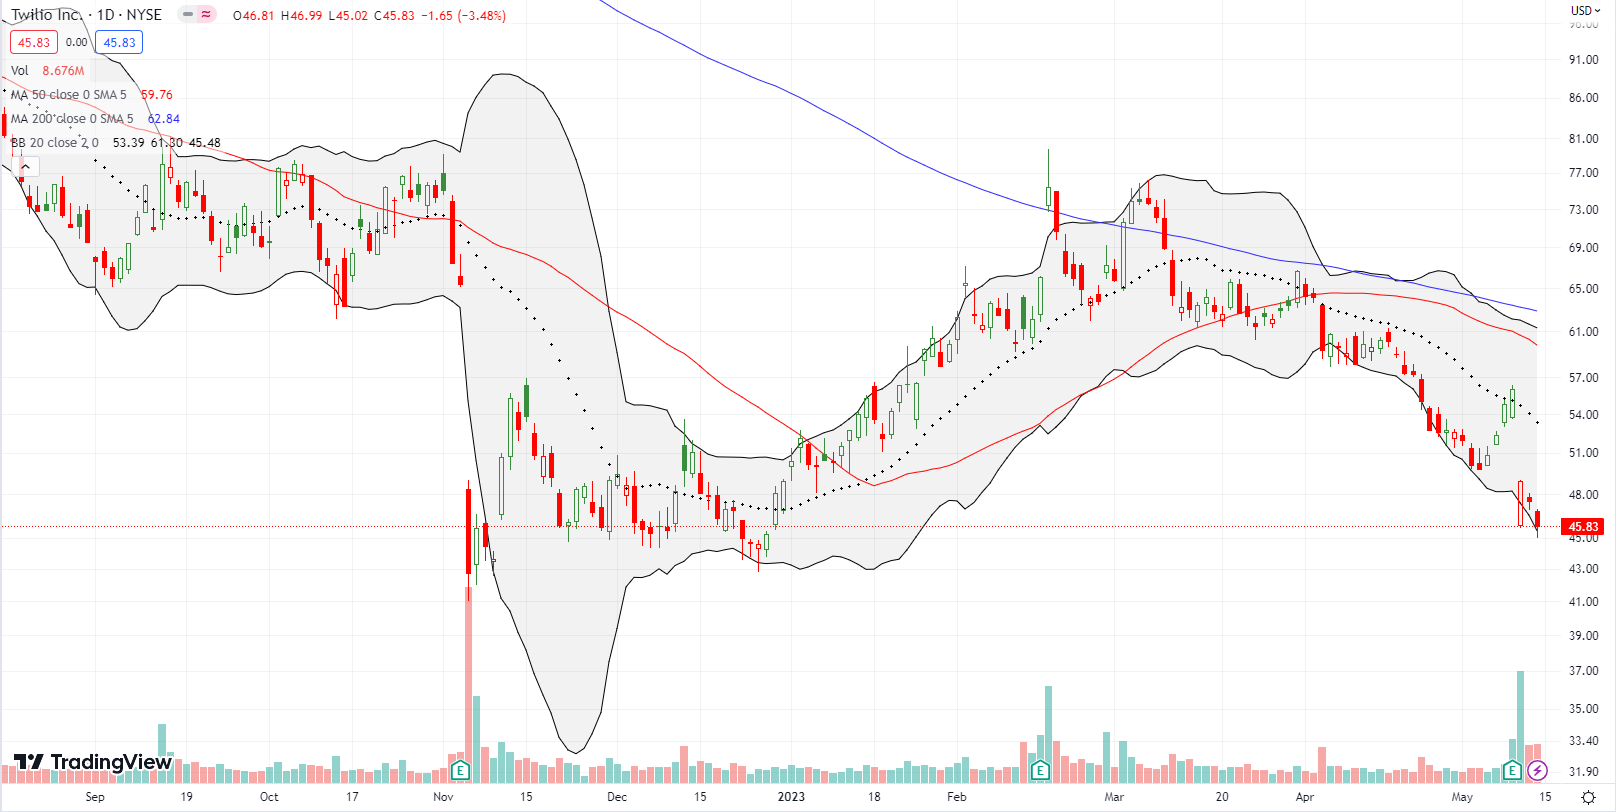
Speaking of flipping from earnings to earnings, Twilio Inc (TWLO) flipped back to disaster last week. TWLO last peaked following February earnings. The reversal of the November earnings loss combined with a 200DMA breakout and the announcement of a large buyback gave the impression of a stock on the mend. So when TWLO slid back to 20DMA support and then 50DMA support, I hopped aboard. The trades were mostly for naught. TWLO lost 12.6% post-earnings last week, and sellers pressed their bets the next two days. TWLO is at a 2023 low and almost looks set to retest its November lows.
Be careful out there!
Footnotes
Subscribe for free to get email notifications of future posts!
“Above the 50” (AT50) uses the percentage of stocks trading above their respective 50-day moving averages (DMAs) to measure breadth in the stock market. Breadth defines the distribution of participation in a rally or sell-off. As a result, AT50 identifies extremes in market sentiment that are likely to reverse. Above the 50 is my alternative name for “MMFI” which is a symbol TradingView.com and other chart vendors use for this breadth indicator. Learn more about AT50 on my Market Breadth Resource Page. AT200, or MMTH, measures the percentage of stocks trading above their respective 200DMAs.
Active AT50 (MMFI) periods: Day #35 over 20%, Day #9 over 30%, Day #6 over 40%, Day #48 under 50%, Day 58 under 60%, Day #60 under 70%
Source for charts unless otherwise noted: TradingView.com
Full disclosure: long QQQ put spread; long SPY put spread, long VXX call spread, put spread
FOLLOW Dr. Duru’s commentary on financial markets via StockTwits, Twitter, and even Instagram!
*Charting notes: Stock prices are not adjusted for dividends. Candlestick charts use hollow bodies: open candles indicate a close higher than the open, filled candles indicate an open higher than the close.


