

Housing Market Intro and Summary
May’s housing market was remarkably strong and represented the peak velocity of the spring selling season. June followed up with more relative strength but a slight sequential cooling as mortgage rates continued a march back to the top of the recent range. Housing starts, new home sales, and existing home sales for June all declined slightly from May. Builder sentiment increased slightly from June to July with mixed underlying changes in components and regions. Still, with consumer sentiment soaring, housing data should remain resilient in the coming months.
Housing Stocks
The primary uptrend in the iShares US Home Construction ETF (ITB) was challenged in early July but resumed quickly. A second sharp pullback lasted just one day. The persistent accumulation of shares in home builders reflects strong investor sentiment in this sector. ITB continues to out-perform the S&P 500 (SPY) with a 46.7% year-to-date gain. The S&P 500 is up 19.3% year-to-date. Home builders are even outpacing high-flying tech stocks with the NASDAQ (COMPQ) up 36.8% for the year.
")
I do not expect ITB to continue higher at this same pace. It may even flatten to decline going into the year’s most dangerous months which proceed the start of seasonal strength for home builders. Divergent performances in the July post-earnings behavior of the stocks of home builders are providing the first glimpse into slowing performance expectations. Here are the 1-day post-earnings performances of eight home builders starting with the strongest and ending with the weakest:
- Beazer Homes USA Inc (BZH): +27.7%
- Meritage Homes Corporation (MTH): +8.7%
- PulteGroup Inc (PHM): +6.2%
- Century Communities, Inc (CCS): +4.2%
- NVR, Inc: +2.1%
- DR Horton Inc (DHI): -1.9%
- Taylor Morrison Home Corporation (TMHC): -4.6%
- Tri Pointe Homes, Inc (TPH): -8.1%
I will be looking closer at key findings and statements from builders. In the meantime, the message of the market tells me to temper expectations in the coming weeks and months.
Here are the daily stock charts for most of these builders for some perspective. The “E” at the bottom of each chart shows where the company reported earnings.
")
")
")
")
")
")
TPH in particular looks like it is breaking down given it ended both its 20-day moving average (DMA) (the dashed line) and 50DMA (the red line) uptrends. TPH is also down for July. Assuming the decline holds one more day, this would be TPH’s first down month since last year’s bottom.
Housing Data
New Residential Construction (Single-Family Housing Starts) – June, 2023
Given May’s surge in housing starts, June’s cooling in starts looks unsurprising. Housing starts dropped 7.0% month-over-month to 935,000. Starts decreased 7.4% year-over-year. May’s starts were revised upward to 1,005,000. June’s decline makes me wonder whether 1M will turn out to be a ceiling on starts until the cycle begins to prepare for the 2024 spring selling season.
![US. Bureau of the Census, Privately Owned Housing Starts: 1-Unit Structures [HOUST1F], first retrieved from FRED, Federal Reserve Bank of St. Louis, July 23, 2023](https://drduru.com/onetwentytwo/wp-content/uploads/2023/07/20230723_Housing-Starts.png "Housing starts")
The June decline in building permits did not put a dent in the on-going uptrend in permits. I previously assumed that the steady uptrend would support on-going monthly increases in starts. June’s divergence is a puzzle but it is very possible earlier permits are moving slower through the system than usual. In February, these permits ended a year-long downtrend. Permits in June generated a fourth consecutive monthly increase with a 2.2% gain (May’s monthly gain was revised upward to 5.4%).
The northeast was the only region with a year-over-year increase in single-family starts. The West was the only region with a month-over-month increase in starts. Housing starts in the Northeast, Midwest, South, and West each changed +6.1%, -20.7%, -7.3%, -1.9% respectively year-over-year.
Existing Home Sales – June, 2023
The dynamic in existing home sales of price increases despite sales declines highlights the dilemma, even paradox, of the Federal Reserve’s effort to contain inflation by hiking interest rates. Inventory of existing homes fails to respond because existing owners do not want to lose their low mortgage rates while on-going demand is supported by a resilient labor market. The resulting price increases are happening amid a scramble for the limited inventory. The National Association of Realtors (NAR) observed:
“Home sales fell but home prices have held firm in most parts of the country…The national median home price in June was slightly less than the record high of nearly $414,000 in June of last year. Limited supply is still leading to multiple-offer situations, with one-third of homes getting sold above the list price in the latest month.”
The seasonally adjusted annualized sales in June of 4.16M decreased 3.3% month-over-month from the 4.30M in existing sales for May (unrevised). Year-over-year sales decreased 18.9%. The resumption of the downtrend suddenly throws my expectation of stabilization into doubt.

(For historical data from 1999 to 2014, click here. For historical data from 2014 to 2018, click here) Source for chart: National Association of Realtors, Existing Home Sales© [EXHOSLUSM495S], retrieved from FRED, Federal Reserve Bank of St. Louis, July 24, 2023

Inventory stayed above the 1 million mark but did not budge from May’s level. June’s absolute inventory of 1.08M homes remained flat with May and decreased 13.6% year-over-year, double the rate from May. According to the NAR, “unsold inventory sits at a 3.1-month supply at the current sales pace, up from 3.0 months in May and 2.9 months in June 2022.” The spring selling season never generated enough inventory to loosen the market for existing homes.
The market continues to exhibit significant demand pressures despite the falling sales. Homes stayed on the market for the same 18 days in May. The good news for buyers is that flat month-over-month performance ends a downward streak that started in March. The 76% of homes that sold within a month is up from the 74% in May and 73% in April. The upward trend in this metric continues apace.
The median sales price increased for a fifth straight month. The price pressures are consistent with the generally faster pace of sales. The median price of an existing home increased 3.5% month-over-month to $410,200 while decreasing 0.9% year-over-year from the record high. The year-over-year decline in February ended a record streak of 131 straight months of year-over-year increases. The new year-over-year downward streak looks like it is already coming to an end given the persistent sequential price gains.
The share of sales to first-time home buyers decreased to 27% from 28% in May and 30% a year ago. First-timers were previously staying resilient despite affordability issues, but perhaps the end of the spring selling season has also seen the exit of the most motivated buyers. The NAR’s 2017 Profile of Home Buyers and Sellers reported an average of 34% for 2017, 33% for 2018, 33% for 2019, 31% for 2020, 34% for 2021, and 26% for 2022. The first-time buyer share for 2022 is the lowest on record for the NAR and the current trend points to that record breaking again.
All regions declined significantly in sales year-over-year. While the South and the West managed to log sales gains from April to May, they were the only two regions to decline from May to June. The regional year-over-year changes were: Northeast -21.5%, Midwest -19.5%, South -16.2%, West -22.7%.
Once again the regions were mixed in the pace of year-over-year price changes. The West was the first region to flip negative in January, and the West has continued to decline. In May, the South joined the West in price declines and joined the West again in June. The regional year-over-year price changes were as follows: Northeast +4.9%, Midwest +2.1%, South -1.2%, West -3.4%.
Single-family existing home sales decreased 3.4% from May and declined on a yearly basis by 18.8%. The median price of $416,000 was down 1.2% year-over-year and up 3.6% month-over-month for single-family existing home sales.
California Existing Home Sales – June, 2023
The California Association of Realtors (CAR) used the theme of stabilization to discuss California’s market for existing homes. The CAR pointed to deceleration in the pace of year-over-year sales declines (helped by base effects) and year-over-year price drops. The median sales price is at a 10-month high.
Sales in June declined 4.1% from May and 19.7% year-over-year to 289,460. June’s median home price increased 0.3% from May to remain over $800,000 for the third month in a row. The median price is still down 2.4% year-over-year. The month-over-month price on a square footage basis increased from $409 to $414 (a 1.2% increase) and fell from $423 a year ago.
The Unsold Inventory Index (UII) fell 8.3% year-over-year and increased 4.3% month-over-month. The inventory changes varied widely by price ranges with the year-over-year UII declines below the $1M selling price showing the crush for more affordability with the surge in mortgage rates. UUI was relatively stable across the board from May to June. The CAR reported: “The mid-price segment of $750,000-$999,000 recorded the biggest year-over-year decline of -16 percent in unsold inventory index, followed by the $500,000-$749,000 price range (-12.5 percent) and the sub-$500,000 (-11.5 percent). The UII inched up slightly in the three price ranges in June, primarily due to weaker sales. The UII for the $1 million price segment was unchanged month-to-month and year-over-year.”
Active listings still look like they have bottomed even with the year-over-year plunge of 34%.

Source: Realtor.com, Housing Inventory: Active Listing Count in California [ACTLISCOUCA], retrieved from FRED, Federal Reserve Bank of St. Louis; July 30, 2023.
The fresh competitiveness in the market can be seen from the 15-day average time to sell a home, down 2 days from May and 5 days from April. Time to sell was 14 days a year ago. The statewide sales-price-to-list-price ratio stayed flat for the second month in a row at 100.0%.
New Residential Sales (Single-Family) – June, 2023
New home sales crushed expectations by almost 100,000 in May. In June, the year-over-year gains continued with a 23.8% jump versus a 2.5% decline from May’s new home sales. May’s 763,000 sales were revised downward to 715,000. The comparables are still easier given the trough a year ago. The on-going uptrend from the July, 2022 bottom stands as a testament to the sales pivots builders collectively accomplished in the face of rapidly increasing mortgage rates. With rates steadily creeping back to the 7% level, the high-end of the presumed range of stabilization, I suspect new home sales will flatten out for the near-term.
![US. Bureau of the Census, New One Family Houses Sold: United States [HSN1F], first retrieved from FRED, Federal Reserve Bank of St. Louis, July 30, 2023.](https://drduru.com/onetwentytwo/wp-content/uploads/2023/07/20230730_New-Home-Sales.png "new home sales")
The median price nudged downward 0.5% from May to 415,400, a 4.0% year-over-year decrease (and just the third such decline of the housing recession). Prices have significantly cooled from the mania of the pandemic housing bubble and buyers are shifting to lower-priced homes to deal with today’s higher rates.
Builders are accommodating the demand with smaller homes which also puts mix-driven pressure on pricing. While the mix of sales shifted to higher priced homes on a sequential basis, the mix continues to shift significantly downward compared to a year ago. A year ago, 43% of sales occurred at $399,000 or below. For June that mix nudged higher to 44%. However, the highest price tier surged from 6 to 12% of sales thanks to a sharp decline in share from the $500,00 to $749,000 range. I suspect the year-over-year surge of sales in the West had an outsized influence on the price mix.
The inventory for new homes jumped to 7.4 months of sales from 6.7 in May. While the market remains above the 6.0 level characteristic of a balanced market, absolute inventories only increased slightly from 428,000 to 432,000.
The Midwest was the only region to lose sales year-over-year. The other three regions surged over 20% with the Northeast in triple digits for the second straight month. The Northeast, Midwest, South, and the West changed 141.2%, -13.1%, +21.4%, and +34.9% respectively.
Home Builder Confidence: The Housing Market Index – July, 2023
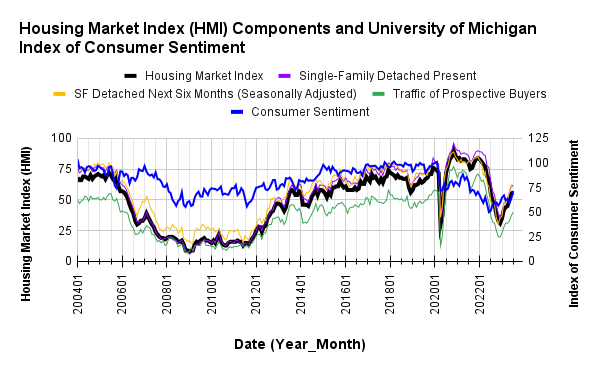
The relentless rebound in builder confidence continued in July. In June, the National Association of Home Builders (NAHB)/Wells Fargo Housing Market Index (HMI) entered positive sentiment territory (over 50) for the first time in almost a year. HMI increased from 55 in June to 56 in July, a 13-month high.
In June, the NAHB offered potential inflation-fighting remedies for housing markets. The industry group addressed inflation again in its latest report: “Given that shelter inflation accounts for roughly 40% of the Consumer Price Index, the best way to ease this largest source of inflationary pressure is to build additional for-rent and for-sale housing. There has been some commentary linking gains for housing construction with increased concerns for additional inflation, but this has the economics backwards. More housing supply is good news for future shelter inflation readings in the market. Furthermore, higher interest rates increase the cost of financing for building homes and developing lots.”
/Wells Fargo Housing Market Index (HMI) and the University of Michigan Index of Consumer Sentiment")
(July, 2023)
Source for data: NAHB and the University of Michigan
The HMI bottomed 5 months after consumer sentiment. Earlier, I thought consumer sentiment had topped out and would cap HMI as well. Instead, HMI looks like it has helped pull consumer sentiment upward. July’s continued uptrend meets my expectation from the last Housing Market Review given the parallel trends at work. Soaring consumer sentiment implies the housing market should remain resilient.
Given the HMI only increased by a point, some components lost ground while others gained. The SF Detached Present and Traffic of Prospective Buyers gained 1 and 3 points respectively. The Single-Family – Next Six Months dropped 2 points but is still well within positive sentiment territory at the 60 level.
The regional HMIs were mixed. While the West joined the South and Northeast in positive sentiment territory, the Midwest took 2 steps back. The South also lost a point. The Northeast surged from 52 to 60. The Midwest decreased from 48 to 46. The South dropped from 60 to 59. The West jumped from 50 to 54.
Home closing thoughts
Is the Chase for Affordable Housing Pushing Too Many Americans into Disaster Prone Areas?
Many home buyers are scrambling to figure out how to afford housing. A Redfin (RDFN) report titled “Migration Into America’s Most Flood-Prone Areas Has More Than Doubled Since the Start of the Pandemic” described a disturbing trend that could deliver short-term benefits with larger long-term costs for households. Redfin reported three major migration trends induced by the pandemic:
- “The most flood-prone U.S. counties saw 384,000 more people move in than out in 2021 and 2022—a 103% increase from the prior two years, when 189,000 more people moved in than out.”
- “The counties with the highest wildfire risk saw 446,000 more people move in than out over the past two years, a 51% increase from 2019 and 2020.”
- “The counties with the highest heat risk saw 629,000 more people move in than out, a 17% uptick.”
Redfin points to the pandemic-related enablers of remote work and record low mortgage rates as drivers of these trends as people moved from expensive housing markets and into cheaper ones. It will be interesting to see whether the worsening affordability brought on by very high mortgage rates and resilient prices further reinforces the trends.
Spotlight on Mortgage Rates
The Mortgage Bankers Association (MBA) reported another year-over-year surge in mortgage applications (26.1%) for new homes in June. However, this was a 5% decrease from May’s lofty numbers. These numbers are not seasonally adjusted, but they underline the braking effect of mortgage rates creeping toward the 7% level. Given the Federal Reserve continues to hike rates, mortgage rates are likely to linger here at the top of the range.
![Source: Freddie Mac, 30-Year Fixed Rate Mortgage Average in the United States [MORTGAGE30US], retrieved from FRED, Federal Reserve Bank of St. Louis, March 31, 2023](https://drduru.com/onetwentytwo/wp-content/uploads/2023/03/20230331_30-Year-Fixed-Rate-Mortgage-Average-US.png)
Be careful out there!
Full disclosure: long ITB, short RDFN shares and long calls