
Stock Market Commentary
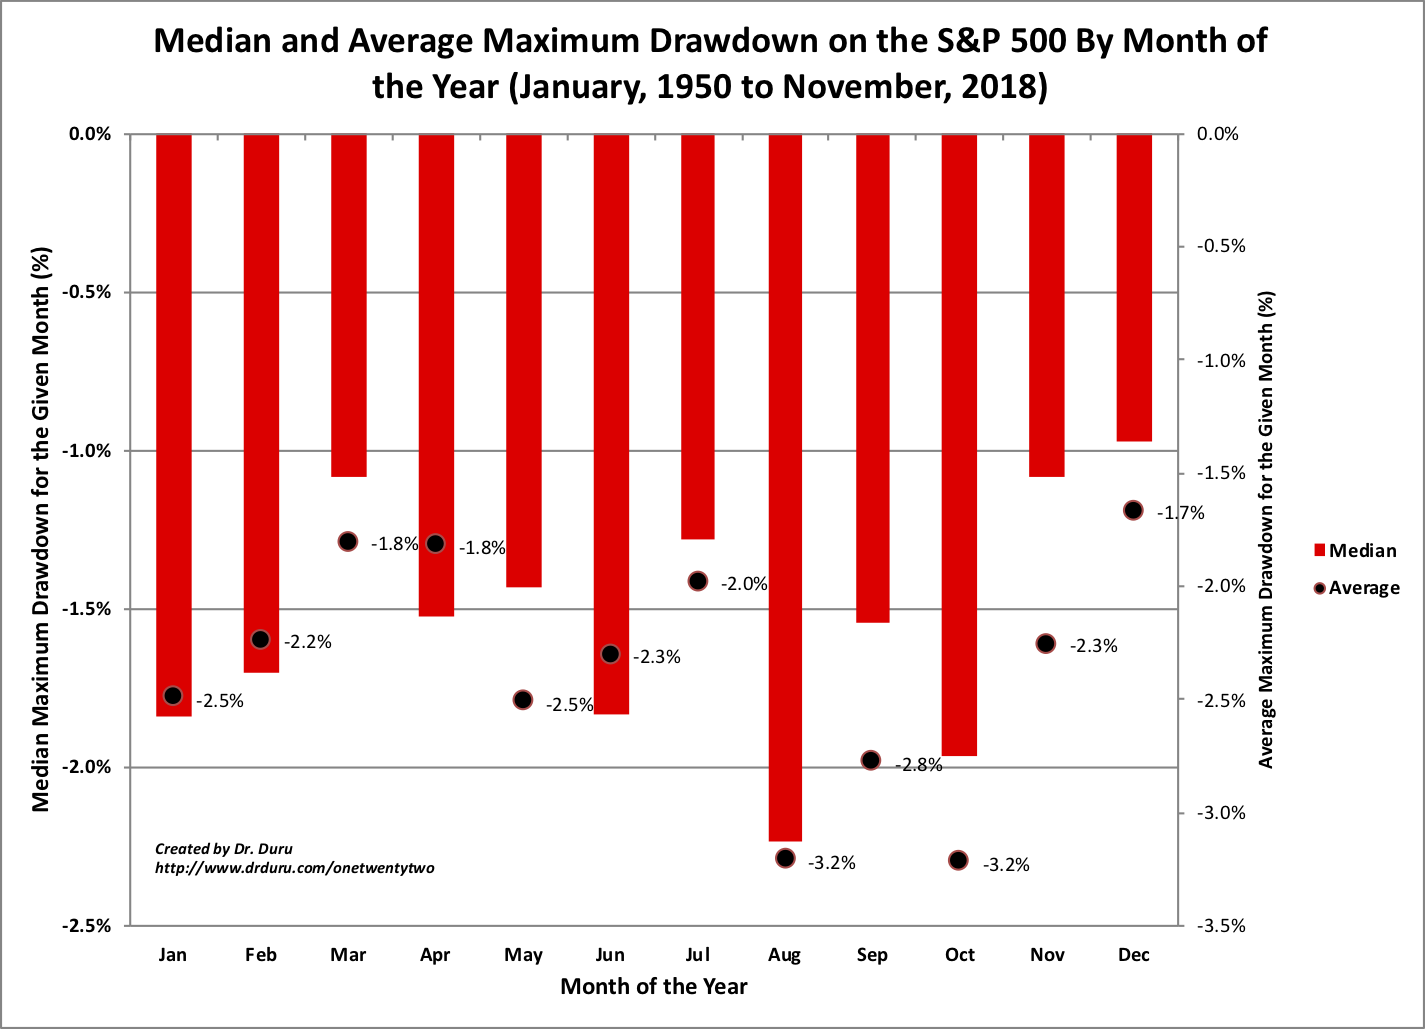
Summer trading in the U.S. traditionally starts after the Memorial Day holiday weekend. The period typically features lower levels of liquidity and, accordingly, periods of listless trading interrupted by bursts of wild volatility. While the “sell in May and go away” adage is a poor trading strategy, August is the year’s most dangerous month. In other words, the trading opportunities abound for those watching for the pockets of activity. If the week going into summer trading is any indication, meme stocks will fill the most active pockets of the summer trading season.
The Stock Market Indices
The S&P 500 (SPY) started last week with a 1.0% gain and a breakout above its 20-day moving average (DMA) (the dotted line in the chart below). The index traded listlessly from there. The S&P 500 looks ready for the summer trading season.
The NASDAQ (COMPQX) also traded listlessly. The tech-laden index started the week with both a 20 and a 50DMA (the red line below) breakout. The NASDAQ ended the week right in the middle of the gap down that started the month of May with alarm bells.
The iShares Trust Russell 2000 Index ETF (IWM) continues its listless pivot around its 50DMA. IWM confirmed a 50DMA breakout, but it remains uninteresting until it breaks away from the now 4-month long trading range.
Stock Market Volatility
The volatility index (VIX) suffered mightily from the week of mostly listless trading on the indices. The VIX will start the summer season at the edge of a major breakdown below its lows of the pandemic. Somehow, the VIX bounced off a perfect test of the intraday lows from April. As a reminder, further lows are a bullish signal for short-term trading.
The Short-Term Trading Call Amid A Meme Rush
- AT40 (T2108) = 53.7% of stocks are trading above their respective 40-day moving averages
- AT200 (T2107) = 77.4% of stocks are trading above their respective 200-day moving averages (TradingView’s calculation)
- Short-term Trading Call: neutral
AT40 (T2108), the percentage of stocks trading above their respective 40DMAs, closed the week three percentage points higher than the previous week. More importantly, my favorite technical indicator took a brief dip on Tuesday to 46.5% despite the S&P 500 only losing 0.2%. That day, IWM led the way with a 1.0% loss. That burst of selling seemingly cleared the way for buyers for the rest of the week. If the summer trading season unfolds as expected, such small blips will deliver sufficient buy signals in anticipation of quick turn-arounds… even if the stock market remains resigned to chopping and churning.
I took particular note of a broad array of meme stocks that sprang to life over the course of the week. Meme stocks are loosely defined as stocks popular with the WallStreetBets (WSB) Reddit (r/wallstreetbets) crowd which tends to favor heavily shorted stocks that can be manipulated higher via a short squeeze. The trading narrative usually rides a fundamental thesis that contradicts the bearish one. More generally, I think of a meme stock as any equity which converts into a viral investing or trading narrative; WSB is sufficient but not necessary.
Last week’s revival of meme trading accompanied surges in heavily shorted stocks and other growth names that remain beaten up. I am particularly interested in trading these meme stocks this summer, either long or short, given the proclivity for quick bursts of action well-defined by technicals. Through all the revived micro-bubbles, I expect to stay neutral on the stock market as the general market chops and churns its way through the summer trading season.
Stock Chart Video Review
Stock Chart Reviews – Below the 50DMA
Apple (AAPL)
Listless summer time trading seemed to start in Apple (AAPL) 2 weeks ago. Resistance from the 50DMA and support from the 200DMA keep AAPL well-contained for now. A downtrending 20DMA converged with the 50DMA to provide stiff resistance to AAPL at the beginning of the week. I await a resolution of this trading range before placing any trades.
Fastly (FSLY)
Content Delivery Network (CDN) provider Fastly (FSLY) is a former favorite among the growth stock crowd. After 10 months of wild swings in a large trading range, FSLY finally resolved to the downside thanks to a 27.1% post-earnings implosion. At its lowest post-earnings point, FSLY traded near a 52-week low. Of course now the stock looks relatively “cheap” to FSLY fans. Accordingly, FSLY has been creeping higher since one last bout of post-earnings selling. At a new post-earnings high, FSLY looks poised to grind its way back to overhead resistance at its 50DMA. Such a rebound would also conveniently close the post-earnings gap. I like a buy here with a stop below last week’s low.
Stock Chart Reviews – Above the 50DMA
AMC Entertainment Holdings (AMC)
AMC Entertainment Holdings (AMC) is one of the well-known meme stocks. The movie theater chain which almost went bankrupt during the pandemic still has 21% of its float sold short. The triggering news barely matters for meme stocks. It is sufficient to watch the technicals at work. AMC went parabolic and finished the week with a 116% parabolic gain. Seeing a fade unfold on Friday, I ventured into a low risk put calendar on AMC at the $20 strike. AMC’s maximum fade on Friday was almost a 33% loss. To be clear, meme stocks are most profitable when recognized early and bought. The massive liquidity in the system is helping to keep meme stocks aloft and well-supported.
GoodRx Holdings (GDRX)
A fresh Amazon Panic hit GoodRx Holdings (GDRX) after Amazon.com (AMZN) announced new features for comparing prescription prices. The majority of the selling occurred ahead of this announcement, so I assume some traders got the “drop.” In this panic, GDRX sliced through its IPO price of $33 and even dipped into the original $24-28 pricing range. I treated this collapse as a golden opportunity for adding more shares; the fundamental retort to the Amazon Panic remains solid for GDRX. I bought two more tranches of shares. One before and another after earnings. I almost took profits on Friday but decided to wait to see whether GDRX can pull off a confirmation of its 50DMA breakout.
The 25.0% short interest is not (yet?) distracting me from the story. I assume bears are most unhappy about the crazy high valuation of 22 times sales. Admittedly, I recognize this valuation means I cannot get comfortable staying in a position when a phase of momentum ends.
DoorDash (DASH)
“Only” 8.5% of the float of DoorDash (DASH) is sold short. However, I imagine DASH as a meme stock representing the deliver anything, anytime, anywhere narrative. DASH hit an all-time low ahead of earnings but burst higher post-earnings by 22.2%. That kind of move is a potentially decisive turning point in sentiment. Indeed, DASH last week next broke out of a pivot around its 50DMA. If DASH hurdles the April highs, it could quickly challenge the all-time high. I have flipped through several positions playing DASH on the way down and now up. I am currently holding a covered call position assuming the 50DMA will hold for a while as support but also the April high will serve as stiff resistance before giving way (if it does give way).
fuboTV (FUBO)
Bears are all over fuboTV (FUBO) to the tune of 17.7% of the float sold short. I actually fully agree with the bearish thesis on FUBO, but momentum and narrative matter for meme stocks in the moment. I originally bought a put option as a fade on FUBO’s post-earnings pop. The trade worked for a day, and the stock drifted then surged higher from there. I flipped to shares on the 200DMA breakout before a confirmation and will add shares on a test of 50DMA support. I am still holding the put option as a backstop.
Beyond Meat (BYND)
I recently wrote a half tongue-in-cheek article on Seeking Alpha about Beyond Meat (BYND) losing a 1-year race to Hormel Foods (HRL). I noted that closing the last post-earnings gap down would trigger a buy signal. Last week was the week. I actually bought before the gap closed on news Monday of a Bernstein upgrade to “outperform” and fresh partner news. I flipped the next day without waiting to see whether traders would challenge the 50DMA. Not only did they punch through resistance the next day, they challenged 200DMA resistance the very next day! With Jim Cramer egging on the meme stock crowd for Beyond Meat (BYND), I strongly suspect more momentum awaits
Lithium Americas Corp (LAC)
I have patiently waited for a new entry point on Lithium Americas Corp (LAC). The moment came last week with a 50DMA breakout confirming 200DMA support. I bought a small. tranche of shares on the breakout. With the downtrend ending in LAC, I expect to ride this position for a good amount of summer trading time.
Stitch Fix (SFIX)
The economy is reopening, and people will need to buy new clothes. Personally, I bemoaned discovering I have just ONE pair of slacks that still fit me after my pandemic weight gain. This reopening meme could generate broad-based momentum in stocks especially stocks like Stitch Fix (SFIX) beaten up in the growth tantrum. I jumped on last week’s 200DMA breakout which confirmed the prior 50DMA breakout. I bought a calendar call position for starters.
Tanger Factory Outlet Centers (SKT)
Tanger Factory Outlet Centers (SKT) is a (former?) meme stock that gets little attention anymore. Its bursts earlier this year were very brief but overall the stock remains resilient. After two months of pivoting around its 50DMA, SKT looks ready for a more sustained breakout. I bought shares and call options in anticipation. SKT still has a whopping 30.7% short interest. Consumers rushing to spend and buy should give Tanger Factory Outlet Centers plenty of tailwinds especially if they are looking for ways to beat soaring prices.
Upwork (UPWK)
Upwork (UPWK) is finally on the move again. UPWK confirmed a 50DMA breakout last week. I did not make a move, but I have UPWK on my buy list this week.
Salesforce.com (CRM)
Earnings treated Salesforce.com (CRM) well. Yet, CRM has a long way left to get out of its 7-month funk. This post-earnings 200DMA breakout is promising, but an intraday fade sent the stock back to the April peak. CRM is a buy on a close above the post-earnings high but NOT while it is stretched above its upper Bollinger Band (BB).
Boeing (BA)
Boeing (BA) woke up last week on news about plane orders. The stock dropped the next day on news about a halt in production of its 787 Dreamliner. The resulting 1.5% pullback put the buy signal on hold. I am waiting for a successful test of 50DMA support and/or a fresh breakout above the high from last week.
Be careful out there!
Footnotes
“Above the 40” (AT40) uses the percentage of stocks trading above their respective 40-day moving averages (DMAs) to measure breadth in he stock market. Breadth indicates the distribution of participation in a rally or sell-off. As a result, AT40 can identify extremes in market sentiment that are likely to reverse. Above the 40 is my alternative name for “T2108” which was created by Worden. Learn more about T2108 on my T2108 Resource Page. AT200, or T2107, measures the percentage of stocks trading above their respective 200DMAs.
Active AT40 (T2108) periods: Day #141 over 20%, Day #125 above 30%, Day #12 over 40%, Day #3 over 50% (overperiod), Day #35 under 60% (underperiod), Day #54 under 70%


Black line: AT40 (T2108) (% measured on the right)
Red line: Overbought threshold (70%); Blue line: Oversold threshold (20%). Chart always show the latest download date. Source: FreestockCharts
Source for charts unless otherwise noted: TradingView.com
Grammar checked by Grammar Coach from Thesaurus.com
Full disclosure: long UVXY calls, long SPY puts, long GDRX, long AMC calendar put
, long SKT shares and calls, long LAC, long DASH covered call, long FUBO shares and put, long SFIX calendar call, long HRL
FOLLOW Dr. Duru’s commentary on financial markets via StockTwits, Twitter, and even Instagram!
*Charting notes: Stock prices are not adjusted for dividends. Candlestick charts use hollow bodies: open candles indicate a close higher than the open, filled candles indicate an open higher than the close.