
Stock Market Commentary
A meme rush pushed the stock market toward summer trading. A breakout for market breadth launched summer trading. Small cap stocks appeared to lead the way even as the S&P 500 and the NASDAQ wilted for the close of trading. The divergence still leaves the stock market poised for an eventual rendezvous with overbought trading conditions.
The Stock Market Indices
The S&P 500 (SPY) gapped up slightly to start summer trading. Sellers took over from there and pressured the index most of the rest of the way into a 0.1% close.
The NASDAQ (COMPQX) printed a sharper divergence between buyers and sellers. After the initial gap up, sellers took the tech-laden index nearly straight down for the next hour. From there, buyers were eventually able to settle on a 0.1% close for the day.
The iShares Trust Russell 2000 Index ETF (IWM) led the way and helped to expand stock market breadth. Like the other major indices, sellers immediately challenged the gap up on IWM. However, after the first hour of trading, buyers managed to maintain upward pressure most of the rest of the way. IWM closed out the day with an important 1.1% gain that took the index of small caps close to the top of its trading range. I continue to keep my powder dry until I see a definitive breakout (or breakdown) from the trading range.
Stock Market Volatility
The volatility index (VIX) kept me from celebrating a kind of bullish divergence on the day. Somehow, the VIX rebounded from a plunge to the April intraday low and closed with a 6.7% gain. I do not quite know what to make of this move. It should signal another sustained bottom for the VIX, but the expanded market breadth is inconsistent with this VIX revival.
The Short-Term Trading Call With A Breakout for Market Breadth
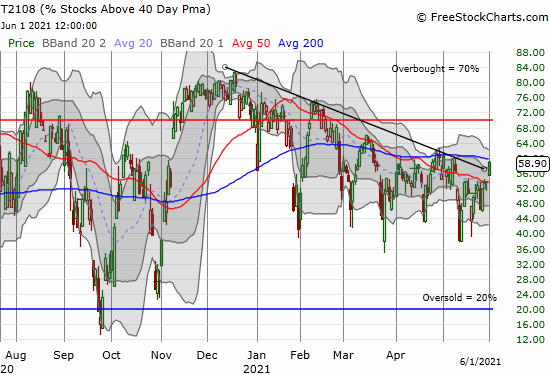
- AT40 (T2108) = 58.9% of stocks are trading above their respective 40-day moving averages
- AT200 (T2107) = 78.0% of stocks are trading above their respective 200-day moving averages (TradingView’s calculation)
- Short-term Trading Call: neutral
AT40 (T2108), the percentage of stocks trading above their respective 40DMAs, closed the day at 58.9%. My favorite technical indicator gapped up and sliced right through a downtrend in place since January. While the highs of April look like formidable resistance, this breakout looks important. The expanding breadth looks like it includes sufficient momentum. If I am correct, then this summer should eventually feature a test of overbought trading conditions (AT40 at 70%).
The path to overbought should still feature chopping and churning but now with a slight upward bias. As I stated above, the VIX is a key wildcard in this picture. I doubt the stock market can long sustain an upward bias with the VIX drifting higher. Indeed, I think a challenge of overbought conditions has to come with a bullishly fresh breakdown in the VIX. In the meantime, my short-term trading call remains comfortably at neutral until clearer trading signals emerge.
Stock Chart Reviews – Below the 50DMA
Apple (AAPL)
Even with its annual Worldwide Developer’s Conference (WWDC21), Apple (AAPL) is getting the “I’m bored” treatment. AAPL closed the day neatly atop its 200DMA support. Since this support has yet to break in over 13 months, I am prepared to trade for a bounce back to 50DMA resistance. In fact, once AAPL broke out above its 200DMA, the stock streaked far ahead of the trendline for months. Accordingly, this inability to decisively break free of the 200DMA’s pull is an important struggle for mighty AAPL.
Stock Chart Reviews – Above the 50DMA
AMC Entertainment Holdings (AMC)
I am also giving AMC Entertainment Holdings (AMC) an immediate relook. What happened from Friday to Tuesday must represent a classic sign of the flood of money available in the stock market. AMC avoided dumping shares directly into the market by selling out to Mudrick Capital Management who in turn did the dirty work of dumping all the shares on the market on Monday. Fortunately, the market was more than happy to give Mudrick a quick and easy gain. Mudrick bought 8.5M shares on Friday at $27.12. AMC gapped open on Monday at $31.89 and closed at $32.04 after intraday swings. This whole sequence sings out “free money!” Where do I find work like this? (CNBC published an extensive piece describing the AMC drama and the euphoria and vitriol that now accompanies these meme stocks: “AMC’s ‘apes’ gave it a lifeline. Now, its CEO wants to use the meme frenzy as a springboard for growth“).
Schlumberger (SLB)
Energy continues to be a bit of a contrarian play in 2021 given all the buzz and focus on alternative energy and electric vehicles. The energy sector includes many nice trade setups like the one below for Schlumberger (SLB). SLB bounced neatly off 20DMA support. I am a buyer here with a stop below last week’s low.
Be careful out there!
Footnotes
“Above the 40” (AT40) uses the percentage of stocks trading above their respective 40-day moving averages (DMAs) to measure breadth in he stock market. Breadth indicates the distribution of participation in a rally or sell-off. As a result, AT40 can identify extremes in market sentiment that are likely to reverse. Above the 40 is my alternative name for “T2108” which was created by Worden. Learn more about T2108 on my T2108 Resource Page. AT200, or T2107, measures the percentage of stocks trading above their respective 200DMAs.
Active AT40 (T2108) periods: Day #142 over 20%, Day #126 above 30%, Day #13 over 40%, Day #4 over 50% (overperiod), Day #36 under 60% (underperiod), Day #55 under 70%


Black line: AT40 (T2108) (% measured on the right)
Red line: Overbought threshold (70%); Blue line: Oversold threshold (20%). Chart always show the latest download date. Source: FreestockCharts
Source for charts unless otherwise noted: TradingView.com
Grammar checked by Grammar Coach from Thesaurus.com
Full disclosure: long UVXY calls, long SPY puts, long AMC calendar put
FOLLOW Dr. Duru’s commentary on financial markets via StockTwits, Twitter, and even Instagram!
*Charting notes: Stock prices are not adjusted for dividends. Candlestick charts use hollow bodies: open candles indicate a close higher than the open, filled candles indicate an open higher than the close.