
Housing Market Intro and Summary
“…the level of housing activity is at its highest level since before the global financial crisis in some measure. So we’ve had a very strong rebound in housing. Some of the tightness in housing markets — which has led to the significant price increases this year — we think is a passing phenomenon. There was a lot of pent up demand. There was a one-time thing happening with people who are spending all of their time in their house, and they’re thinking, either I need a bigger house, or I need another house and a different house, or a second house in some cases. So there’s a one-time shift in demand that we think will get satisfied, also that will call for supply. And we think we think that those price increases are unlikely to be sustained for all of those reasons.”
Jerome Powell, Federal Reserve Chairman, January 27, 2021.
The emphasis in the above quote is mine. Powell practically called a peak in housing activity. He sees prices declining, supply increasing, and pent-up demand dissipating. Perhaps Powell was over-eager to dispel the notion of a housing bubble, but the data may slowly but surely converge to prove Powell correct. Housing activity is normalizing, albeit off high-levels. The extremely strong housing activity of 2020 will be hard to beat and guidance from home builders confirms that challenge. I discussed the prospects for a cooling off in the housing market in my last Housing Market Review. The latest data show that only housing starts and median sales prices remain red hot.
In mid to late January, stocks of home builders finally broke out from extended trading ranges. The moves were very brief as negative reactions to earnings reports dropped some major builders in price. If these stocks are going to make a seasonal run into the Spring selling season, the momentum needs to re-emerge very soon.
Housing Stocks
The iShares Dow Jones US Home Construction Index Fund (ITB) finally broke out to a new all-time on January 20th. The breakout only lasted 5 days as earnings from Meritage Homes (MTH) and D.R. Horton (DHI) helped reverse the ETF. I used the pullback to nibble back into the seasonal trade on home builders with ITB March $62 call options. If the seasonal excitement for Spring fails to materialize by then, the 2021 trading season could disappoint as much as 2020 surprised.
Meritage Homes (MTH) plunged 7.8% post-earnings. Analysts complained about earnings guidance below expectations. The lower end of MTH’s home closing guidance is a 2.8% year-over-year drop. The high end is a mere 5.6% increase. These numbers both reflect tough year-over-year comparables combined with an apparent under-supply of inventory. MTH ended last week with a breakdown below 200-day moving average (DMA) support on a 6.7% decline. MTH now clings to the 8-month lows set in January.
D.R. Horton (DHI) lost 1.5% post-earnings after first gapping up at the open. The stock continues to trade below the former all-time high set in October.
A new home builder hit the public markets last month: Dream Finders Homes Inc (DFH). DFH’s IPO priced at $13/share and opened at $19.51. This kind of excitement for a home builder is surprising even in this bull market. Dream Finders Homes sells in nine communities: Denver, Austin, Orlando, Jacksonville (company headquarters), Savannah, Hilton Head, Northern Virginia, and Maryland. Regional home builders have performed particularly well in recent years. I have already traded in and out of DFH (I had to lock in the sudden surge in profits), but I will definitely have the stock at the top of the list for seasonal buys in the future.
Dream Finders Homes already put its IPO money to work. Today, February 1st, DFH announced its acquisition of Century Homes Florida in Orlando: “The acquisition will allow us to expand our footprint and keep up with the growing demands of the Central Florida market. With a culture rooted in customer service and an unwavering dedication to excellence, we look forward to carrying on the Craft and Century Homes legacies while enabling the team to accelerate and reach new heights.” DFH grew sales in 2020 by 95% over 2019 and has operated since 2008 (impressive to see such a new company survive the financial crisis!).
Housing Data
New Residential Construction (Single-Family Housing Starts) – December, 2020
December single-family home starts reached 1,338,000 which was 12.0% above November’s 1,186,000 starts (revised slightly downward) and was a startling 27.8% above December, 2019. As a result, housing starts hit a new 13+ year high. The rate of year-over-year change has been positive for six straight months.
Source: US. Bureau of the Census, Privately Owned Housing Starts: 1-Unit Structures [HOUST1F], first retrieved from FRED, Federal Reserve Bank of St. Louis, January 31, 2020.
The slowing growth from November’s report is already a distant memory. Home builders clearly remain extremely confident in the housing market. Inventories are chronically low and builders essentially cannot move fast enough for now. The torrid pace of starts after a short dip at the beginning of the pandemic put starts back on the previously steady uptrend. The previous year was a slight slowdown off-trend. The annual rate for 2020 hit 1,002,000 for the year and shows a normalization of the market off high levels.
Source: US. Bureau of the Census, Privately Owned Housing Starts: 1-Unit Structures [HOUST1F], first retrieved from FRED, Federal Reserve Bank of St. Louis, January 31, 2020.
The Northeast joined the other regions in growth. Housing starts in the Northeast, Midwest, South, and West each grew +19.7%, +38.4%, +22.9%, +34.6% respectively year-over-year.
Existing Home Sales – December, 2020
Existing home sales slipped a little off 14-year highs in November. December’s slight increase did not quite return to those highs. The seasonally adjusted annualized sales in December of 6.76 increased 0.7% month-over-month from the slightly upwardly revised 6.71M in existing sales for November. Year-over-year sales jumped 22.2%, a second month in a row of slightly declining growth rates. For the year, the housing market experienced 5.64M sales of existing homes. This annual increase of 5.6% took sales to their highest level since the financial crisis.
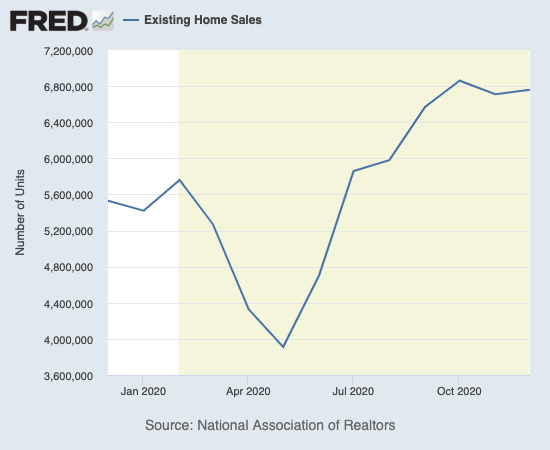
(As of the March, 2018 data, the NAR further reduced historical data to just 13 months. For historical data from 1999 to 2014, click here. For historical data from 2014 to 2018, click here) Source for chart: National Association of Realtors, Existing Home Sales© [EXHOSLUSM495S], retrieved from FRED, Federal Reserve Bank of St. Louis, January 31, 2020.

The absolute inventory level of 1.07M homes dropped significantly from November by 16.4%, much greater than November’s sequential decline. Inventory plunged 23% from a year ago (compare to November’s 22%, October’s 19.8%, September’s 19.2%, August’s 18.6%, July’s 21.1%, June’s 18.2%, May’s 18.8%, April’s 19.7%, March’s 10.2%, February’s 9.8%, January’s 10.7% year-over-year declines, unrevised). The inventory situation for existing homes continues to worsen. “Unsold inventory sits at an all-time low 1.9-month supply at the current sales pace, down from 2.3 months in November and down from the 3.0-month figure recorded in December 2019. NAR first began tracking the single-family home supply in 1982.” Inventories will likely be the last part of housing activity to normalize.
The average 21 days it took to sell a home matched the record lows set in September, October, and November. The on-going year-over-year decline in inventory is on a 19-month streak. The tightening constraint shoves prices ever higher and further exacerbates affordability issues. The NAR expressed its support for a first-time homebuyers credit without directly calling out how the resulting increase in demand will put further stresses on the housing market. So even with home builders getting inventory on the ground at a blistering pace, the NAR wants still more: “To their credit, homebuilders and construction companies have increased efforts to build…However, it will take vigorous new home construction in 2021 and in 2022 to adequately furnish the market to properly meet the demand.”
The median price of an existing home hit $309,800 and represents a large year-over-year jump of 12.9%. Prices have increased year-over-year for 106 straight months. The median price declined ever so slightly from November by 0.4%, the second month-over-month decline in a row.
First-time home buyers took a 31% share of sales in November. This share is below the 32% from September to November and equal to the 31% a year ago. The share of first-time home buyers for existing homes never followed the narrative this year of first-time millennials rushing into the housing market. The NAR’s 2017 Profile of Home Buyers and Sellers reported an average of 34% for 2017, 33% for 2018, 33% for 2019, and 31% for 2020.
Investors stepped into the breach in May by increasing from April’s 10% share of sales to 14%. Except for a (seasonal?) drop to 9% in June and a 12% share in August, investors have maintained a 14-15% share. December’s investor share was the second notable year-over-year decline. The November and December 2020 shares were 20%.
For the fourth month in a row, existing home sales surged across all regions on a year-over-year basis. The South and West experienced much slower than the 20%+ annual growth rates from the previous month and compared to the other two regions. The regional year-over-year changes were: Northeast +27.4%, Midwest +26.2%, South +11.3%, West +14.2%.
All regions have experienced strong price gains since May. The regional October price gains were on balance even more breathtaking than September’s. The November and December price gains “cooled” back down a bit. For December: Northeast +19.0%, Midwest +13.7%, South +11.3%, West +14.2%.
Single-family home sales increased 0.7% from November and increased on a yearly basis by 17.7%. The median price of $314,300 was up 13.5% year-over-year.
California Existing Home Sales – December, 2020
In California, home prices are soaring, inventory shrinking, and listings fading away. The state made a full recovery from the pandemic-driven plunge and even achieved a 3.5% increase in sales from 2019 (slightly less than the national average). The Far North was the only region that failed to gain over 2019’s sales.
For December, the California Association of Realtors (C.AR.) reported 509,750 in existing, single-family home sales. Sales increased 0.2% from November and 28% year-over-year. This was California’s largest year-over-year gain in sales since May, 2009. The Central Coast was the only region that failed to notch double-digit gains.
The median price hit a new all-time record at $717,930, up 16.8% year-over-year. Lassen was the only county with a year-over-year decline in price. Californians paid an average $330 per square foot which was the second highest price since August, 2007.
Inventory shrank and matched 2004’s all-time low of 1.3 months of sales. Active listings dropped 41.7% year-over-year. The Bay Area was the only region which experienced a greater than 35% monthly drop in properties for sale. November set a record low in the median number of days required to sell a single-family home. In December, that duration increased to 11 days, still a remarkable 60.7% year-over-year drop.
California remains on a collision course between affordability and housing demand through a process of normalization off high levels of housing activity.
New Residential Sales (Single-Family) – December, 2020
Going into December, new home single-family sales declined on a monthly basis for two months in a row. It was a sign of overdue normalization in the housing market. For December, sales ticked up slightly by 1.6% to 842,000, up from November’s downwardly revised 829,000 sales. Sales were up 15.2% year-over-year.
Source: US. Bureau of the Census, New One Family Houses Sold: United States [HSN1F], first retrieved from FRED, Federal Reserve Bank of St. Louis, February 1, 2021.
On an annual basis, new homes sales returned to the uptrend that ended after 2017. Sales increased 18.8% over 2019. Like housing starts, who could have predicted that such a boost would happen during a pandemic?!
Source: US. Bureau of the Census, New One Family Houses Sold: United States [HSN1F], first retrieved from FRED, Federal Reserve Bank of St. Louis, February 1, 2021.
Median home prices for new home sales came to life. They cleared the hurdle and hit a new all-time high of 355,900. This price was an increase of 3.5% over November and up 8.0% year-over-year. After hitting a trough in April, prices have trended sharply upward. I am very interested to see whether this price increase also translated into higher prices per square foot (data released quarterly).
Source: U.S. Census Bureau and U.S. Department of Housing and Urban Development, Median Sales Price for New Houses Sold in the United States [MSPNHSUS], retrieved from FRED, Federal Reserve Bank of St. Louis, February 1, 2021.
The monthly inventory of new homes for sale declined from 4.8 in May to 3.4 in August. Inventory declined again in October to 3.3 from 3.6 months of sales in September. Inventory jumped back up to 4.1 months of sales in November and up to 4.3 for December. A well-balanced market has inventory around 6 months worth of sales.
The Northeast was a drag on the sale of new homes in September but led the way in October. It was a drag again in December. The Midwest was the big drag in November despite the strong gains in the region for existing home sales. The Northeast decreased year-over-year by 20.5%. The Midwest rebounded 13.3%. The South gained 21.7% year-over-year. The West increased 10.4%.
Home Builder Confidence: The Housing Market Index – January, 2021
The National Association of Home Builders (NAHB) reported a second straight monthly decline in the NAHB/Wells Fargo Housing Market Index (HMI). December’s drop was the first for home builder sentiment since April and followed four straight all-time highs. The HMI of 83 for January was a 3 point drop. The NAHB’s commentary was very negative. It does not sound like the kind of context for sentiment just off all-time highs. The supply side of the housing market is clearly staring down increasing challenges. The squeeze should contribute to a normalization in sales trends.
“Despite robust housing demand and low mortgage rates, buyers are facing a dearth of new homes on the market, which is exacerbating affordability problems…Builders are grappling with supply-side constraints related to lumber and other material costs, a lack of affordable lots and labor shortages that delay delivery times and put upward pressure on home prices. They are also concerned about a changing regulatory environment.”
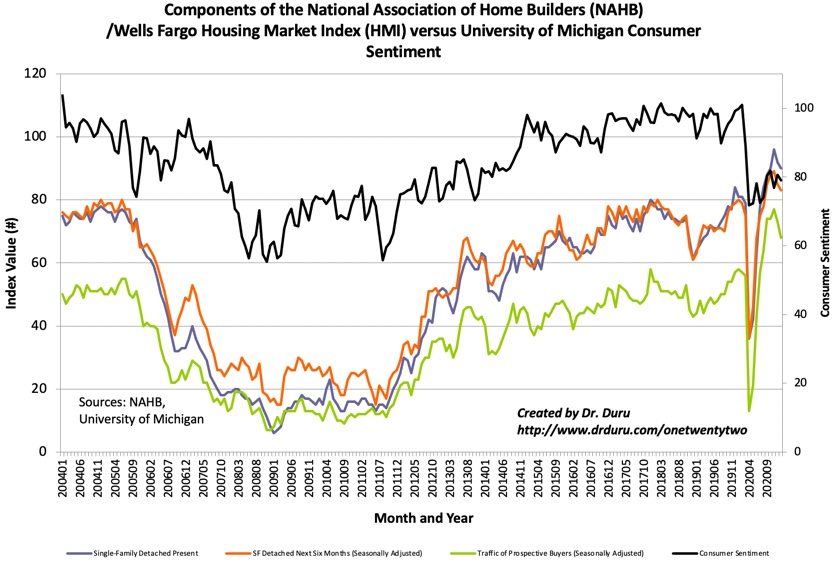
Source for data: NAHB
The traffic of prospective buyers dropped the most of the three components of the HMI. While the three components are tightly correlated, I interpret this decline as particularly significant given consumer sentiment still has barely recovered from its pandemic-drive plunge. Until the pandemic, consumer and home builder sentiment were well-correlated. At some point, I expect the correlation to resume, so a decline in home builder sentiment implies that normalization points downward.
All four regional HMIs followed the overall HMI lower again. However, the Northeast is the worst performer. The region is down three months in a row and fell a whopping 10 points from December to 68, a 6-month low. The Midwest performed best with a 1 point drop to 81. The South fell from 87 to 82. The West fell from 96 to 92.
Home closing thoughts
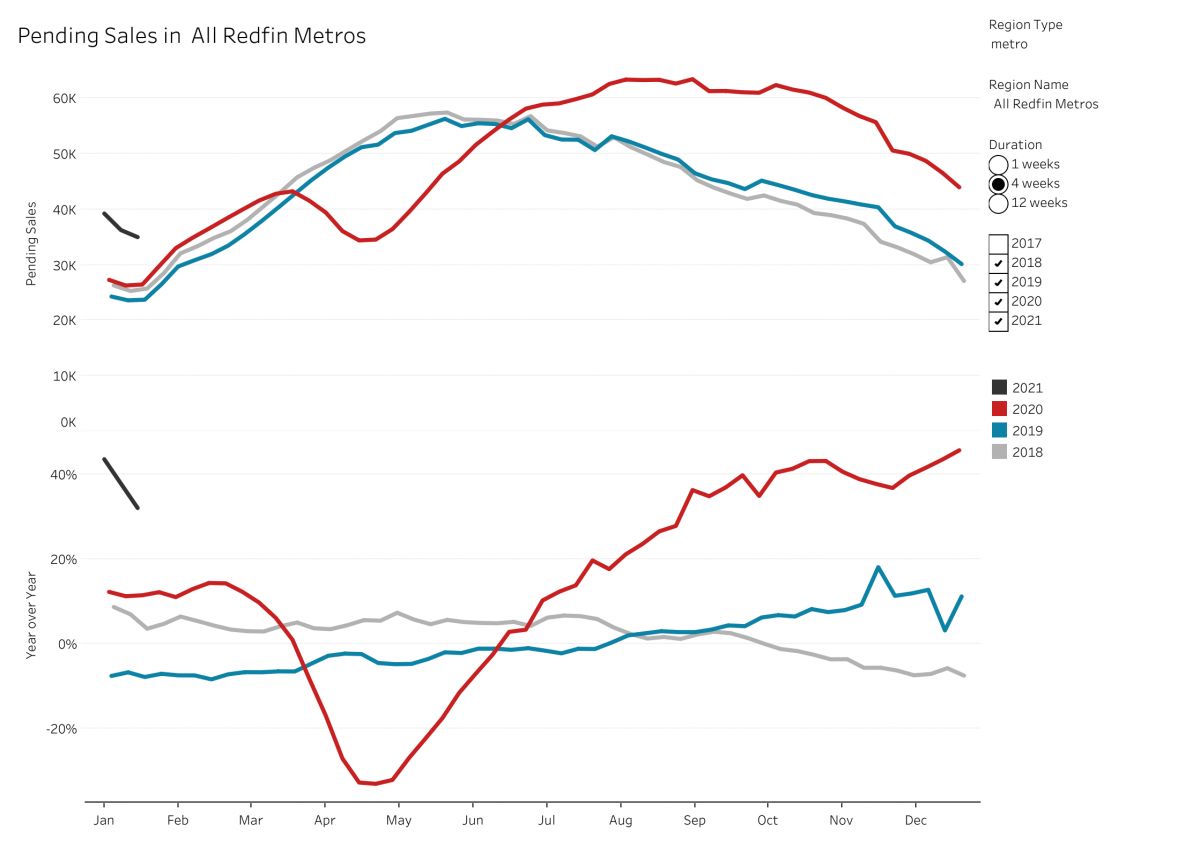
Pending Home Sales
Pending home sales hit a new record high for December. However, they have declined four months in a row. A revision must have prevented December from being the fifth monthly decline in a row. The declines are slight with November to December driving a -0.3% change. Yet, the trend suggests existing home sales should remain flattish going into the Spring selling season. Seasonally, pending home sales should not soar during this time anyway. Pending sales provide another angle on normalizing housing activity from high levels.
Redfin’s housing activity data provide a good look at the current normalization in the sequential trend of pending home sales. Note that the year-over-year pace was strengthening through December. The pace notably slowed to start 2021 (he black line). The data below show a 4-week moving average for all Redfin metropolitan areas.
California Exodus
I continue to read and hear a lot of news and stories about a “mass exodus” from California. CNBC presents a lot of compelling data in the story below. However, the data on housing activity for California do not say “exodus.” Housing inventory continues to tighten and listings dry up. A true exodus would feature a flood of supply of (existing) home sales. I have to assume that the exodus consists mainly of potential home buyers looking to find inventory at more reasonable prices.
Be careful out there!
Full disclosure: long ITB calls