
Housing Market Intro and Summary
A little over a month after Federal Reserve Chairman Jerome Powell suggested that the housing market would soon normalize, mortgage rates have increased and the stocks of home builders have generally gone nowhere. The National Association of Realtors projected much stronger growth in existing home sales this year than in 2020. New home sales are climbing out of a sharp trough, but the National Association of Home Builders is warning of slower construction growth ahead. Housing starts pulled back sharply and look ready to at least return to trend. Home builder confidence has stopped making new all-time highs. Yet, the ultimate signs of normalization, prices and inventory, have barely budged. Year-over-year price gains and inventory reductions are as strong as ever. The housing market is flashing a mix of signals going into the all-important Spring selling season.
The housing market now faces its annual test with the Spring selling season. Housing demand for the 2021 season should be the ultimate tell all else being equal. I am reading earnings reports and watching stocks for additional clues. The past month of results flashed a mix of signals.
Housing Stocks
The iShares Dow Jones US Home Construction Index Fund (ITB) rallied shortly after Powell’s claims. After new all-time highs in early February, ITB pulled right back and reversed all its gains. ITB successfully tested support at its 50-day moving average (DMA) (the red line below) and now looks ready to grind its way into the Spring selling season.
Last month I wrote about Meritage Homes (MTH) as a catch-up trade among home builders. Since then, MTH has struggled with a pivot around its 50DMA.
I marveled about the large post-earnings surge for Century Communities (CCS). Despite its status as a medium-sized, regional builder, the results from CCS helped refresh the entire home builder sector for a new rally. As a reader insisted would happen, CCS pulled back and provided a cheaper entry point for investing in future blow-out results. .
Speaking of earnings impact, a 19.6% post-earnings plunge for Redfin (RDFN) helped bring down housing-related stocks last week. The disruption came just two days after realtor services company Realogy (RLGY) tumbled 15.8% post-earnings. Together, the stocks suggest transactions will be a little more challenged in coming weeks and months. I will soon review the Redfin results for clues on the prospects for the housing market. The company’s management usually has very good insights.
The seasonal trade in home builders clashes directly with my bearish assessment of the short-term outlook for the stock market. That clash gives a split personality on the trading environment. While I always reserve a permabull outlook for housing-related stocks, I am a bit wary about the current mix of signals.
Housing Data
New Residential Construction (Single-Family Housing Starts) – January, 2021
January single-family home starts dropped to 1,162,000 which was 12.2% below December’s 1,323,000 starts (revised slightly downward). Starts were still 12.5% above January, 2020 levels. Housing starts fell from a 13+ year high. The rate of year-over-year change has been positive for seven straight months.
Source: US. Bureau of the Census, Privately Owned Housing Starts: 1-Unit Structures [HOUST1F], first retrieved from FRED, Federal Reserve Bank of St. Louis, February 21, 2021.
Year-over-year growth slowed again, but it will pick up with the comparisons to last year’s initial pandemic-related plunge. Still, the rush to start homes in the last several months of 2020 was well-above trend. I fully expect the pace to slow down enough to return to trend.
The West was the big (and surprising) laggard. The region hit a 6-month low in year-over-year growth. Housing starts in the Northeast, Midwest, South, and West each grew +24.6%, +18.0%, +24.2%, +2.6% respectively year-over-year.
Existing Home Sales – January, 2021
Existing home sales regained some ground on the 14-year high set in November. The seasonally adjusted annualized sales in January of 6.69M increased 0.6% month-over-month from the slightly downwardly revised 6.65M in existing sales for December. Year-over-year sales jumped 23.4%, ending two straight months of slightly declining growth rates.
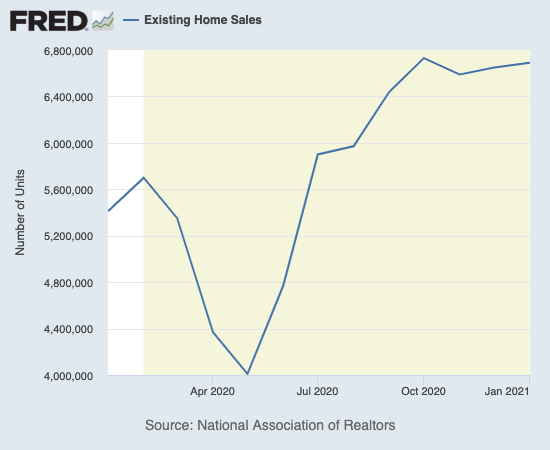
(As of the March, 2018 data, the NAR further reduced historical data to just 13 months. For historical data from 1999 to 2014, click here. For historical data from 2014 to 2018, click here) Source for chart: National Association of Realtors, Existing Home Sales© [EXHOSLUSM495S], retrieved from FRED, Federal Reserve Bank of St. Louis, February 21, 2020.

The absolute inventory level of 1.04M homes dropped slightly from December by 1.9%, a much smaller decline than December’s 16.4% sequential drop. Inventory plunged 25.7% from a year ago (compare to December’s 23%, November’s 22%, October’s 19.8%, September’s 19.2%, August’s 18.6%, July’s 21.1%, June’s 18.2%, May’s 18.8%, April’s 19.7%, and March’s 10.2% year-over-year declines, unrevised). The inventory situation for existing homes continues to slide downward. “Unsold inventory sits at a 1.9-month supply at the current sales pace, equal to December’s supply and down from the 3.1-month amount recorded in January 2020.” The year-over-year decline and absolute inventory level are both records since the NAR started recording these data in 1982.
The average 21 days it took to sell a home matched the record lows set from September to December. The on-going year-over-year decline in inventory is on a 20-month streak. The tightening constraint shoves prices ever higher and further exacerbates affordability issues. The NAR also estimated that sales could have been 20% higher if the market held adequate inventories. Still, the NAR is confident enough to project 6.5M in sales for 2021, a robust 8.2% growth rate that exceeds 2020’s 5.6% annual growth.
The median price of an existing home hit $303,900 and represents a large year-over-year jump of 14.1%. Prices have increased year-over-year for 107 straight months. The median price declined from December by 1.7%, the third month-over-month decline in a row.
First-time home buyers took a 33% share of sales in January. This share is above the 32% from September to November and 31% in December. It is also above the 32% from a year ago. The NAR’s 2017 Profile of Home Buyers and Sellers reported an average of 34% for 2017, 33% for 2018, 33% for 2019, and 31% for 2020. Investors took a 15% share of sales, down notably year-over-year from 17%.
For the fifth month in a row, existing home sales soared across all regions on a year-over-year basis. The South and West returned to 20%+ annual growth rates. The regional year-over-year changes were: Northeast +24.3%, Midwest +22.7%, South +25.1%, West +21.3%.
All regions have registered strong price gains since May. The regional October price gains were on balance even more breathtaking than September’s. The November and December price gains “cooled” back down a bit. For January: Northeast +15.8%, Midwest +14.7%, South +14.6%, West +16.1%.
Single-family home sales increased 0.2% from December and increased on a yearly basis by 23.0%. The median price of $308,300 was up 14.8% year-over-year.
California Existing Home Sales – January, 2021
For January, the California Association of Realtors (C.AR.) reported 484,730 in existing, single-family home sales for California. Sales decreased 4.9% from December and increased 22.5% year-over-year. Sales are on a 6-month streak of double-digit year-over-year gains. The Far North was the only Californian region which suffered a year-over-year decline.
At $699,890 the median price came down 2.5% off the all-time record. It was still up 21.7% year-over-year. Four counties experienced year-over-year price declines.
Inventory increased off an all-time low and reached 1.5 months of sales. A year ago, inventory was at a still unbalanced 3.4 months of sales. Active listings dropped a whopping 53.4% year-over-year, an eighth straight month of 40%+ declines. November set a record low in the median number of days required to sell a single-family home. In December, that duration increased to 11 days, and in January it crept up further to 12 days. A year ago, the median number was 31.
New Residential Sales (Single-Family) – January, 2021
New home sales continued to climb out the trough from November. For January, sales ticked up slightly by 4.3% to 932,000, up from December’s upwardly revised 885,000 sales. Sales were up 19.3% year-over-year.
Source: US. Bureau of the Census, New One Family Houses Sold: United States [HSN1F], first retrieved from FRED, Federal Reserve Bank of St. Louis, February 28, 2021.
Median home prices came off the all-time high by 1.9% to hit $346,000. This price was an increase of 5.3% year-over-year. After hitting a trough in April, prices have trended sharply upward. I am very interested to see whether this price increase also translated into higher prices per square foot (data released quarterly).
Source: U.S. Census Bureau and U.S. Department of Housing and Urban Development, Median Sales Price for New Houses Sold in the United States [MSPNHSUS], retrieved from FRED, Federal Reserve Bank of St. Louis, February 28, 2021.
The monthly inventory of new homes for sale declined from 4.8 in May to 3.4 in August. Since then, inventory jumped back up to 4.3 for December and fell slightly to 4.0 in January. A well-balanced market has inventory around 6 months worth of sales.
The West joined the Northeast as a drag on the sale of new homes in January. The Midwest was the big drag in November despite the strong gains in the region for existing home sales. The Northeast decreased year-over-year by 8.8%. The Midwest hit 10.3%. The South soared 40.4% and led the way. The West increased 6.3%.
Home Builder Confidence: The Housing Market Index – February, 2021
The National Association of Home Builders (NAHB) reported a one point increase in the NAHB/Wells Fargo Housing Market Index (HMI). A two month losing streak came to an end. December’s drop was the first for home builder sentiment since April and followed four straight all-time highs. The HMI of 83 for January was a 3 point drop.
The NAHB’s commentary was very negative in January and even more dour for February. Even the title of February’s report was a bit ominous: “Builder Confidence: High Demand Offsets Higher Costs – For Now” (emphasis mine). The NAHB called out project delays and went so far to predict a slowdown in growth because of high costs. The recent all-time highs in lumber helped drive down the price of home builders.
“Lumber prices have been steadily rising this year and hit a record high in mid-February, adding thousands of dollars to the cost of a new home and causing some builders to abruptly halt projects at a time when inventories are already at all-time lows…
…we expect to see some cooling in growth rates for residential construction in 2021 due to cost factors, supply chain issues and regulatory risks…Some builders are at capacity and may not be able to expand production due to these headwinds.”
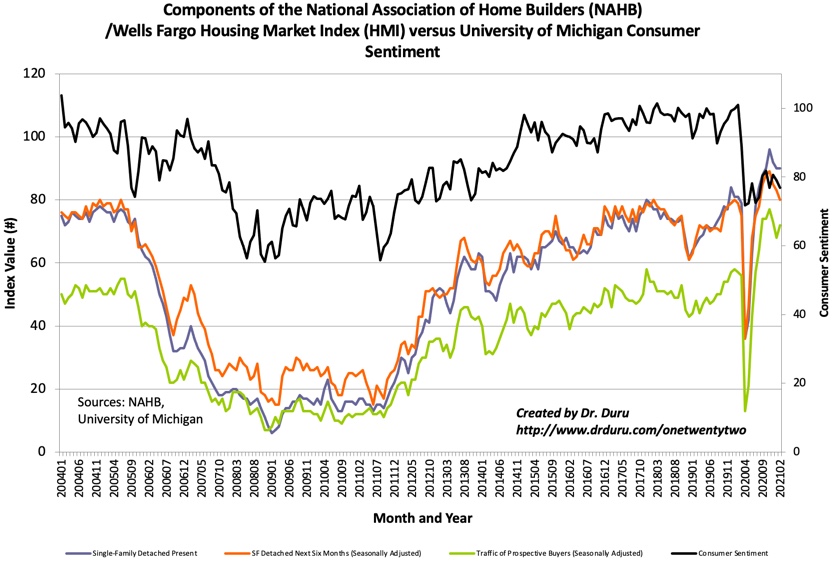
Source for data: NAHB
The traffic of prospective buyers dropped the most of the three components of the HMI in January. For February, only the Single-family detached six months component fell. That component is now aligned with sagging consumer confidence. I suspect both will continue to drag on the overall HMI in coming months especially given the worries expressed by the NAHB.
The Northeast had the worst performing HMI in January. The region pulled off a strong rebound from 68 to 89, an all-time high since the NAHB started reporting the breakdown in December, 2004. That was quite a turn-around after peaking in October. The Midwest gained a point. The South remained flat at 82. The West fell a point from 92 to 91.
Home closing thoughts
Millennials Still Behind
The torrid pace of home-buying still leaves millennials behind historic rates of home ownership. According to Marketplace: “Low interest rates and demand for larger spaces helped drive millennial home-ownership up last year, but that generation is still 5 to 10 percentage points behind where Generation X and baby boomers were at the same age.” Of course, these numbers could imply much more voracious buying ahead as this generation continues to play “catch-up.” Certainly, the flatlined share of first-time home buyers in the existing home sales report suggest that the extra momentum has yet to arrive.
The Other Side of the Rental Housing Crisis
While government bodies scrambled to provide eviction and rent protections for renters impacted by the COVID-19 pandemic, landlords can find themselves put into a squeeze. Marketplace finally did more coverage on the small-time landlords who are facing financial ruin from the on-going lack of rental income, money required to pay the mortgage and living expenses.
In early February, the Centers for Disease Control and Prevention (CDC) used its authority to protect public health to extend a moratorium on evictions to March 31, 2021. The CDC provides no financial support for its order. Other agencies are expected to do so.
“The COVID-19 pandemic has presented a historic threat to our nation’s health. Despite extensive mitigation efforts, COVID-19 continues to spread in America at a concerning pace. The pandemic has also exacerbated underlying issues of housing insecurity for many Americans. Keeping people in their homes and out of congregate settings — like shelters — is a key step in helping to stop the spread of COVID-19. “
Be careful out there!
Full disclosure: long ITB calls, long MTH, long CCS shares and short a call option