
Housing Market Intro and Summary
A divergence in the housing market is emerging between slowing home builder stocks and strong housing data. The housing boom in the U.S. continued to make its mark in the middle of the pandemic-induced recession. While new home sales took a bit of a pause in October, housing starts, existing home sales, and especially home builder sentiment continued to remain strong and even soar. Meanwhile, housing-related stocks took a pause during the second half of October. These stocks are attempting a rebound in November.
Whenever stocks sell off despite strong fundamental data, a topping process could be underway. Yet, the timing of the divergence in the housing market with the October pullback was perfect for launching the seasonal trade in home builders. November is so far validating the trading strategy. Ironically, the current rally moved so far and so swiftly that I am now waiting for the next pullback to further grow my positions. I even took profits on one position (see below).
Housing Stocks
Stock charts readily reveal the current divergence in the housing market.
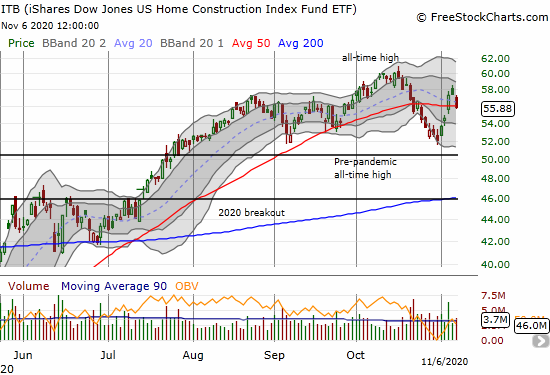
Call options on the iShares Dow Jones US Home Construction Index Fund (ITB) formed the second part of my launch into the seasonal trade on home builders. The pullback in October was a classic opportunity. After finding a bottom near the the pre-pandemic all-time high, ITB shot straight up. The ETF pulled off a 50-day moving average (DMA) breakout and the next day gapped higher again (the 50DMA is the red trendline in the chart below). At that point, my informal option trading rules triggered profit-taking: without an immediate catalyst driving the rally, the risk/reward was tilted against holding a decaying asset. ITB proceeded to fade into a flat close and the next day marginally closed below its 50DMA. ITB looks like it will remain in a trading range for some time to come.
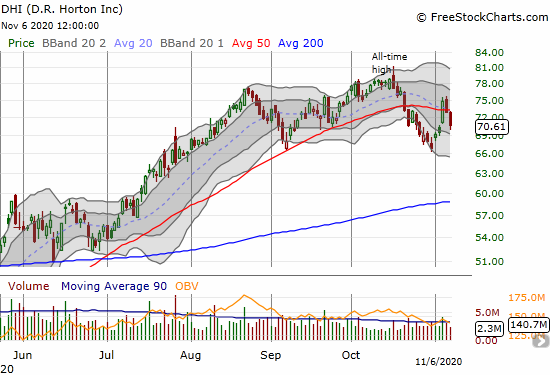
D.R. Horton Inc (DHI) is one of several home builders mimicking the move in ITB. DHI’s 50DMA breakout lasted just a day. The last two days delivered a swift reversal in fortunes. DHI also looks like it is setting up for an extended trading range.
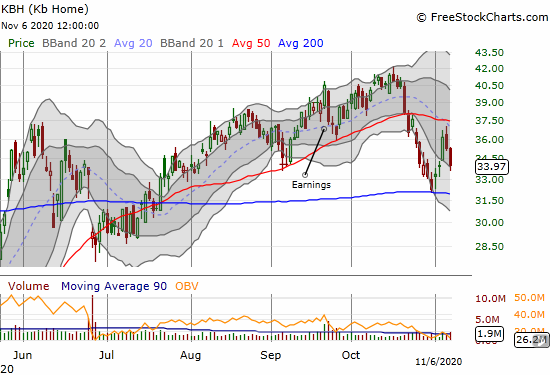
KB Home (KBH) was my first trade for the current seasonal trade in home builders. I sold a call option against shares that whittled to near nothing on the sell-off to 200DMA support. I closed out that call (took profits) and sold a November $38 call as KBH approached 50DMA resistance. That call option is now nearly worthless, and I will cover it this week. These call options do not yet cover the loss on the shares. Still, selling covered calls is a good strategy for a trading range. I will only add more shares if KBH tests its June low around $28.50.
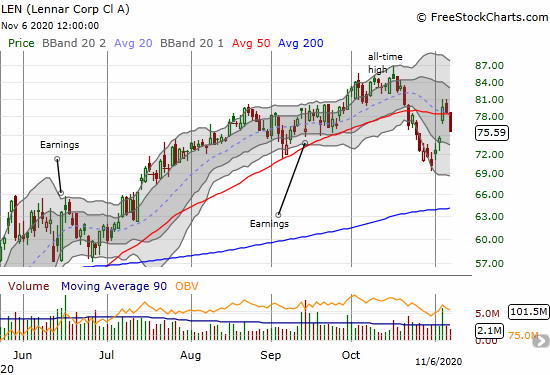
Lennar Corp (LEN) received tepid responses to its last two earnings reports. In both cases, the market took its time to buy into the stock. October’s selling took LEN below September earnings, and now it is struggling at 50DMA resistance.
Of the stocks on this list, Meritage Homes (MTH) appears the most problematic. Three weeks after setting an all-time high, MTH lost 6.7% after reporting earnings. The company was about as bullish as a builder can get, so the subsequent selling implies investors think the company’s results are about as good as they can get for now. MTH has yet to recover from the post-earnings selling. The stock is currently pivoting around its former all-time high. I am not interested in buying MTH, one of my favorite home builder stocks, until it gets closer to 200DMA support (the blue trendline in the chart below).

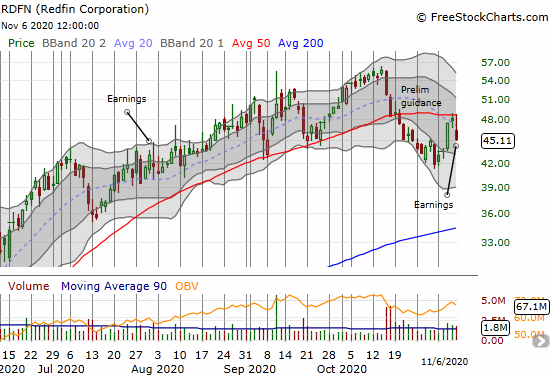
Redfin (RDFN) dropped as low as $9.66 during the stock market collapse in March and subsequently soared from there. The selling after RDFN announced preliminary guidance marks a significant change in fortunes. RDFN lost 5.7% after reporting its full earnings. The stock looks topped out for now. It is not (yet) on my list of buys for the seasonal trade.
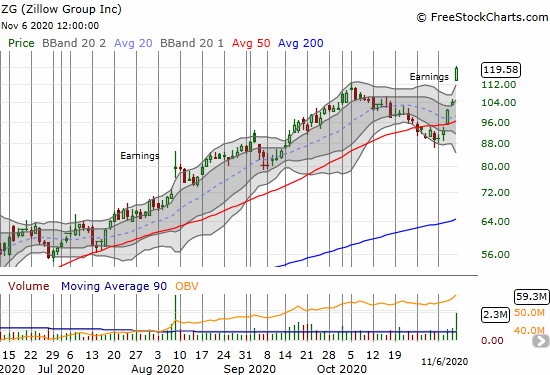
Interestingly, Redfin competitor Zillow Group (ZG) received applause and praise after its earnings report. The stock hit a new all-time high and remains a clear “buy the dip” stock. I plan to review earnings in the coming week or two.
The overall message from the stock market looks like a “wait and see” signal embedded with a divergence in the housing market. This theme could dominate these housing market reviews for several months to come. The rally in ITB slowed down in August, and continued strong housing data has yet to reignite the momentum. In other words, it is very likely the stock market already priced in a lot of good news from the housing sector.
In the second half of 2021, the comparables to 2020 results will be extremely difficult. Investors may start to anticipate the tough comps just as the seasonal trade in home builders winds down around April or so. So even as the housing data may remain strong, my upside expectations for housing-related stocks are quite muted for the coming months. However, as long as the stocks maintain trading ranges, then the seasonal trade can still work quite well.
Housing Data
New Residential Construction (Single-Family Housing Starts) – September, 2020
Riding continued builder optimism and enthusiasm, housing starts hit a new 13+ year high. September single-family home starts reached 1,108,000 which was 8.5% above August’s 1,021,000 starts (unrevised) and a whopping 24.3% above September, 2019. After two straight months of significant upward revisions, September surprisingly came with no revision of the August housing starts. The rate of year-over-year change has been positive for three straight months.
Source: US. Bureau of the Census, Privately Owned Housing Starts: 1-Unit Structures [HOUST1F], first retrieved from FRED, Federal Reserve Bank of St. Louis, November 1, 2020.
For August, the Northeast was the one region that somehow managed to print a year-over-year decline in starts. In September, three of four regions ripped higher. The Northeast, Midwest, South, and West each changed +47.9%, +17.7%, +22.2%, +28.1% respectively. Starts in the West surged off a 13-month low in August but only inched forward 1.6% from August to September. Starts in the West are still not yet back to the post financial crisis high set in January, 2020.
Existing Home Sales – September, 2020
Existing home sales reached another 14-year high in September despite more declines in inventory and increases in prices. Condos sales slowed down relative to single-family homes.
In July, existing home sales jumped past the February peak,. In August and now September, sales pushed on toward 14+ year highs. The National Association of Realtors (NAR) marveled at the counter-seasonal strength: “Home sales traditionally taper off toward the end of the year, but in September they surged beyond what we normally see during this season.” The NAR still lamented the dearth of housing inventory but took solace in the blistering pace of housing starts.
The seasonally adjusted annualized sales in September of 6.54M soared 9.4% month-over-month from the slightly downwardly revised 5.98M in existing sales for August. Year-over-year sales leapt 20.9%.
Condos led the way downward during the pandemic by plunging to levels unseen since at least 1999 (available data). While condo sales soared 31.8% from June to July, they were flat with July, 2019 sales. In August, condo sales increased 8.6% year-over-year and increased 13.6% year-over-year in September. The widening divergence between single-family homes symbolizes the on-going preference of buyers for suburban over densely populated urban areas.

(As of the March, 2018 data, the NAR further reduced historical data to just 13 months. For historical data from 1999 to 2014, click here. For historical data from 2014 to 2018, click here) Source for chart: National Association of Realtors, Existing Home Sales© [EXHOSLUSM495S], retrieved from FRED, Federal Reserve Bank of St. Louis, November 1, 2020.

The absolute inventory levels of 1.47M homes dropped slightly from August by 1.3%. Inventory sank 19.2% from a year ago (compare to August’s 18.6%, July’s 21.1%, June’s 18.2%, May’s 18.8%, April’s 19.7%, March’s 10.2%, February’s 9.8%, January’s 10.7% and December’s 8.5% year-over-year declines, unrevised). “Unsold inventory sits at a 2.7-month supply at the current sales pace, down from 3.0 months in August and down from the 4.0-month figure recorded in September 2019.” The 2.7 months of supply is a record low for existing homes. Moreover, the average 21 days it took to sell a home was a record low for existing home sales. The on-going year-over-year decline in inventory is now on a 16-month streak. The tightening constraint on supply continues to push prices ever higher.
The median price of an existing home hit another record. The $311,800 price tag represents a large year-over-year jump of 14.8% and the 103rd straight month of a year-over-year gain. The median price inched higher by 0.5% from August.
First-time home buyers took a 31% share of sales in September, down from 33% in August and the 33% a year ago. Given the on-going narrative of first-timer millennials rushing into the market, I was surprised by this drop in share in the face of a fresh surge in sales. They must have a preference for new homes. The NAR’s 2017 Profile of Home Buyers and Sellers reported an average of 34% for 2017, 33% for 2018, and 33% for 2019.
Investors stepped into the breach in May by increasing from April’s 10% share of sales to 14%. This share plunged down to 9% in June which seemed to be a seasonal pattern. Investors freshly rushed into the market by grabbing a 15% share of sales in July and stayed steady at 14% in August. Investors dropped to a 12% share despite the NAR reporting “sales in vacation destination counties have seen a strong acceleration since July, with a 34% year-over-year gain in September.” In other words, the drivers of the current market are now move-up buyers. These buyers are likely the least price sensitive of the group and may represent a “final phase” of this recession-era run-up in housing demand.
In August, the Northeast joined the other three regions with year-over-year gains in sales, but it still lagged. In September, the Northeast led. The regional year-over-year changes were: Northeast +22.9%, Midwest +19.8%, South +22.3%, West +18.1%.
From September, 2019 through April, 2020, all regions experienced notable and robust price jumps. In May, the West finally broke that streak with a rare price pullback. All regions have recorded strong price gains since May. The regional September price gains were truly breathtaking: Northeast +17.8%, Midwest +14.8%, South +13.0%, West +17.1%.
Single-family home sales increased 9.7% from August and increased on a yearly basis by 21.8%. I thought August’s small sequential gain might signal a normalization in the market for existing homes, but I was clearly far too early. The median price of $316,200 was up 15.2% year-over-year and up significantly from last September’s $274,400.
California Existing Home Sales – September, 2020
The report from the California Association of Realtors (C.AR.) delivered two main highlights: 1) extremely strong sales in resort markets, and 2) an even more extreme scarcity of inventory particularly hitting affordable markets.
The sales figures in resort markets are incredibly strong. From C.A.R.:
“South Lake Tahoe home sales continued to increase year-over-year by triple-digits (105.4%) for the second consecutive month, while Rim O’ the World and Tahoe Sierra surged from a year ago by 107.6 percent and 73.6 percent, respectively.”
The blistering pace of sales in higher-end markets helped to drive median home prices in California ever higher. September’s record median price of $712,430 was an increase of 0.8% from August’s $706,900 and a year-over-year surge of 17.6%.
At the same time higher-end sales are soaring, more affordable Californian markets are hindered more than ever by tight inventory. From C.A.R.:
“Active listings in every price range continued to decline sharply from last year, with for-sale properties priced below $1 million falling 56 percent on a year-over-year basis. Compared to a year ago, the supply for homes priced between $1 million and $3 million declined 30.4 percent, and homes priced at or above the $3 million benchmark declined 19.4 percent.”
As a result of strong housing demand and ever-shrinking listings, C.A.R.’s Unsold Inventory Index (UII) plunged year-over-year from 3.6 months of sales to 2.0 months of sales. C.A.R.’s Unsold Inventory Index (UII) was last this low 16 years ago. Moreover, the median time for an existing Californian home to sell hit an all-time low of 11 days. A year ago the median number of days was 24. Homes are flying off the shelves!
All these forces drove single-family existing home sales up 5.2% month-over-month and an extraordinary 21.2% from September, 2019. Yet, even with the 489,590 sales pace in September, existing home sales are still down 3.7% year-over-year year-to-date.
Existing, single-family home sales totaled 489,590 in September on a seasonally adjusted annualized rate, up 5.2 percent from August and up 21.2 percent from September 2019.
New Residential Sales (Single-Family) – September, 2020
New home sales took me aback in June. For July, the data startled me. August just left me speechless. September sales finally ended scorching month-over-month sales increases.
August new home sales hit a 14-year high. September sales of 959K declined 3.5% from the downwardly revised sales in August of 994,000. These sales were still
up 32.1% year-over-year.
Source: US. Bureau of the Census, New One Family Houses Sold: United States [HSN1F], first retrieved from FRED, Federal Reserve Bank of St. Louis, November 1, 2020.
Median home prices remain in an extended period of stabilization, largely thanks to the rush for lower-priced homes. The median price hit a peak in November, 2017 at $343,400. Since then, it hit a low of $305,400 in January, 2019. In August, the median price dropped 4.6% from July and dropped 4.3% year-over-year. In September, the median price rebounded 1.4% from August and 3.5% year-over-year. As I noted in the last Housing Market Review, this price range is a distinct contrast to the relentless ascent in price for existing homes. The price per square foot reveals the true underlying trend. Most likely, the shrinking footprint of new homes has held the median price in check.
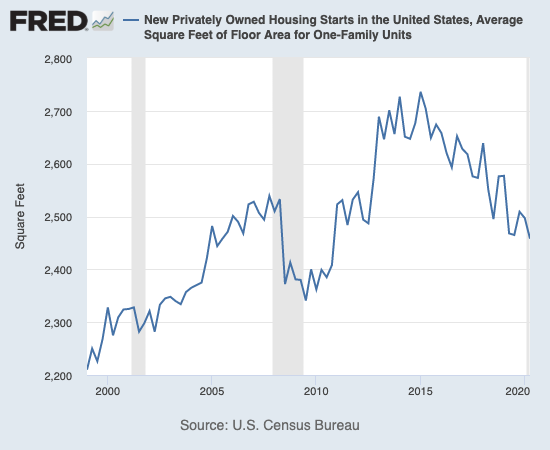
Source for chart: U.S. Census Bureau and U.S. Department of Housing and Urban Development, New Privately Owned Housing Starts in the United States, Average Square Feet of Floor Area for One-Family Units [HOUSTSFLAA1FQ], retrieved from FRED, Federal Reserve Bank of St. Louis; November 5, 2020.
The rebound in the median price was largely driven by a large shift to higher priced homes in September. The most expensive tier, $750K and over, jumped from 5% to 8% of sales. The next tier down moved from 10% to 11% of sales. The combined $150,000 to $299,999 price tiers declined a collective 4 percentage points of share.
The monthly inventory of new homes for sale declined from 4.8 in May to 3.4 in August. Inventory increased slightly to 3.6 months of sales in September.
While the Northeast led regions for existing home sales, the Northeast was a drag on the sale of new homes. In September, the Northeast suddenly declined year-over-year by 5.9% a month after growing 27.3% year-over-year. The Midwest jumped 34.8%. The South decelerated but still grew 27.4% year-over-year. The West fired back up from August’s 26.5% year-over-year growth to September’s 49.7% surge.
Home Builder Confidence: The Housing Market Index – October, 2020
The National Association of Home Builders (NAHB) reported yet another historic NAHB/Wells Fargo Housing Market Index (HMI). The HMI of 85 in October set the third straight all-time high for builder sentiment. All three components of the HMI hit all-time highs as well although the traffic of prospective buyers was flat at 74 with September’s all-time high. The swift and steep ascent for HMI continues to astound me.
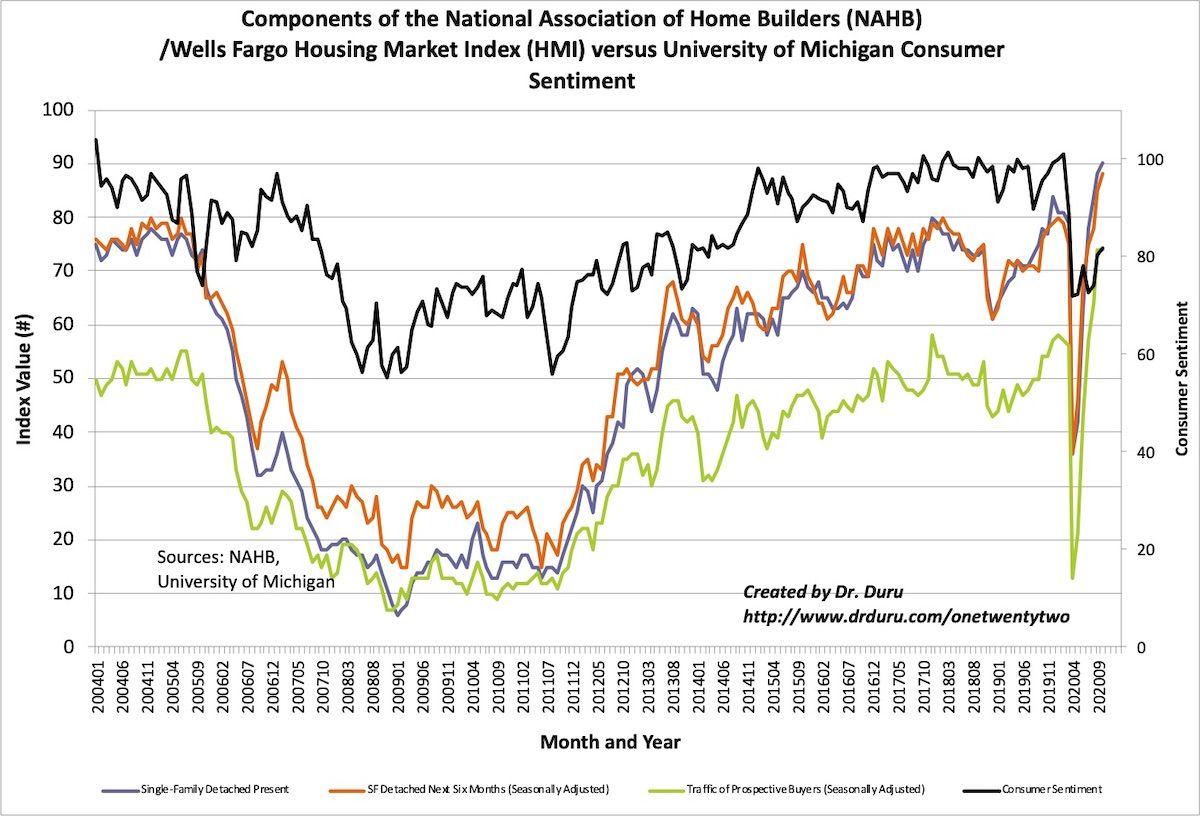
Source for data: NAHB
Builder optimism only pushed sentiment for two of four regions to fresh all-time highs. The West surged to 95 and pushed past its former all-time high of 91 from October, 2004. The Northeast HMI also surged from 81 to 88. The Midwest and the South took small steps backward off their all-time highs. This divergence is notable but not alarming for now.
Home closing thoughts
A Looming Cloud of Evictions and Mortgage Forebearance
The signs of a “K-style” economic recovery are most evident in the housing market. While the data described above celebrate an incredible housing boom (the part of the K pointing upward), a large swath of people are worried they will have no place to live in coming months (the part of the K pointing downward). Renters received relief from temporary holds on evictions and home owners received a grace period from limited mortgage forbearance programs. If these programs run out before the economy strengthens enough to support incomes, growing fears of economic woes could easily sap the enthusiasm from the housing market.
“In the last six months, around 18% of renters have missed at least one payment, according to the most recent Marketplace-Edison Research Poll, and experts estimate that between 30 and 40 million people are at risk of eviction — or will be once they are no longer protected by an eviction moratorium.”
There are “…2.9 million [households] in active forbearance, according to a report Friday from mortgage data company Black Knight. That’s down 40% from the peak in May. But in the past week, 87,000 loans have gone into new forbearance plans, the highest volume since mid-April.”
Portable Property Tax Benefits
Marketplace covered California Proposition 19 ahead of the election. This proposition allows homeowners who are above age 55, disabled, or victims of a natural disaster to transfer the property tax rate of their current home to a newly purchased home. The proposition passed easily with 58.6% of voters saying yes. The National Association of Realtors largely funded the campaign for this measure.
The NAR has long lamented the lack of inventory of existing homes, and Proposition 19 is a well-packaged move to motivate more housing transactions in California. While the headlines on this Proposition look well-meaning, the portability of property tax rates means that counties bear the cost of tax shortfalls when people move and get to pay less than the prevailing rate on property taxes. Proposition 19 has a clause that requires the state to apply savings from this measure to help counties on the losing end of this bargain. However, I am very skeptical that the fund will be sufficient to close gaps.
Be careful out there!
Full disclosure: long KBH shares and short a call