
Stock Market Statistics
AT40 = 51.5% of stocks are trading above their respective 40-day moving averages (DMAs)
AT200 = 35.6% of stocks are trading above their respective 200DMAs
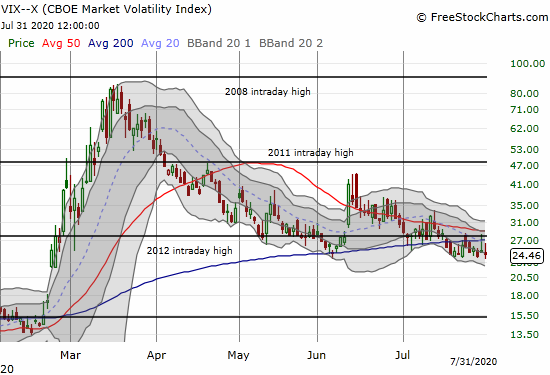
VIX = 24.5
Short-term Trading Call: neutral
Stock Market Commentary
Major League Baseball (MLB) may be forced to wind back down, but stocks look like they are winding back up.
A week ago, stocks experienced a small unwind ahead of a week promising to deliver fireworks-worthy events. While the S&P 500 churned, big cap tech stocks refreshed and ended the week with a surge. These stocks were also largely responsible for the S&P 500’s gains on Friday. The price action was almost a return to business for the stock market’s top 1%.
AT40 (T2108), the percentage of stocks trading above their respective 40-day moving averages (DMAs), maintained the same business by going absolutely nowhere all week. My favorite technical indicator closed the week at 51.5%; AT40 closed the previous week at 53.8%. With big cap tech sprinting ahead on a binge of earnings news, a fresh divergence opened up. Yet AT40 did not pull back enough for me to label the divergence bearish.
The Stock Market Indices
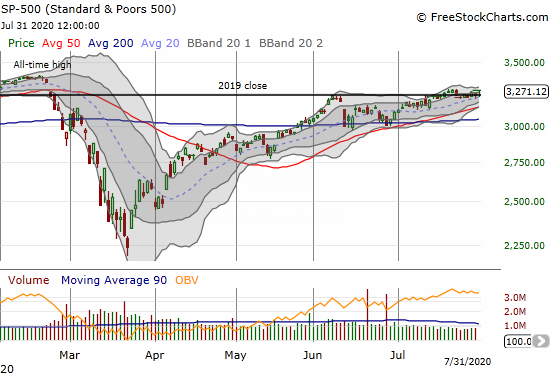
The S&P 500 (SPY) ended the month of July with a 0.8% gain and a small year-to-date gain. The moves look unexciting as the index churned a lot and closed just under the closing high for July set on the 22nd of the month. Is this relative a springboard for the next move higher or a stalling of the engines before a fall?
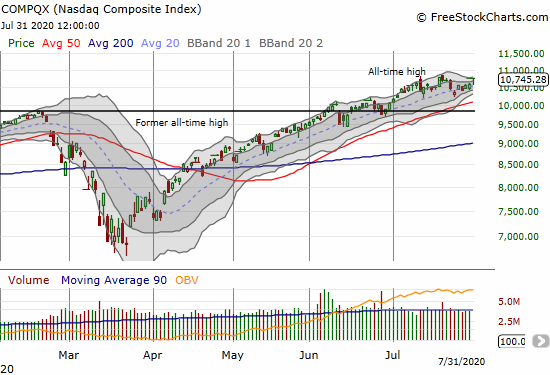
The NASDAQ (COMPQX) closed the month just under its all-time high set on July 20th. The previous week’s price action had analysts thinking bearishly. After surviving another Congressional grilling and delivering strong earnings, big cap tech in particular returned to a bullish playbook. Alphabet (GOOG) was a glaring exception in losing 3.2% while its stockmates surged.
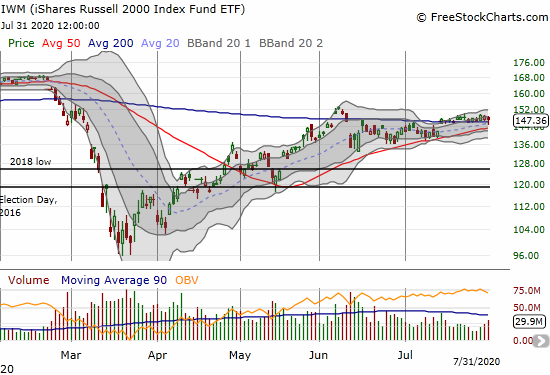
Small-cap stocks are straining to gain fresh momentum. The iShares Russell 2000 Index Fund ETF (IWM) last broke out above its 200DA two weeks ago. The 200DMA keeps pulling IWM back like a magnet.
Volatility
The volatility index (VIX) keeps showing brief signs of life before faders return to push it back. The VIX continues to hover over its post-crash lows.
The Short-Term Trading Call
The neutral short-term trading call has become boring, but it remains appropriate. The NASDAQ out-performed while other major indices made little to no progress. At the same time, laggard indices did not display sustained signs of bearishness. The sleepy S&P 500 (SPY) looks well-supported. The next pullback will likely find support at the uptrending 50DMA.
Stock Chart Reviews: A Video Summary
Stock Chart Reviews – Below the 50DMA
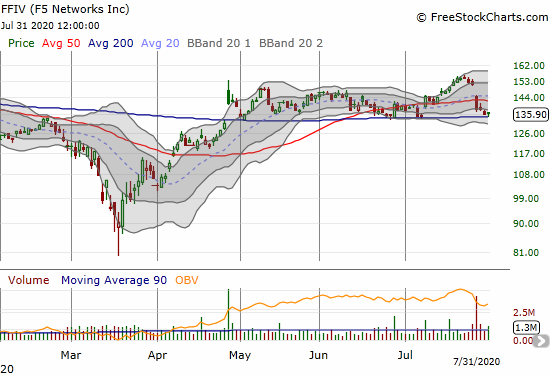
F5 Networks Inc (FFIV)
F5 Networks (FFIV) caught my attention after selling off 8.8% post-earnings. The stock is trying to find support at its 200DMA. If successful – a close above $137.25 – I am a buyer. A 200DMA breakdown would be particularly bearish for FFIV given this support was critical in June and early July.
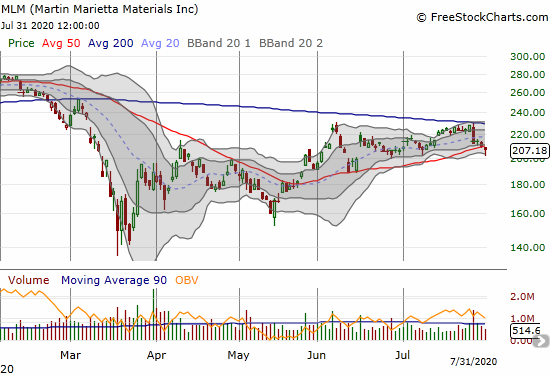
Martin Marietta Materials (MLM)
Martin Marietta Materials (MLM) confirmed resistance at its 200DMA with a 50DMA breakdown. I was looking to buy a 200DMA breakout. I do not want to short this stock as I think materials companies have a strong rally coming sometime in the future.
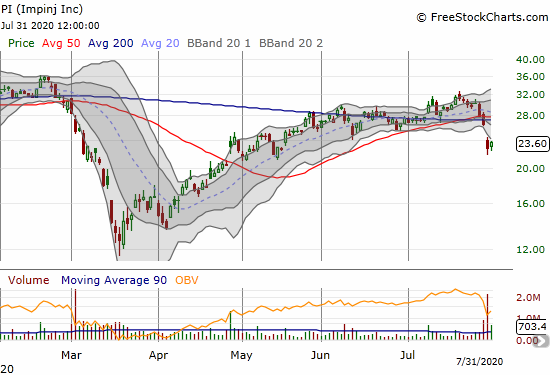
Impinj (PI)
Impinj (PI) was a bullish 200DMA breakout in early July. The trade worked out OK for about two weeks. Earnings destroyed the trade. The stock suffered a 50DMA breakdown ahead of earnings which should have warned me. PI sold off 13.8% post-earnings. I almost closed up shop. Instead, I decided to see whether sellers would follow through. Buyers on Friday delivered a 3.6% gain and a chance I can hold on to the position for a recovery.
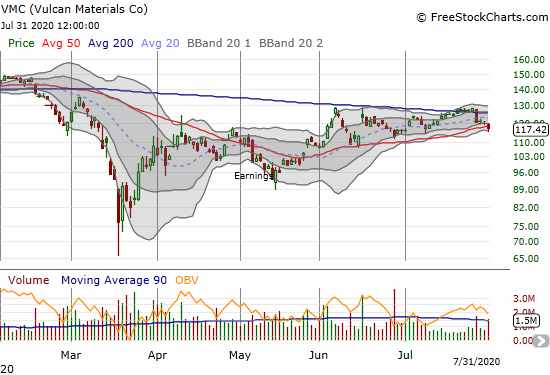
Vulcan Materials (VMC)
Vulcan Materials (VMC) joined MLM with a 50DMA breakdown. VMC trading volume also picked up. This bearish trading action is a warning ahead of August 4th earnings. My view on VMC is the same as MLM.
Stock Chart Reviews – Above the 50DMA
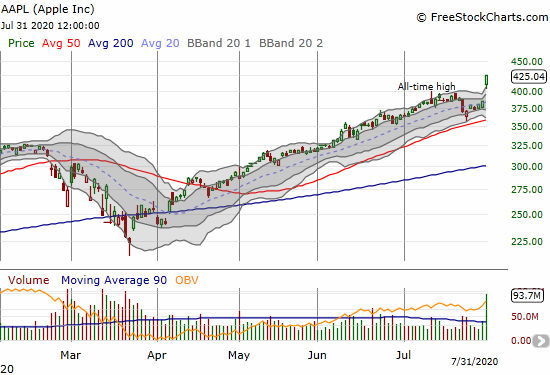
Apple (AAPL)
Apple (AAPL) was of course the star of the week. Apple announced a 4:1 stock split along with surprisingly strong earnings. How does a company sell MORE iPhones from a year ago in the middle of a deep recession? AAPL closed at its high of the day, above its upper Bollinger Band (BB), with a startling 10.5% post-earnings gain. This price action is the very definition of bullishness.
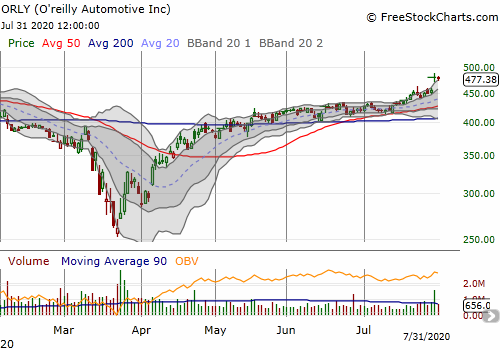
O’reilly Automotive (ORLY)
O’reilly Automotive (ORLY) gained 5.4% post-earnings for a new all-time high. This price action further confirmed a bullish breakout earlier in July.
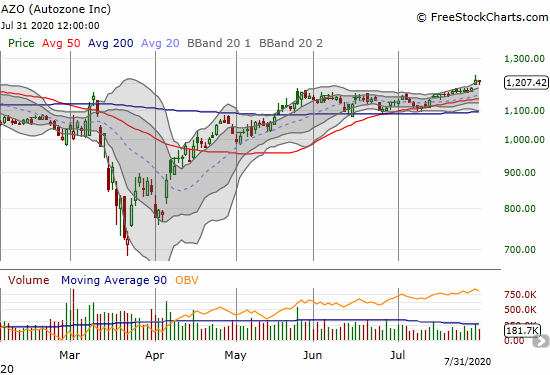
Autozone (AZO)
Autozone (AZO) benefited from ORLY’s post-earnings gain. AZO gained 2.6% and created a more convincing breakout than the melt-up earlier in the week. I waited a long time for this kind of price action. It helps me lock in my AZO position as a longer-term holding.
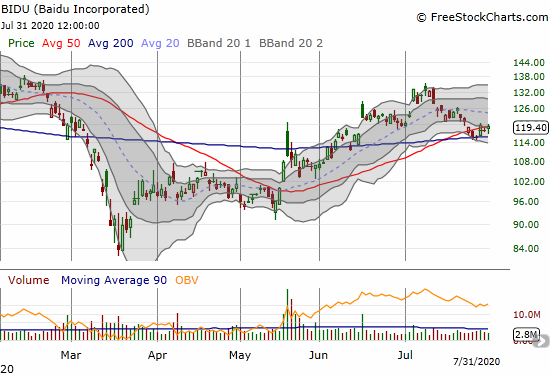
Baidu Incorporated (BIDU)
Baidu Incorporated (BIDU) broke out of its primary uptrend when it closed below its 20DMA in mid-July. BIDU survived a test of its 200DMA and is trying to break free of its 50DMA. I speculated one more time on BIDU call options.
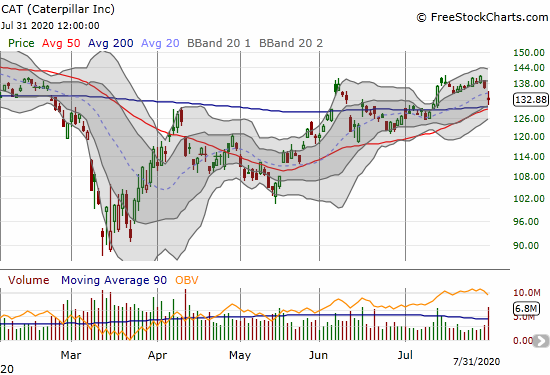
Caterpillar Inc (CAT)
I am back to watching Caterpillar (CAT) closely. CAT lost 2.8% post-earnings. The stock bounced off converged 50/200DMA support. If CAT slices through this support, I will not even wait for a close to return to buying put options as a (partial) hedge on bullish positions.
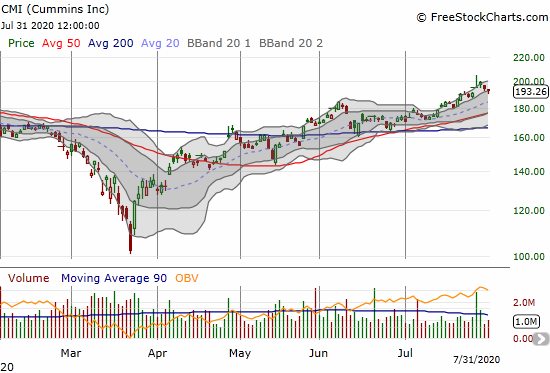
Cummins Inc. (CMI)
After seeing Caterpillar stumble a bit, I did a quick check on other related industrial stocks. Cummins (CMI) received a positive post-earnings response, but the stock faded sharply from its intra-day high. On Friday, CMI finished reversing its post-earnings gain while holding onto its primary uptrend in its upper-BB channel. CMI closed right at its former all-time high set January, 2018. If CMI manages to close higher from here, I am a buyer of call options.
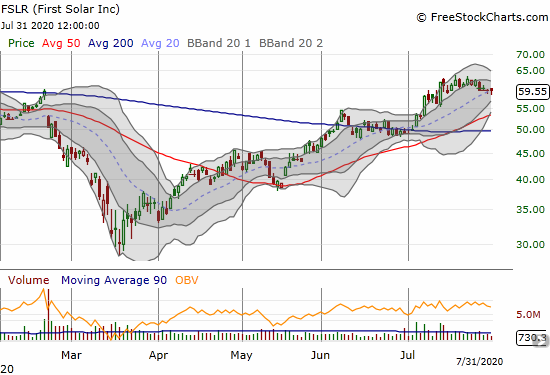
First Solar (FSLR)
First Solar (FSLR) failed to hold 200DMA breakouts in February and then in June. July’s 200DMA breakout delivered. Now a BB squeeze is starting to form ahead of earnings next week. I wish I bought a position earlier. Now, I will just wait to see what happens post-earnings.
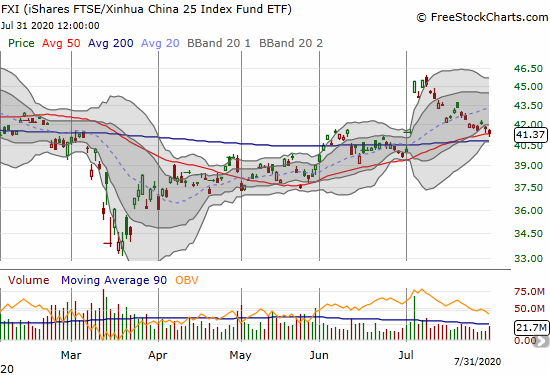
iShares FTSE Xinhua China (FXI)
The fade continues in iShares FTSE Xinhua China (FXI). While I was wary about the big surge in early July, I did NOT expect FXI to eventually fully reverse its gains. On Thursday, I jumped into shares and call options assuming FXI would hold 50DMA support. Friday’s 1.0% loss made this support look ever so weaker.
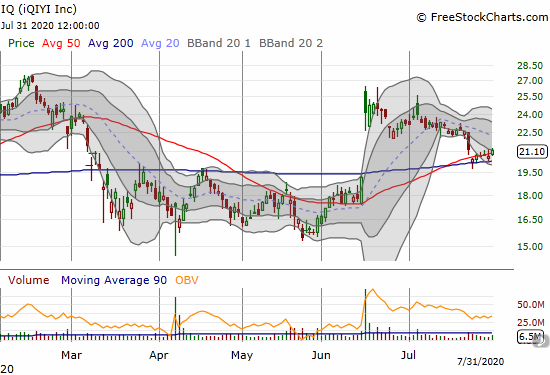
iQIYI (IQ)
iQIYI (IQ) surged in mid-June. At the time, I lamented missing the big move in a stock I previously habitually bought on dips and sold on rips. IQ has yet to follow-through on June’s momentum. Even the July pop in Chinese stocks (represented by FXI) failed to reignite momentum for IQ. The current reversal is tempting me to restart trading IQ. Earnings are likely happening in about two weeks so only renewed buying interest will get me back in before then.
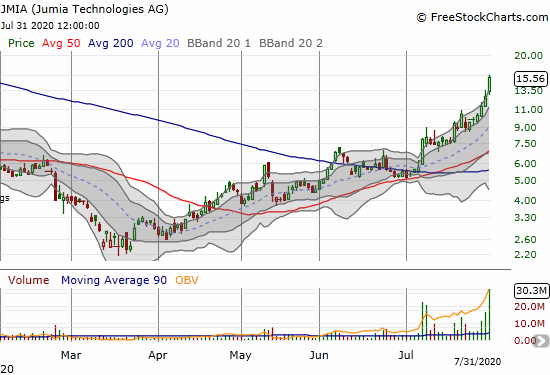
Jumia Technologies (JMIA)
It has been five long months since I issued a mea culpa on Jumia Technologies (JMIA), a company focused on e-commerce and delivery in emerging markets, especially in Africa. The March market crash took the stock down even further. Suddenly, JMIA is rising like a phoenix.
The stock had a stellar July on the heels of a bullish 200DMA breakout. JMIA is even approaching a 52-week high, but the move is starting to get parabolic. I want to keep holding the stock, but I may need to sell at least half in the coming week given the position has become large. Moreover, earnings must be coming this month. The market briefly sold May earnings despite improvements in the bottom-line and management expressing optimism about increasing orders due to pandemic-related lockdowns.
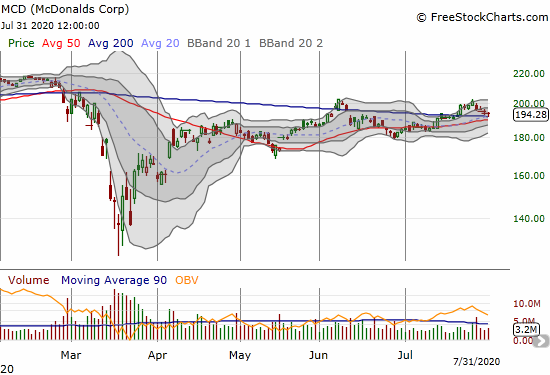
McDonald’s (MCD)
McDonald’s (MCD) pulled back slightly after reporting earnings. The stock is holding on to 200DMA support. I like buying call options here, a calendar or vertical spread with pivots around the $200 level.
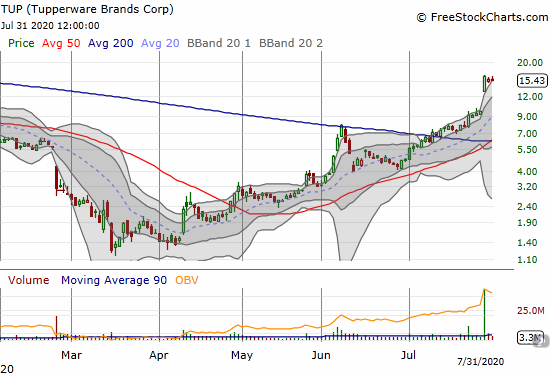
Tupperware Brands Corp (TUP)
Tupperware Brands Corp (TUP) gained 67.7% post-earnings last week. While I did not buy TUP on its 200DMA breakout, this price action further convinced me of the importance of jumping into 200DMA breakout trades in this market. TUP is particularly interesting given the breakout also conquered a bearish confirmation of resistance in June.
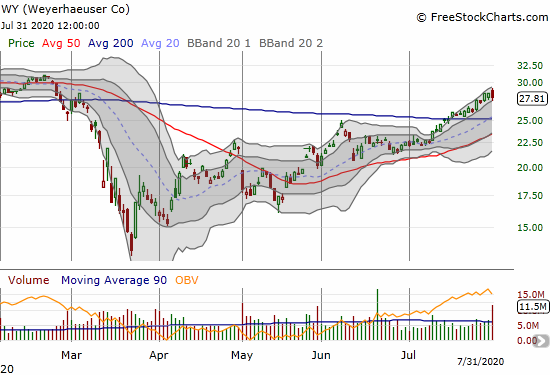
Weyerhaeuser (WY)
Timber company Weyerhaeuser (WY) is a previous 200DMA breakout trade. WY is now on a steady uptrend through its upper-BB. The stock lost 2.1% post-earnings on Friday on high trading volume. The uptrend just barely survived the selling. I am sticking by the position unless buyers take WY below uptrending 50DMA support. WY is a play on the current strength in the housing market and a bet that home builders will eventually ramp starts again to catch up to demand.
Stock Chart Spotlight – Bullish Breakout
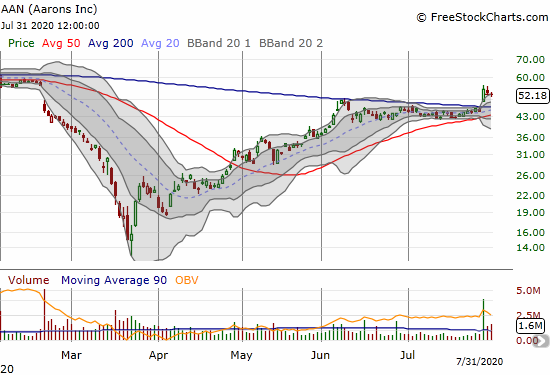
Aarons Inc (AAN)
Household goods rental and leasing company Aarons (AAN) popped out of nowhere for me. AAN gained 20.4% post-earnings. The stock cooled off a bit to tap the upper-BB to close the week. This is enough of a “dip” for me to start accumulating the stock with a stop below the uptrending 50DMA. The all-time high was set in October, 2019 at $78.14. Aarons will soon resplit into two separate publicly traded companies. I hope I can stay in a position until then and see which unit, if not both, continues the upward trajectory.
— – —
FOLLOW Dr. Duru’s commentary on financial markets via email, StockTwits, Twitter, and even Instagram!
“Above the 40” uses the percentage of stocks trading above their respective 40-day moving averages (DMAs) to assess the technical health of the stock market and to identify extremes in market sentiment that are likely to reverse. Abbreviated as AT40, Above the 40 is an alternative label for “T2108” which was created by Worden. Learn more about T2108 on my T2108 Resource Page. AT200, or T2107, measures the percentage of stocks trading above their respective 200DMAs.
Active AT40 (T2108) periods: Day #77 over 20%, Day #71 over 30%, Day #16 over 40%, Day #12 over 50% (overperiod), Day #7 under 60% (underperiod), Day #30 under 70%
Daily AT40 (T2108)
")
Black line: AT40 (T2108) (% measured on the right)
Red line: Overbought threshold (70%); Blue line: Oversold threshold (20%)
Weekly AT40 (T2108)

*All charts created using FreeStockCharts unless otherwise stated
The T2108 charts above are my LATEST updates independent of the date of this given AT40 post. For my latest AT40 post click here.
Be careful out there!
Full disclosure: long UVXY, long BIDU calls, long FXI shares and calls, long JMIA, long PI, long WY, long IWM calls
*Charting notes: FreeStockCharts stock prices are not adjusted for dividends. TradingView.com charts for currencies use Tokyo time as the start of the forex trading day. FreeStockCharts currency charts are based on Eastern U.S. time to define the trading day.