
Sam Ro is a managing editor at Yahoo Finance. Ro’s tweet with data from FactSet and Goldman Sachs (GS) shows how just 5 stocks – Facebook (FB), Amazon.com (AMZN), Apple (AAPL), Microsoft (MSFT), and Alphabet (GOOG) – dominate the S&P 500 (SPY). The top 1 percent seem to be the only story worth telling given the wide divergence in performance with the rest of the 99%.
Below are the key highlights to appreciate from the chart showing the extreme out-performance of the top 1 percent:
- The top 1 percent widened its divergence from the rest of the S&P 500 going into the March stock market crash. That separation was part of the bearish divergence at the time that flipped my short-term trading call on the stock market to bearish.
- The top 1 percent fared a lot better than the rest of the S&P 500 at the market trough (by about 20 percentage points!).
- The top 1 percent further widened its divergence starting in April. However, the rest of the stock market has performed well enough to prevent a bearish divergence except for a brief moment (explained below).
- Without the top 1 precent, the S&P 500 is down 5% for the year – respectable given the pandemic but a far cry from the 35% year-to-date gain of the top 1 percent.
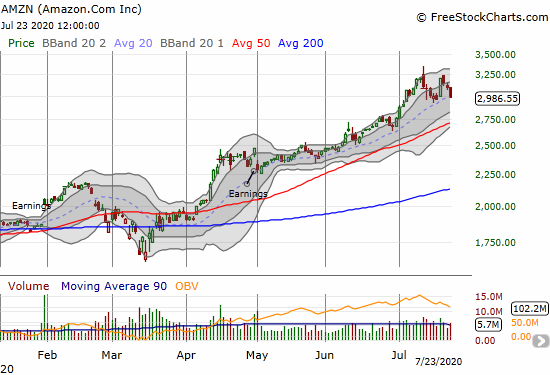
This extreme price action is of great interest given how it can impact the understanding of bearish and bullish divergence with my favorite technical indicator, AT40 (T2108), the percentage of stocks trading above their respective 40-day moving averages (DMAs). A bearish divergence appeared the week of July 6th. Specifically, on July 9th, AT40 hit a 2 1/2 month low while the entire top 1 percent recorded price gains. MSFT and AMZN even hit fresh all-time highs with AMZN surging 3.3% on the day. In other words, the top 1% can very easily drive the entire divergence as investors and traders decide to crowd even further into the elites of the stock market.
A collective drop in the top 1% can act to confirm a bearish divergence. July 13th seemed to deliver the blow to send the market into bearish territory. The S&P 500 fell 0.9% as FB fell 2.5%, AAPL dropped 0.5%, MSFT lost 3.1%, GOOG fell 2.0%, and AMZN plunged 3.0% and created a topping pattern in the form of a bearish engulfing pattern. AMZN has yet to recover and may yet hold the key as to whether the market finally tops out at current levels.
AAPL also has a chart of high interest among the top 1 percent. Apple got hit with news of state investigations into deceptive trade practices. The stock lost a whopping 4.6% and closed below its uptrending 20DMA for the first time since April 3rd, the early days of the rebound off the March crash lows.

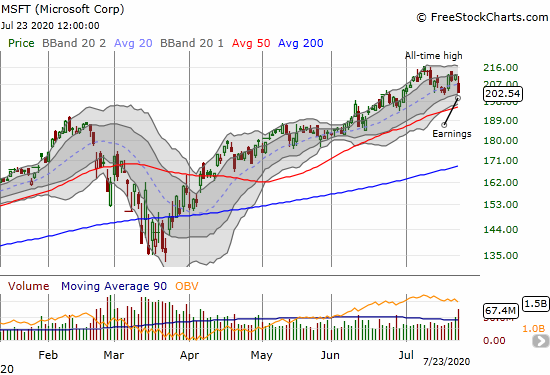
The tensions in the top 1 percent are also elevated as investors sold MSFT after the company reported earnings. MSFT lost 4.4% and returned to a flat performance for the month of July. The rest of the top 1 percent report earnings next week. Given Microsoft’s performance, there should be some good risk/reward pre-earnings options trades to create over the weekend.
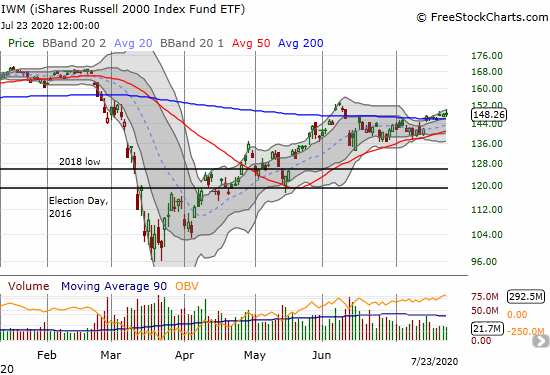
Interestingly, small cap stocks held up for the day. The iShares Russell 2000 Index Fund ETF (IWM) is levitating above its 200DMA support. Suddenly these economically sensitive stocks are tugging at the anchor suddenly dropped by the top 1 percent.
So is the market rotating out of relatively expensive big cap tech and into relatively cheaper parts of the market? Or is a larger pullback brewing with a resumption of follow-through for the earlier bearish divergence?
The currency market is adding its own warning with the Australian dollar versus the Japanese yen (AUD/JPY) apparently topping out at the June high which in turn matched the high at the end of December, 2019. The post-December decline in AUD/JPY further bolstered the bearish case. See “Why the Australian Dollar and Japanese Yen Matter for Stock Traders” for more details on the importance of watching this currency pair.
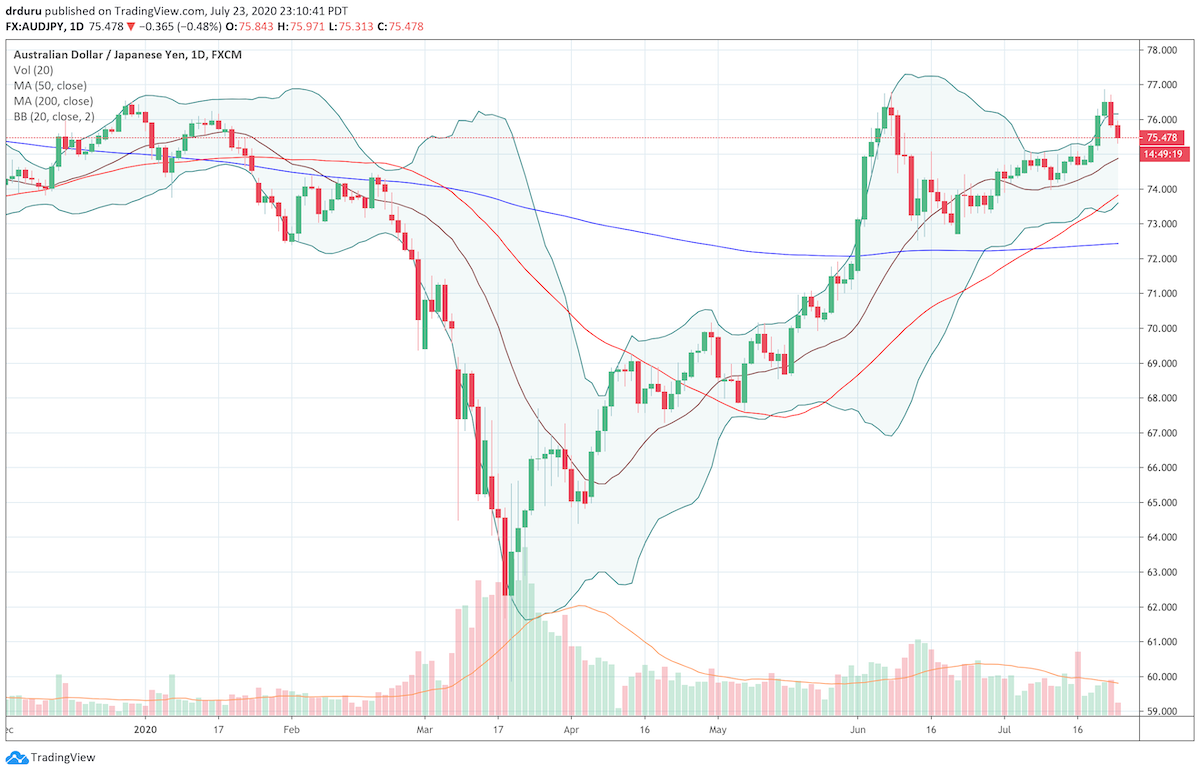
Source: TradingView.com
Be careful out there!
Full disclosure: long AAPL call, long IWM calendar spread, short AUD/JPY, long FB puts