
On January 22, 2018, the iShares Dow Jones Home Construction ETF (ITB) closed at $46.25, a more than 10-year high. In just two and a half weeks, ITB lost 15.0% and did not bottom until the Christmas Eve market bottom at $28.55. Almost 10 months later, investors have almost reversed this entire loss – just another 3.5% to go.
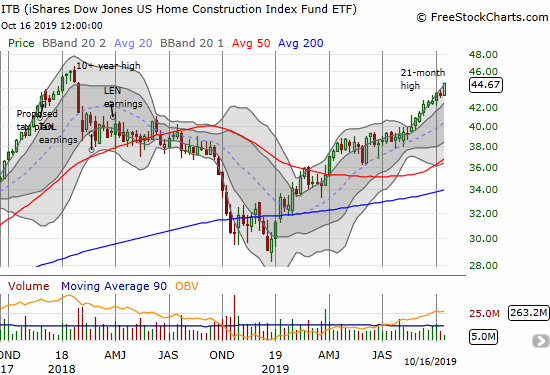
Source: FreeStockCharts
ITB rallied strongly ahead of the start of the seasonally strong period for home builders (October/November). I was slow in recognizing the sustainability of the strength even as I watched the action closely through my monthly housing market reviews. As a result, my first trades were not as aggressive as I prefer for the seasonal strong period for home builders.
My first direct bet on the seasonal trade was an ITB August/October $39 calendar call spread. With ITB drifting ever so slowly upward, I hoped to see the short side of the spread expire worthless. That expiration would then pay for my long calls to profit further going into the start of the seasonally strong period. Instead, ITB drifted above and then just below $39 going into the day before expiration. The calendar call spread hit my initial profit target – I did not want to take the chance of ITB failing to expire worthless the next day (it closed on the day of expiration at $39.14). The moment was bittersweet.
I immediately decided to construct a new trade, but I still moved conservatively. I used the weakness in Toll Brothers (TOL) to buy weekly August puts as a small hedge on a January $40/44 call spread. Those puts expired harmlessly, and now ITB already trades above the top of my call spread. I have even moved to bullish trades in Toll Brothers. With ITB just 3.5% away from the completion of a major reversal, I once again face a decision juncture.
ITB has not returned to its January, 2018 high, but it IS up 48.7% year-to-date. On a risk/reward basis, I cannot shift to a more aggressive position at this point. Once I take profits on the call spread, I either need to wait for a dip or buy into a major breakout (with a freshly conservative setup!).
Today’s move provides a natural point for taking profits on the call spread. ITB closed right at $44 the previous day and today closed well above its upper Bollinger Band (BB) (the line defining two standard deviations away from the 20-day moving average (DMA)). On a close below $44, I will assume the upward momentum is stalling which then gives me a reason to protect profits. Going forward, it may make more sense to target individual stocks which provide their own unique buying opportunities, especially sell-offs after earnings events.
All things considered, I am technically launching the ride to the 2020 Spring selling season which marks the seasonally strong period for home builders.
Be careful out there!
Full disclosure: long ITB call spread, long TOL calls